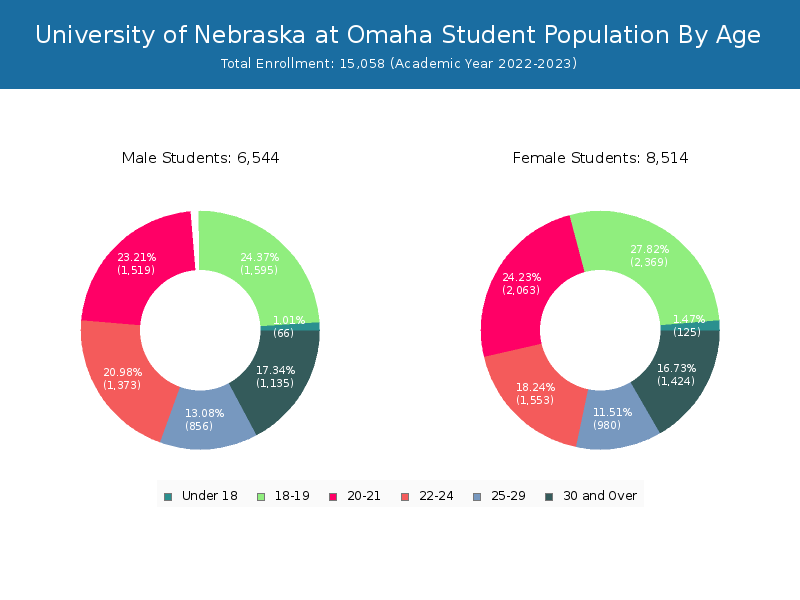
Student Population by Gender
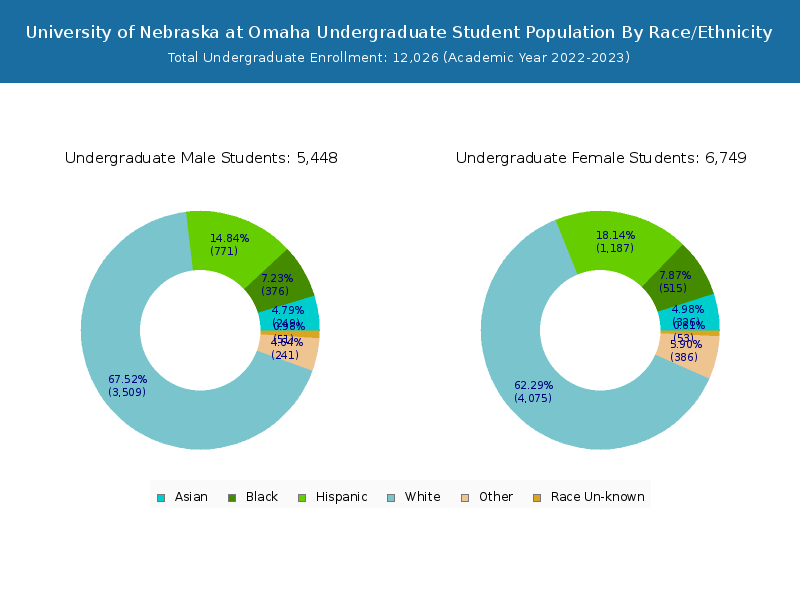
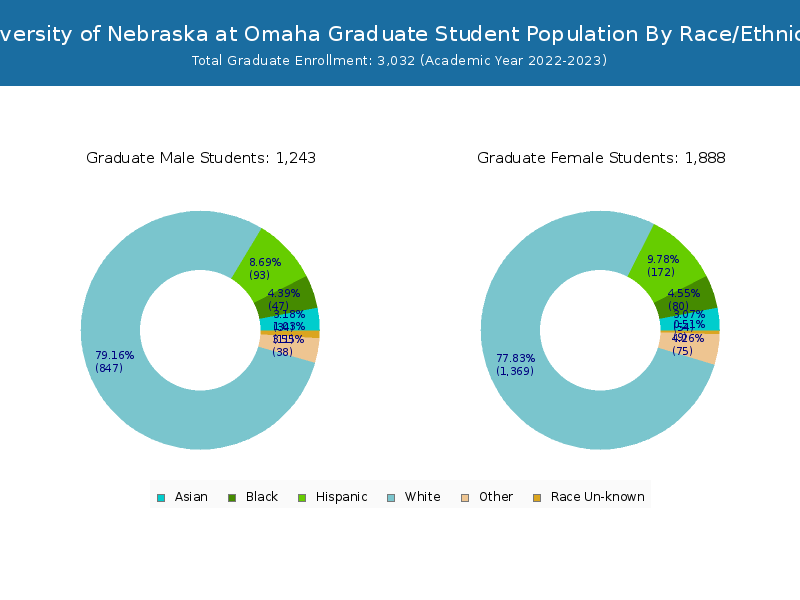
University of Nebraska at Omaha has a total of 15,058 enrolled students for the academic year 2022-2023. 12,026 students have enrolled in undergraduate programs and 3,032 students joined graduate programs.
By gender, 6,544 male and 8,514 female students (the male-female ratio is 43:57) are attending the school. The gender distribution is based on the 2022-2023 data.
| Total | Undergraduate | Graduate | |
|---|---|---|---|
| Total | 15,058 | 12,026 | 3,032 |
| Men | 6,544 | 5,358 | 1,186 |
| Women | 8,514 | 6,668 | 1,846 |
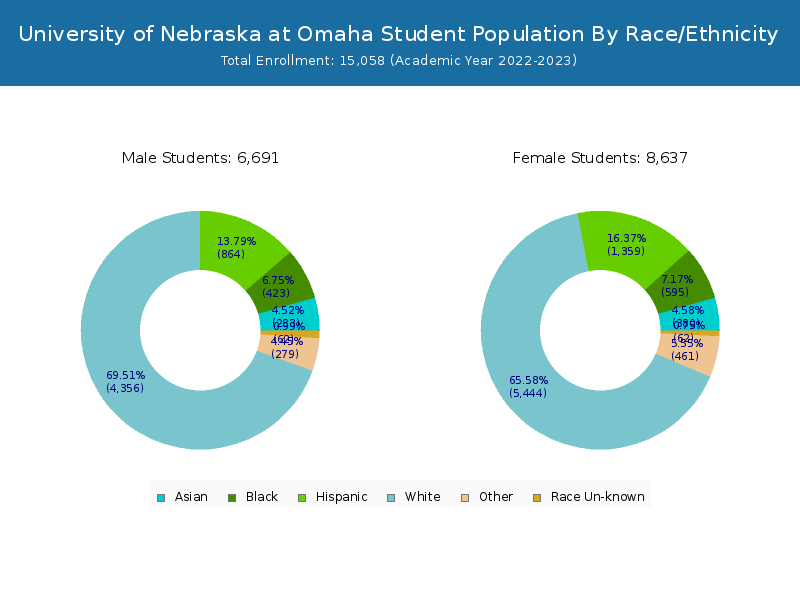
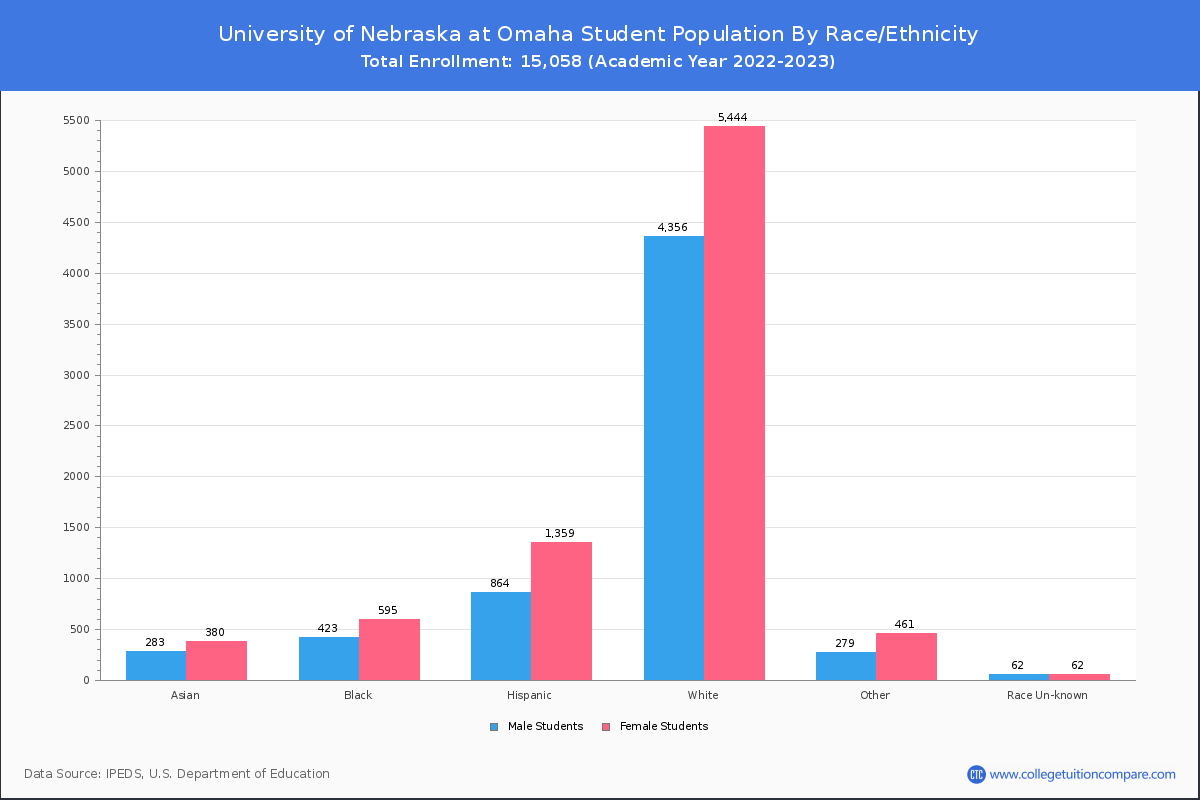
Student Distribution by Race/Ethnicity
By race/ethnicity, 9,453 White, 1,047 Black, and 684 Asian students out of a total of 15,058 are attending at University of Nebraska at Omaha. Comprehensive enrollment statistic data by race/ethnicity is shown in the next chart (Academic year 2022-2023 data).
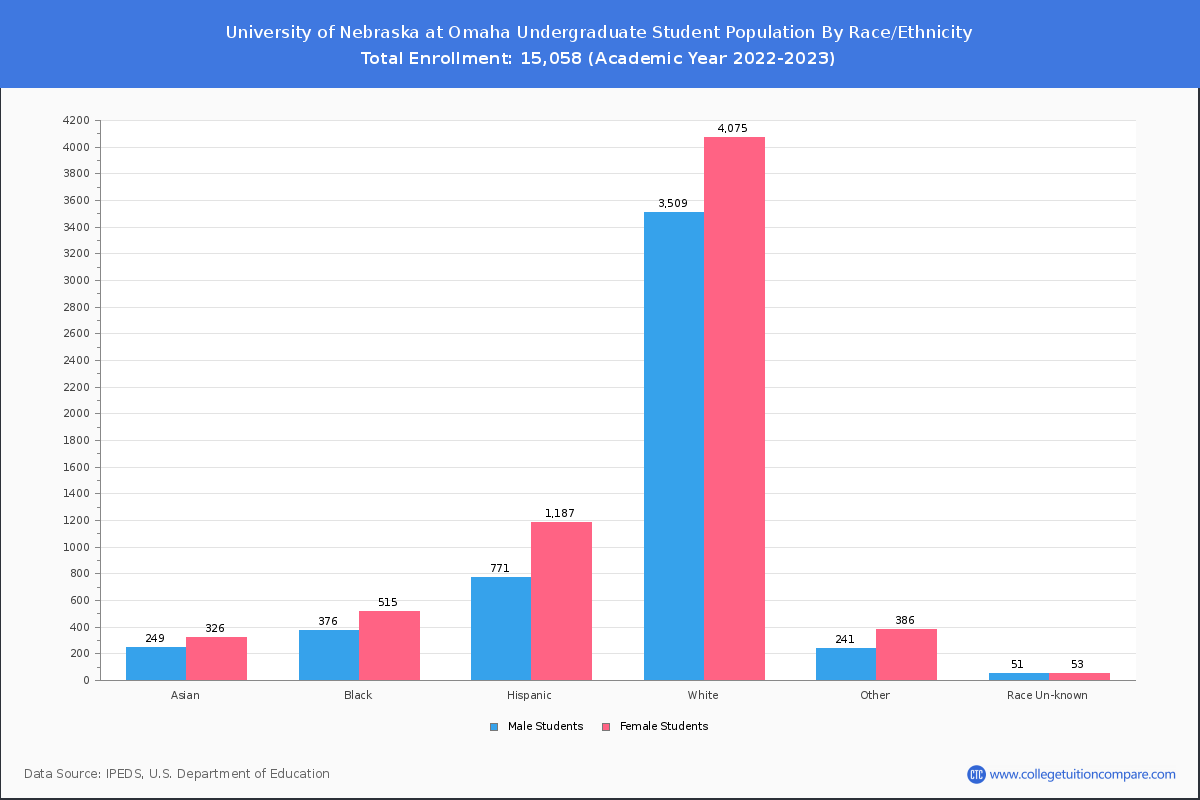
| Race | Total | Men | Women |
|---|---|---|---|
| American Indian or Native American | 45 | 15 | 30 |
| Asian | 684 | 293 | 391 |
| Black | 1,047 | 456 | 591 |
| Hispanic | 2,276 | 879 | 1,397 |
| Native Hawaiian or Other Pacific Islanders | 18 | 7 | 11 |
| White | 9,453 | 4,135 | 5,318 |
| Two or more races | 646 | 249 | 397 |
| Race Unknown | 106 | 55 | 51 |
| Race | Total | Men | Women |
|---|---|---|---|
| American Indian or Native American | 38 | 14 | 24 |
| Asian | 596 | 256 | 340 |
| Black | 912 | 411 | 501 |
| Hispanic | 2,023 | 790 | 1,233 |
| Native Hawaiian or Other Pacific Islanders | 16 | 6 | 10 |
| White | 7,373 | 3,368 | 4,005 |
| Two or more races | 551 | 223 | 328 |
| Race Unknown | 88 | 48 | 40 |
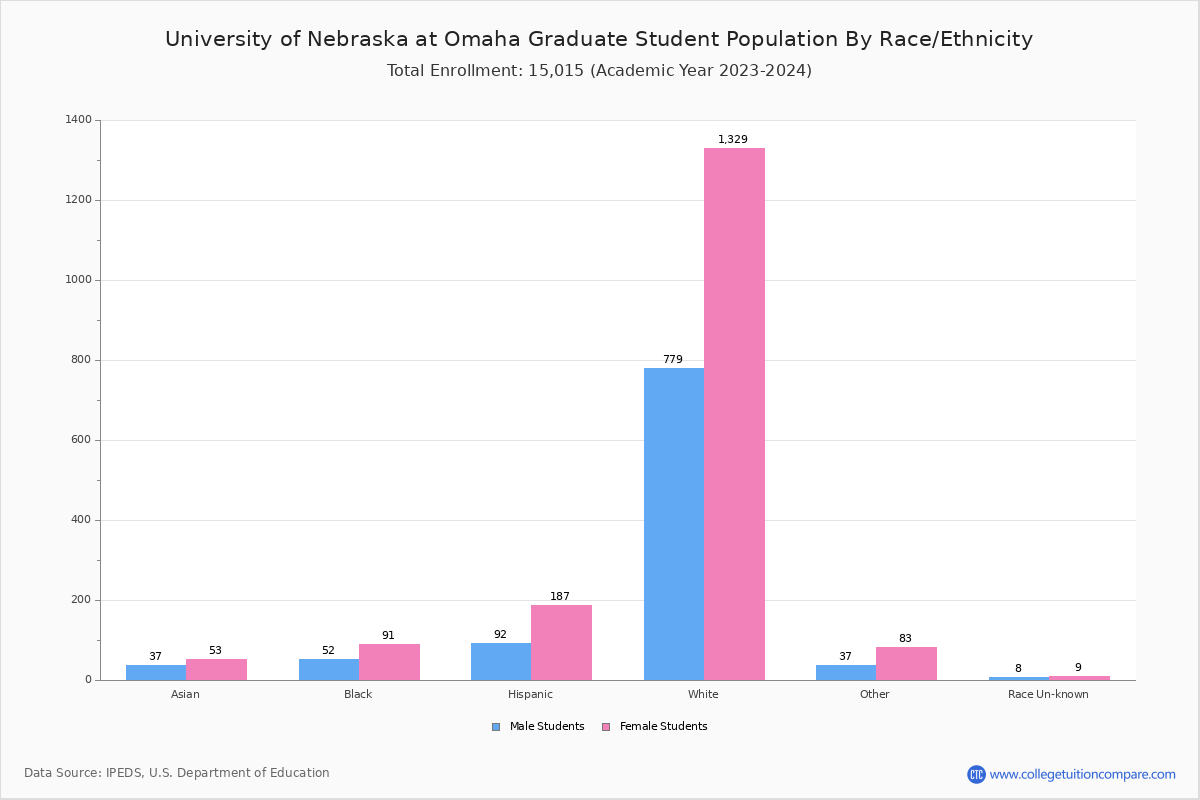
| Race | Total | Men | Women |
|---|---|---|---|
| American Indian or Native American | 3 | 0 | 3 |
| Asian | 38 | 19 | 19 |
| Black | 96 | 60 | 36 |
| Hispanic | 129 | 52 | 77 |
| Native Hawaiian or Other Pacific Islanders | 2 | 1 | 1 |
| White | 667 | 305 | 362 |
| Two or more races | 41 | 15 | 26 |
| Race Unknown | 6 | 5 | 1 |
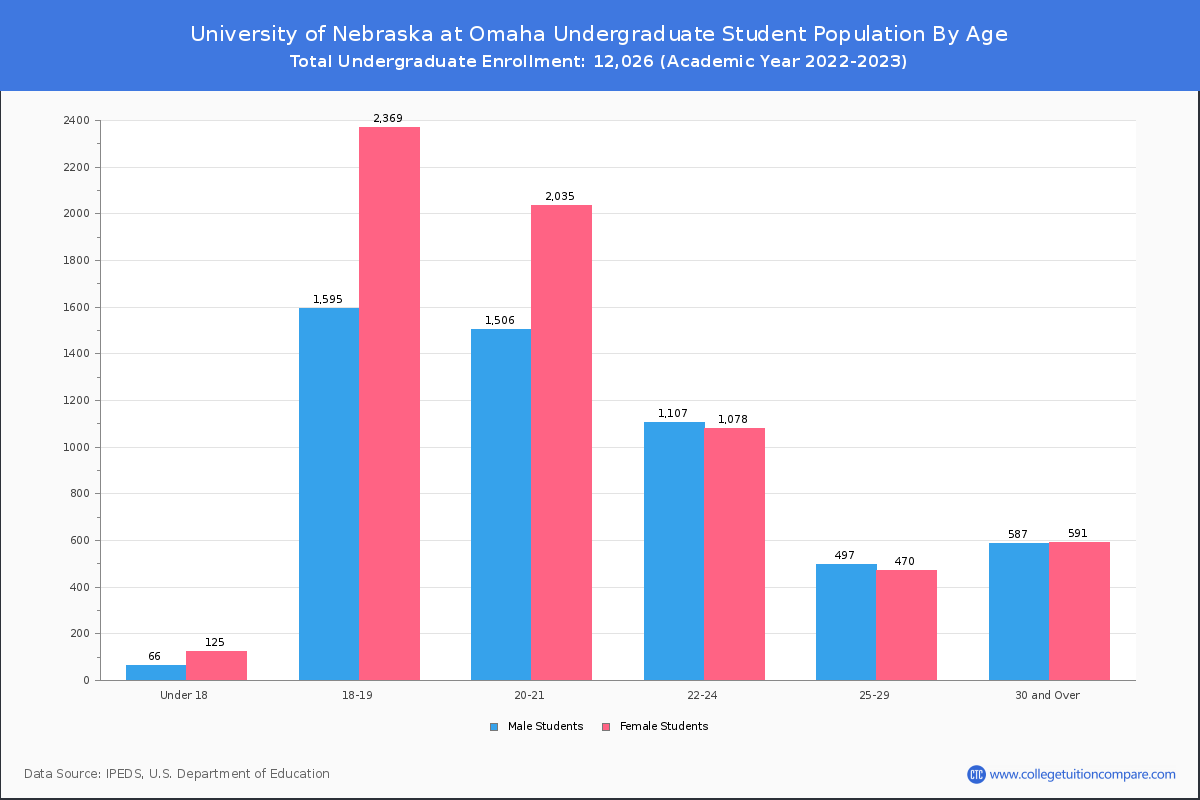
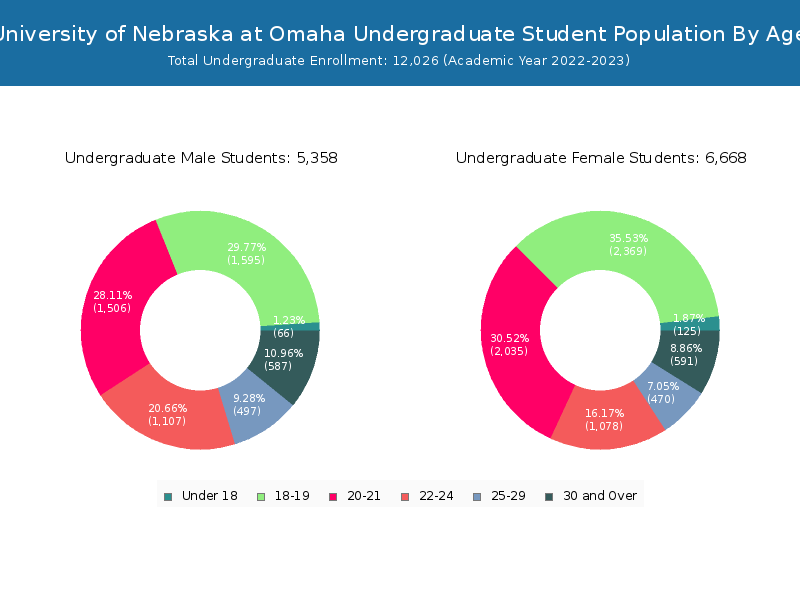
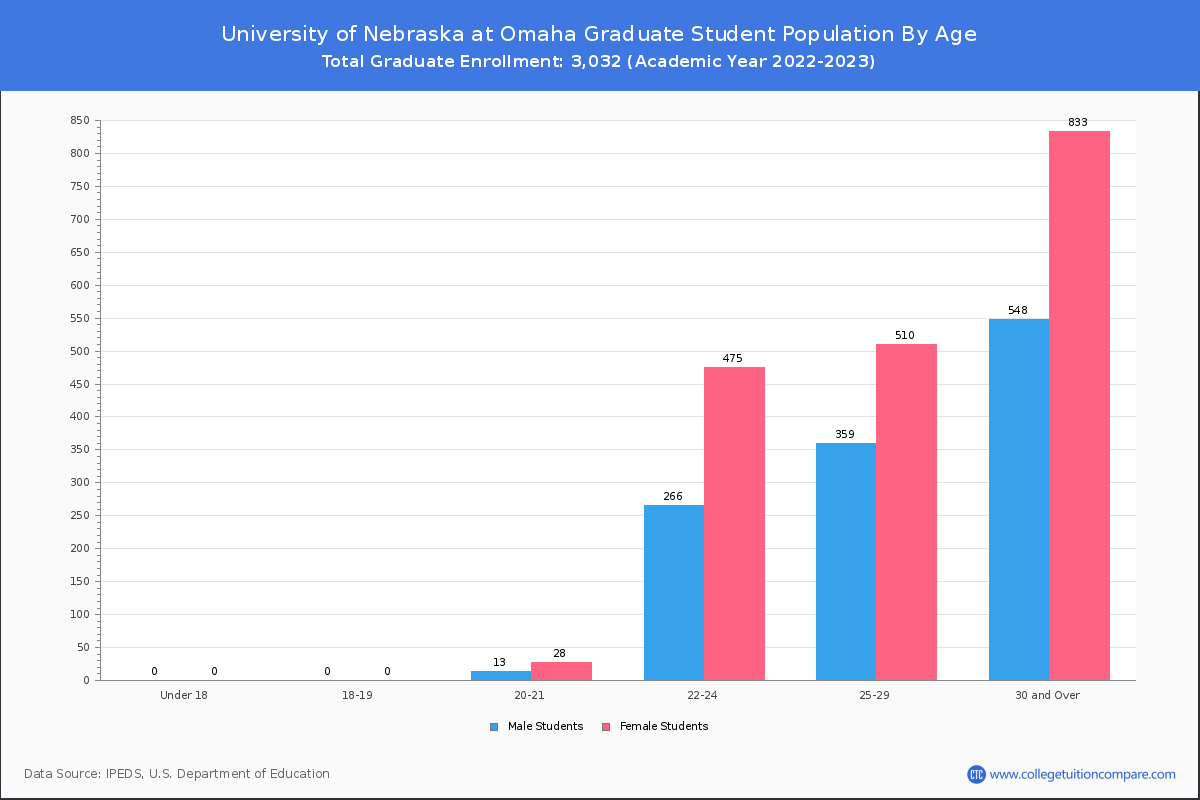
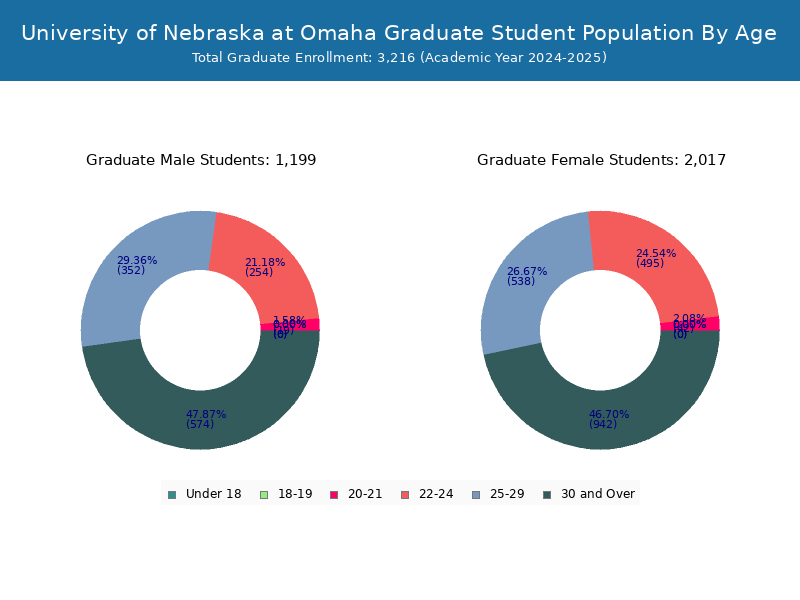
Student Age Distribution
By age, UNOMAHA has 191 students under 18 years old and 32 students over 65 years old. There are 10,663 students under 25 years old, and 4,395 students over 25 years old out of 15,058 total students.
In undergraduate programs, 191 students are younger than 18 and 15 students are older than 65. UNOMAHA has 9,881 undergraduate students aged under 25 and 2,145 students aged 25 and over.
It has 782 graduate students aged under 25 and 2,250 students aged 25 and over.
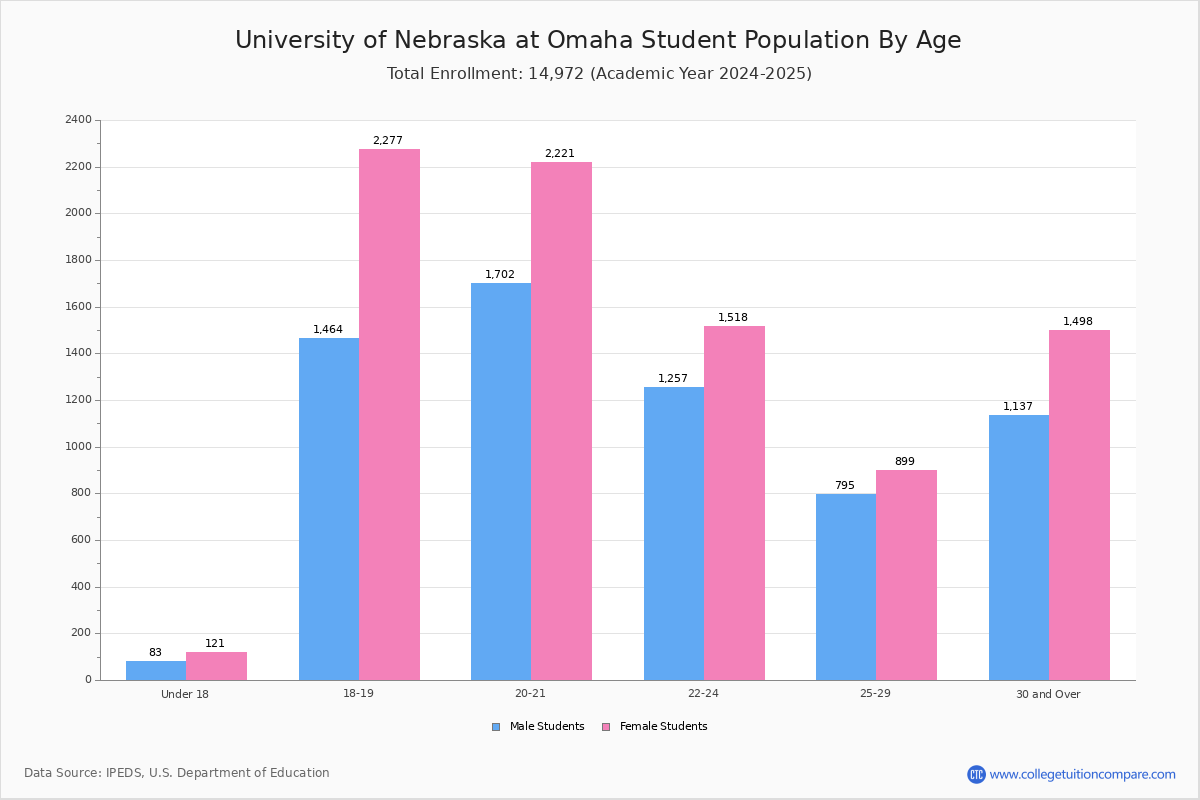
| Age | Total | Men | Women |
|---|---|---|---|
| Under 18 | 191 | 125 | 66 |
| 18-19 | 3,964 | 2,369 | 1,595 |
| 20-21 | 3,582 | 2,063 | 1,519 |
| 22-24 | 2,926 | 1,553 | 1,373 |
| 25-29 | 1,836 | 980 | 856 |
| 30-34 | 945 | 521 | 424 |
| 35-39 | 639 | 368 | 271 |
| 40-49 | 690 | 360 | 330 |
| 50-64 | 253 | 157 | 96 |
| Over 65 | 32 | 18 | 14 |
| Age | Total | Men | Women |
|---|---|---|---|
| Under 18 | 191 | 125 | 66 |
| 18-19 | 3,964 | 2,369 | 1,595 |
| 20-21 | 3,541 | 2,035 | 1,506 |
| 22-24 | 2,185 | 1,078 | 1,107 |
| 25-29 | 967 | 470 | 497 |
| 30-34 | 458 | 241 | 217 |
| 35-39 | 297 | 155 | 142 |
| 40-49 | 304 | 129 | 175 |
| 50-64 | 104 | 58 | 46 |
| Over 65 | 15 | 8 | 7 |
| Age | Total | Men | Women |
|---|
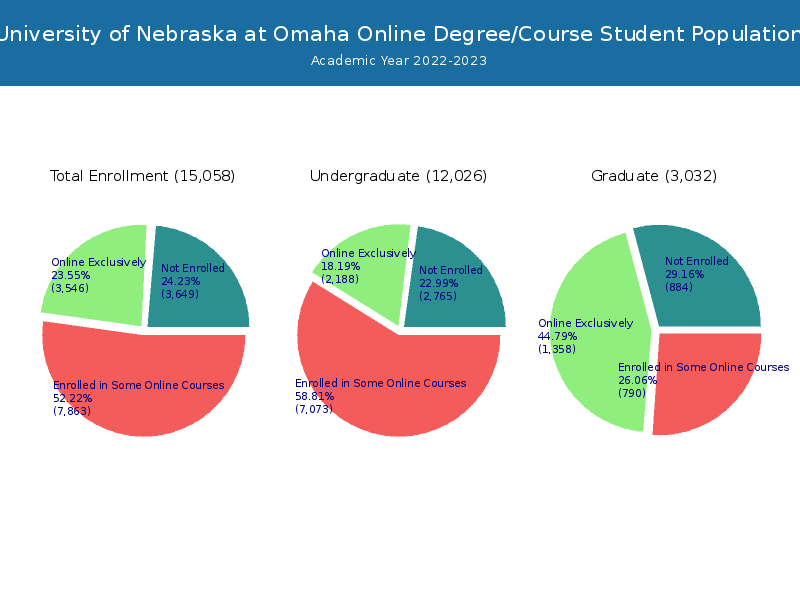
Online Student Enrollment
Distance learning, also called online education, is very attractive to students, especially who want to continue education and work in field. At University of Nebraska at Omaha, 3,546 students are enrolled exclusively in online courses and 7,863 students are enrolled in some online courses.
2,900 students lived in Nebraska or jurisdiction in which the school is located are enrolled exclusively in online courses and 646 students live in other State or outside of the United States.
| All Students | Enrolled Exclusively Online Courses | Enrolled in Some Online Courses | |
|---|---|---|---|
| All Students | 15,058 | 3,546 | 7,863 |
| Undergraduate | 12,026 | 2,188 | 7,073 |
| Graduate | 3,032 | 1,358 | 790 |
| Nebraska Residents | Other States in U.S. | Outside of U.S. | |
|---|---|---|---|
| All Students | 2,900 | 593 | 53 |
| Undergraduate | 1,775 | 385 | 28 |
| Graduate | 1,125 | 208 | 25 |
Transfer-in Students (Undergraduate)
Among 12,026 enrolled in undergraduate programs, 1,004 students have transferred-in from other institutions. The percentage of transfer-in students is 8.35%.765 students have transferred in as full-time status and 239 students transferred in as part-time status.
| Number of Students | |
|---|---|
| Regular Full-time | 9,220 |
| Transfer-in Full-time | 765 |
| Regular Part-time | 1,802 |
| Transfer-in Part-time | 239 |