Student Population by Gender
Montana State University Billings has a total of 4,057 enrolled students for the academic year 2022-2023. 3,665 students have enrolled in undergraduate programs and 392 students joined graduate programs.
By gender, 1,436 male and 2,621 female students (the male-female ratio is 35:65) are attending the school. The gender distribution is based on the 2022-2023 data.
| Total | Undergraduate | Graduate | |
|---|---|---|---|
| Total | 4,057 | 3,665 | 392 |
| Men | 1,436 | 1,344 | 92 |
| Women | 2,621 | 2,321 | 300 |
Student Distribution by Race/Ethnicity
| Race | Total | Men | Women |
|---|---|---|---|
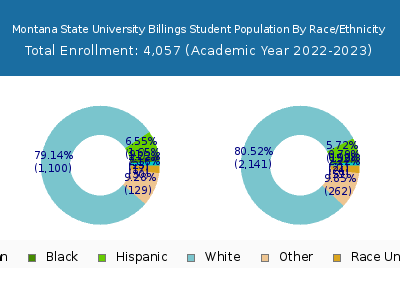
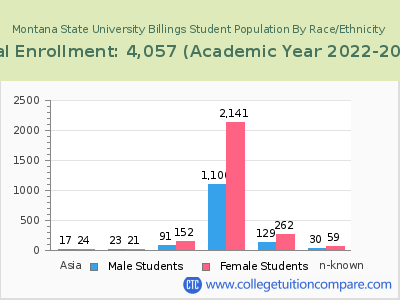
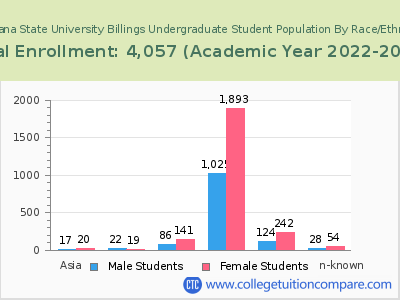
| American Indian or Native American | 168 | 48 | 120 |
| Asian | 44 | 22 | 22 |
| Black | 37 | 25 | 12 |
| Hispanic | 265 | 98 | 167 |
| Native Hawaiian or Other Pacific Islanders | 5 | 1 | 4 |
| White | 3,180 | 1,105 | 2,075 |
| Two or more races | 223 | 76 | 147 |
| Race Unknown | 66 | 24 | 42 |
| Race | Total | Men | Women |
|---|---|---|---|
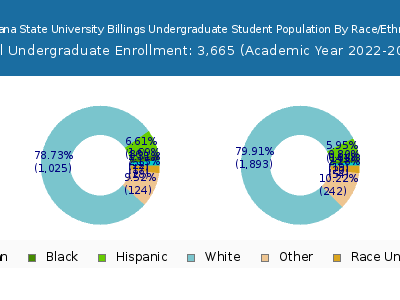
| American Indian or Native American | 155 | 45 | 110 |
| Asian | 40 | 22 | 18 |
| Black | 32 | 22 | 10 |
| Hispanic | 251 | 95 | 156 |
| Native Hawaiian or Other Pacific Islanders | 5 | 1 | 4 |
| White | 2,844 | 1,029 | 1,815 |
| Two or more races | 211 | 72 | 139 |
| Race Unknown | 64 | 24 | 40 |
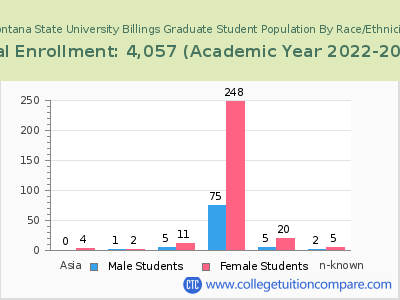
| Race | Total | Men | Women |
|---|---|---|---|
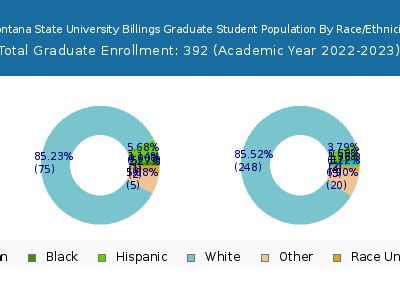
| American Indian or Native American | 22 | 6 | 16 |
| Asian | 2 | 1 | 1 |
| Black | 7 | 7 | 0 |
| Hispanic | 18 | 8 | 10 |
| Native Hawaiian or Other Pacific Islanders | 0 | 0 | 0 |
| White | 210 | 79 | 131 |
| Two or more races | 21 | 6 | 15 |
| Race Unknown | 0 | 0 | 0 |
Student Age Distribution
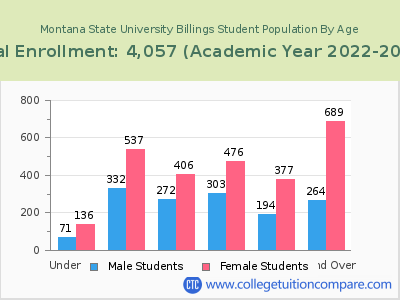
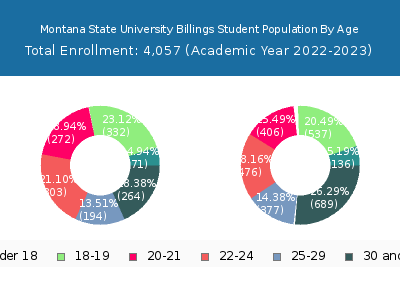
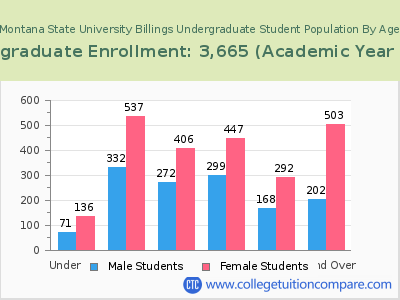
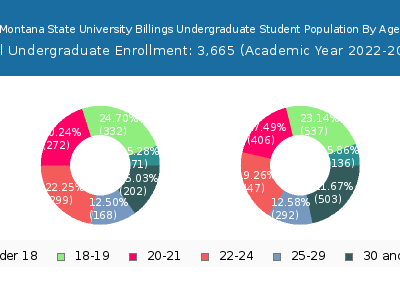
By age, MSU Billings has 207 students under 18 years old and 9 students over 65 years old. There are 2,533 students under 25 years old, and 1,524 students over 25 years old out of 4,057 total students.
In undergraduate programs, 207 students are younger than 18 and 8 students are older than 65. MSU Billings has 2,500 undergraduate students aged under 25 and 1,165 students aged 25 and over.
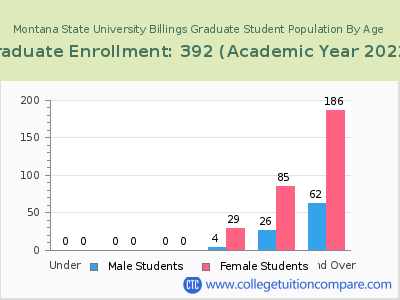
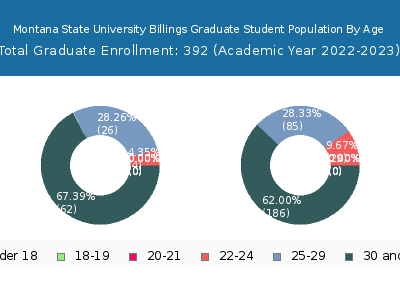
It has 33 graduate students aged under 25 and 359 students aged 25 and over.
| Age | Total | Men | Women |
|---|---|---|---|
| Under 18 | 207 | 136 | 71 |
| 18-19 | 869 | 537 | 332 |
| 20-21 | 678 | 406 | 272 |
| 22-24 | 779 | 476 | 303 |
| 25-29 | 571 | 377 | 194 |
| 30-34 | 367 | 256 | 111 |
| 35-39 | 211 | 156 | 55 |
| 40-49 | 260 | 187 | 73 |
| 50-64 | 106 | 82 | 24 |
| Over 65 | 9 | 8 | 1 |
| Age | Total | Men | Women |
|---|---|---|---|
| Under 18 | 207 | 136 | 71 |
| 18-19 | 869 | 537 | 332 |
| 20-21 | 678 | 406 | 272 |
| 22-24 | 746 | 447 | 299 |
| 25-29 | 460 | 292 | 168 |
| 30-34 | 280 | 195 | 85 |
| 35-39 | 156 | 114 | 42 |
| 40-49 | 190 | 131 | 59 |
| 50-64 | 71 | 56 | 15 |
| Over 65 | 8 | 7 | 1 |
| Age | Total | Men | Women |
|---|
Online Student Enrollment
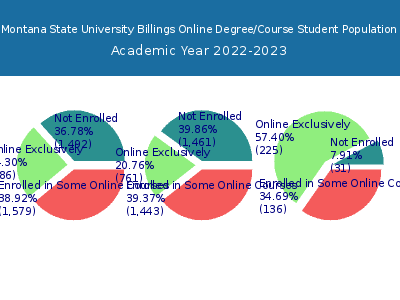
Distance learning, also called online education, is very attractive to students, especially who want to continue education and work in field. At Montana State University Billings, 986 students are enrolled exclusively in online courses and 1,579 students are enrolled in some online courses.
919 students lived in Montana or jurisdiction in which the school is located are enrolled exclusively in online courses and 67 students live in other State or outside of the United States.
| All Students | Enrolled Exclusively Online Courses | Enrolled in Some Online Courses | |
|---|---|---|---|
| All Students | 4,057 | 986 | 1,579 |
| Undergraduate | 3,665 | 761 | 1,443 |
| Graduate | 392 | 225 | 136 |
| Montana Residents | Other States in U.S. | Outside of U.S. | |
|---|---|---|---|
| All Students | 919 | 67 | 0 |
| Undergraduate | 725 | 36 | 0 |
| Graduate | 194 | 31 | 0 |
Transfer-in Students (Undergraduate)
Among 3,665 enrolled in undergraduate programs, 285 students have transferred-in from other institutions. The percentage of transfer-in students is 7.78%.202 students have transferred in as full-time status and 83 students transferred in as part-time status.
| Number of Students | |
|---|---|
| Regular Full-time | 1,694 |
| Transfer-in Full-time | 202 |
| Regular Part-time | 1,686 |
| Transfer-in Part-time | 83 |
