Student Population by Gender
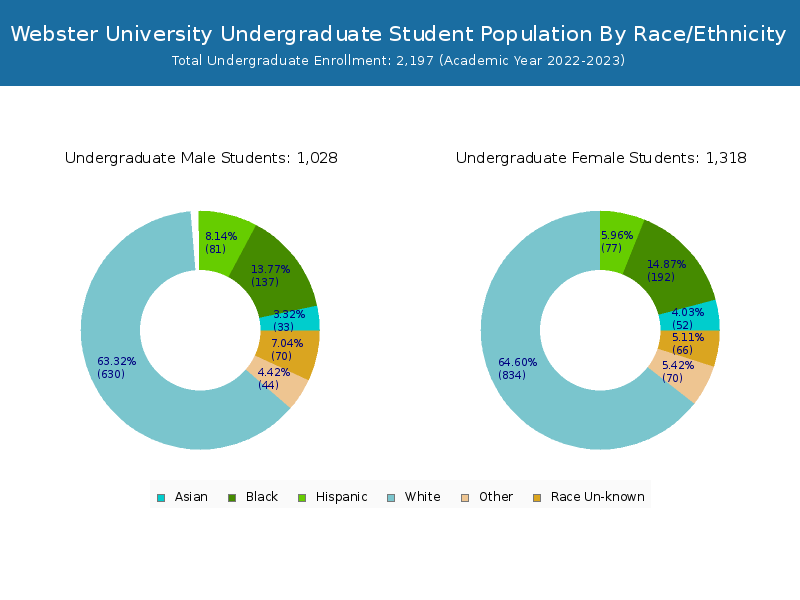
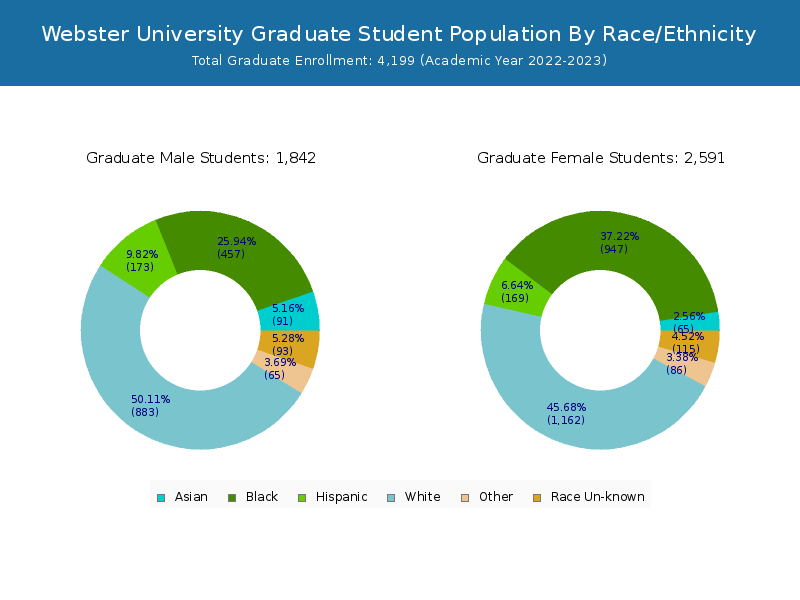
Webster University has a total of 6,396 enrolled students for the academic year 2022-2023. 2,197 students have enrolled in undergraduate programs and 4,199 students joined graduate programs.
By gender, 2,839 male and 3,557 female students (the male-female ratio is 44:56) are attending the school. The gender distribution is based on the 2022-2023 data.
| Total | Undergraduate | Graduate | |
|---|---|---|---|
| Total | 6,396 | 2,197 | 4,199 |
| Men | 2,839 | 929 | 1,910 |
| Women | 3,557 | 1,268 | 2,289 |
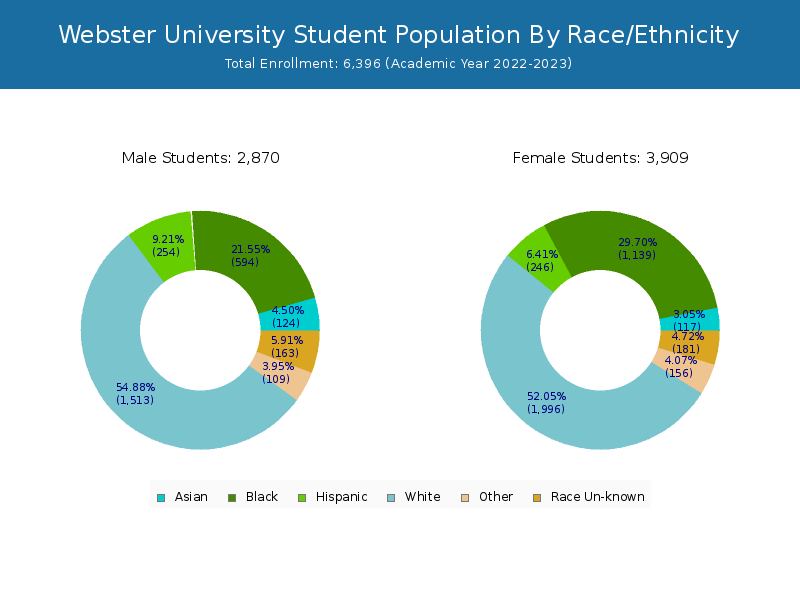
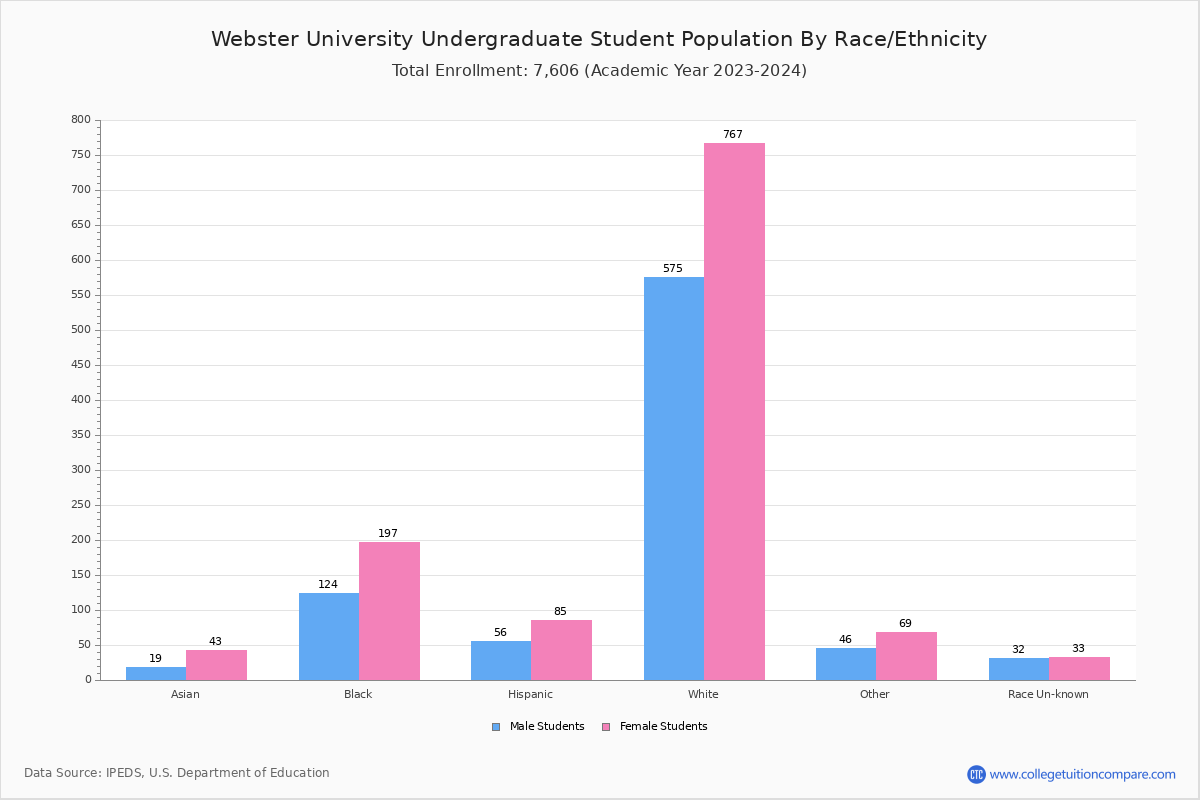
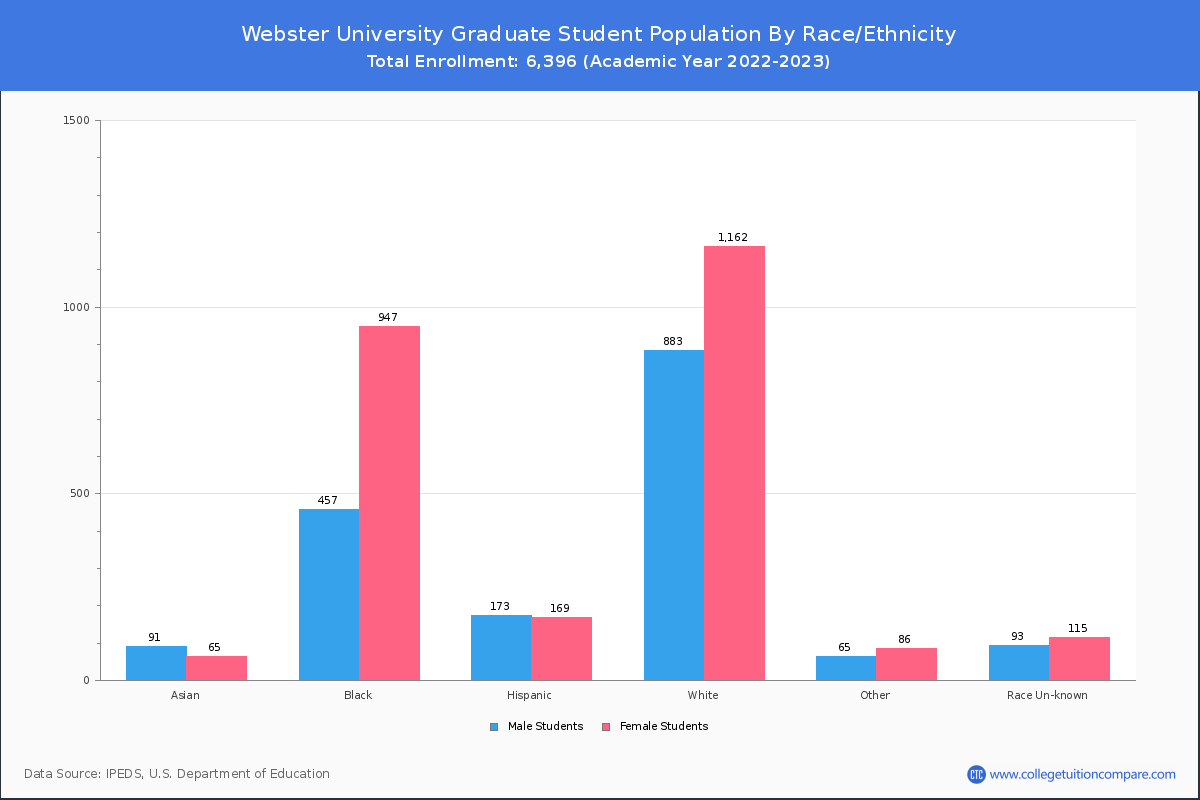
Student Distribution by Race/Ethnicity
By race/ethnicity, 3,024 White, 1,494 Black, and 189 Asian students out of a total of 6,396 are attending at Webster University. Comprehensive enrollment statistic data by race/ethnicity is shown in the next chart (Academic year 2022-2023 data).
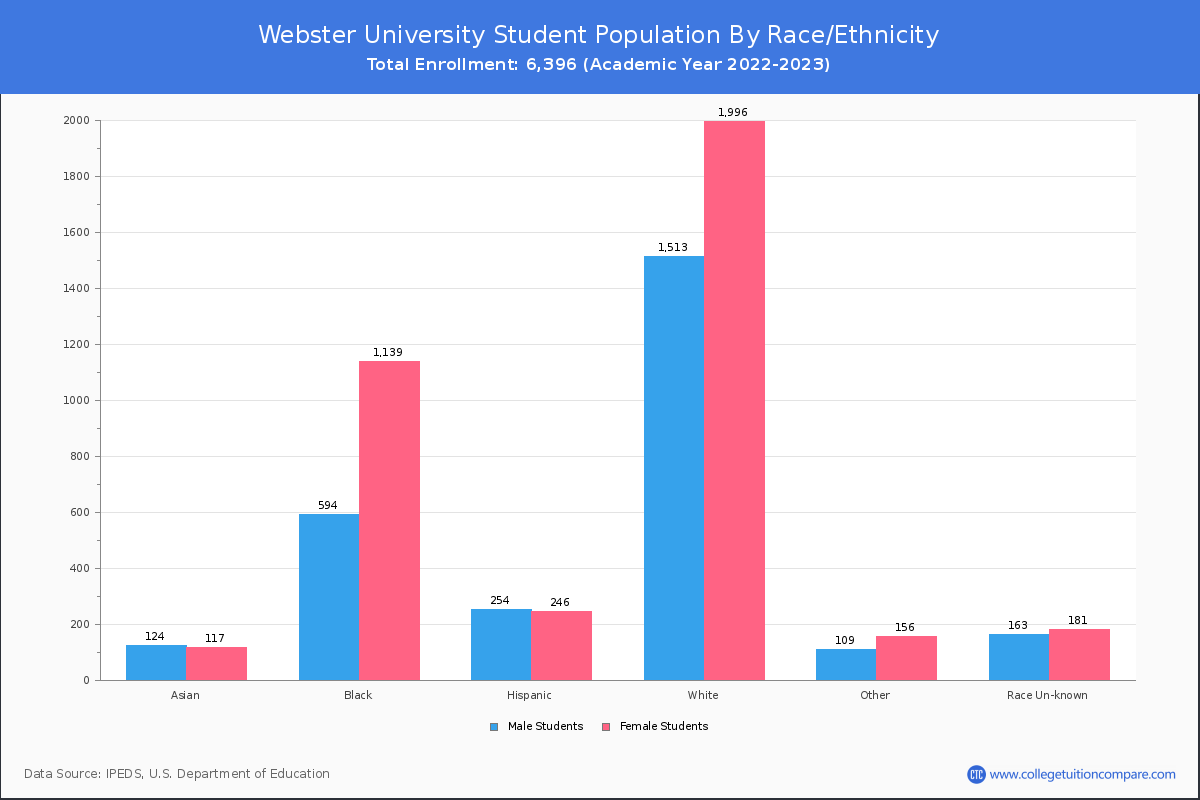
| Race | Total | Men | Women |
|---|---|---|---|
| American Indian or Native American | 13 | 8 | 5 |
| Asian | 189 | 86 | 103 |
| Black | 1,494 | 516 | 978 |
| Hispanic | 436 | 215 | 221 |
| Native Hawaiian or Other Pacific Islanders | 11 | 4 | 7 |
| White | 3,024 | 1,306 | 1,718 |
| Two or more races | 210 | 96 | 114 |
| Race Unknown | 297 | 147 | 150 |
| Race | Total | Men | Women |
|---|---|---|---|
| American Indian or Native American | 3 | 0 | 3 |
| Asian | 76 | 25 | 51 |
| Black | 319 | 124 | 195 |
| Hispanic | 135 | 65 | 70 |
| Native Hawaiian or Other Pacific Islanders | 2 | 1 | 1 |
| White | 1,375 | 580 | 795 |
| Two or more races | 103 | 47 | 56 |
| Race Unknown | 91 | 46 | 45 |
| Race | Total | Men | Women |
|---|---|---|---|
| American Indian or Native American | 0 | 0 | 0 |
| Asian | 9 | 2 | 7 |
| Black | 49 | 19 | 30 |
| Hispanic | 21 | 5 | 16 |
| Native Hawaiian or Other Pacific Islanders | 0 | 0 | 0 |
| White | 141 | 67 | 74 |
| Two or more races | 11 | 4 | 7 |
| Race Unknown | 4 | 1 | 3 |
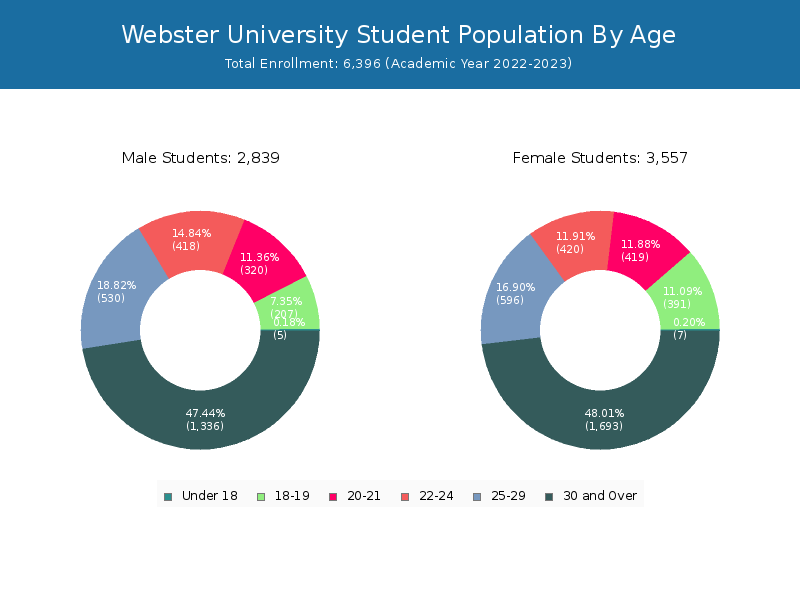
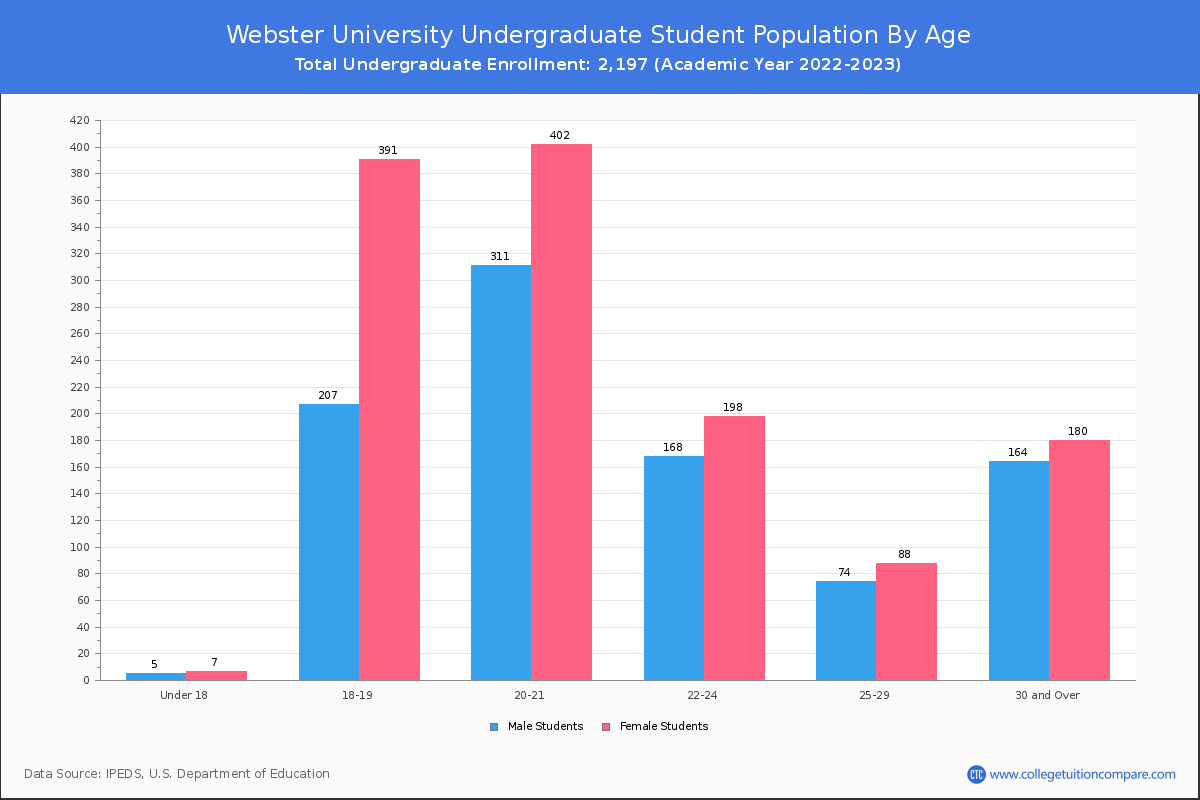
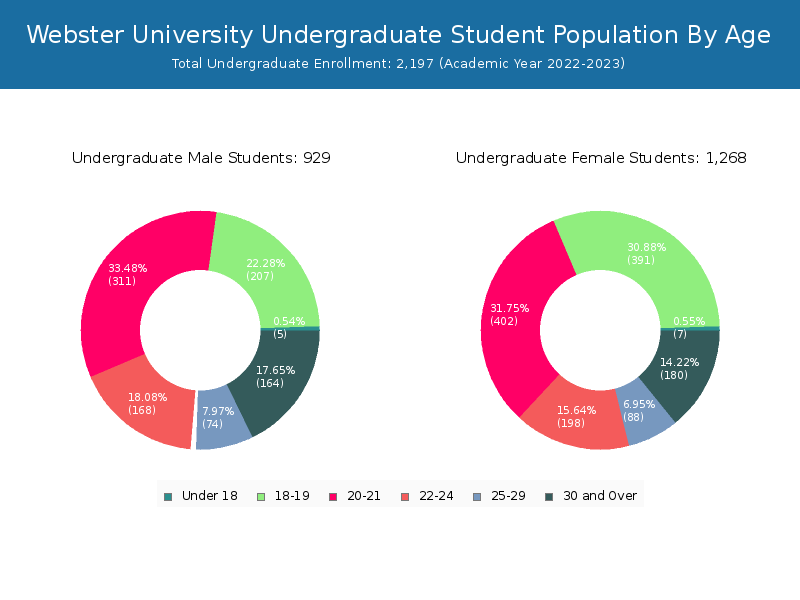
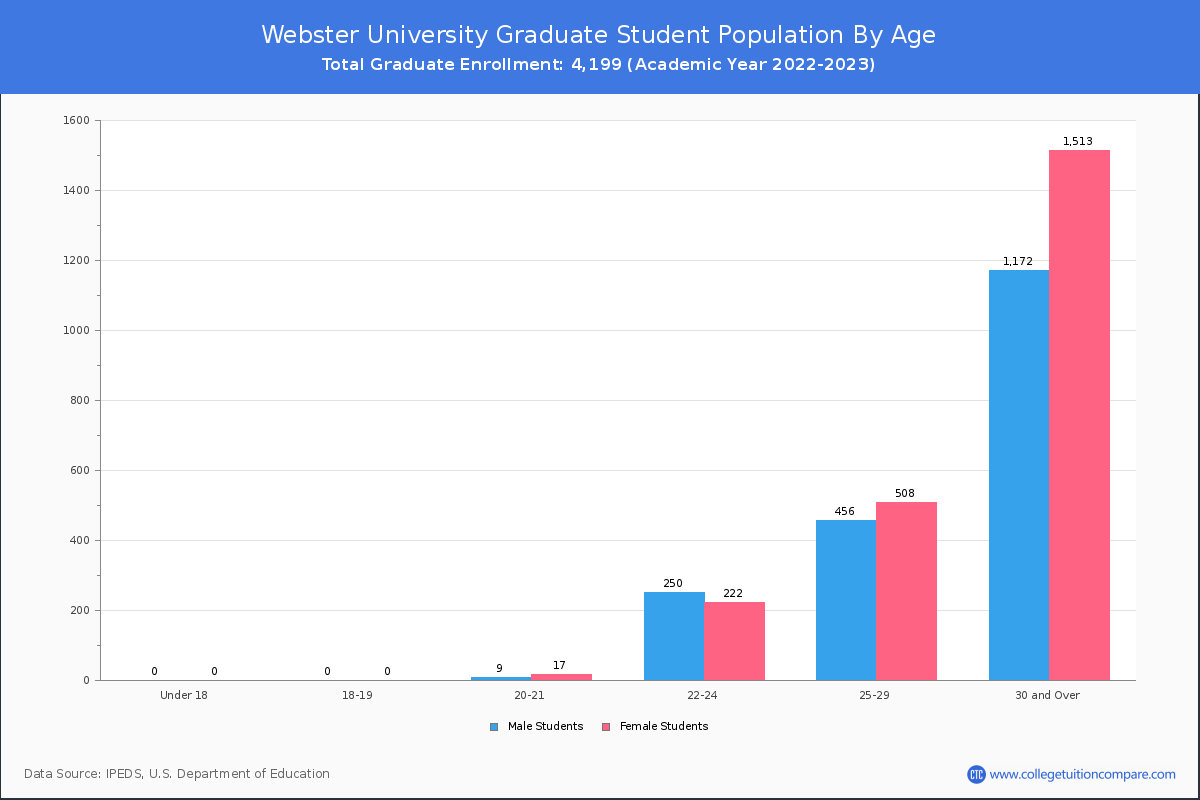
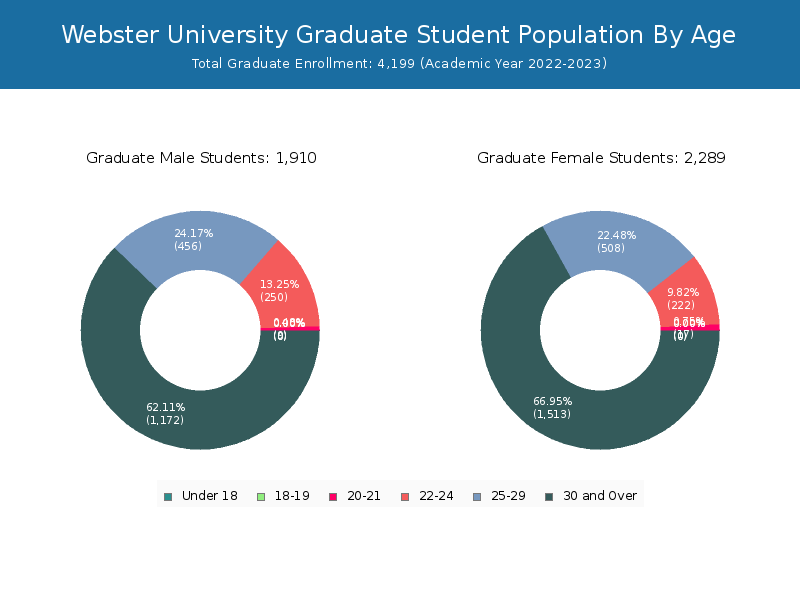
Student Age Distribution
By age, Webster has 12 students under 18 years old and 34 students over 65 years old. There are 2,187 students under 25 years old, and 4,155 students over 25 years old out of 6,396 total students.
In undergraduate programs, 12 students are younger than 18 and 4 students are older than 65. Webster has 1,689 undergraduate students aged under 25 and 506 students aged 25 and over.
It has 498 graduate students aged under 25 and 3,649 students aged 25 and over.
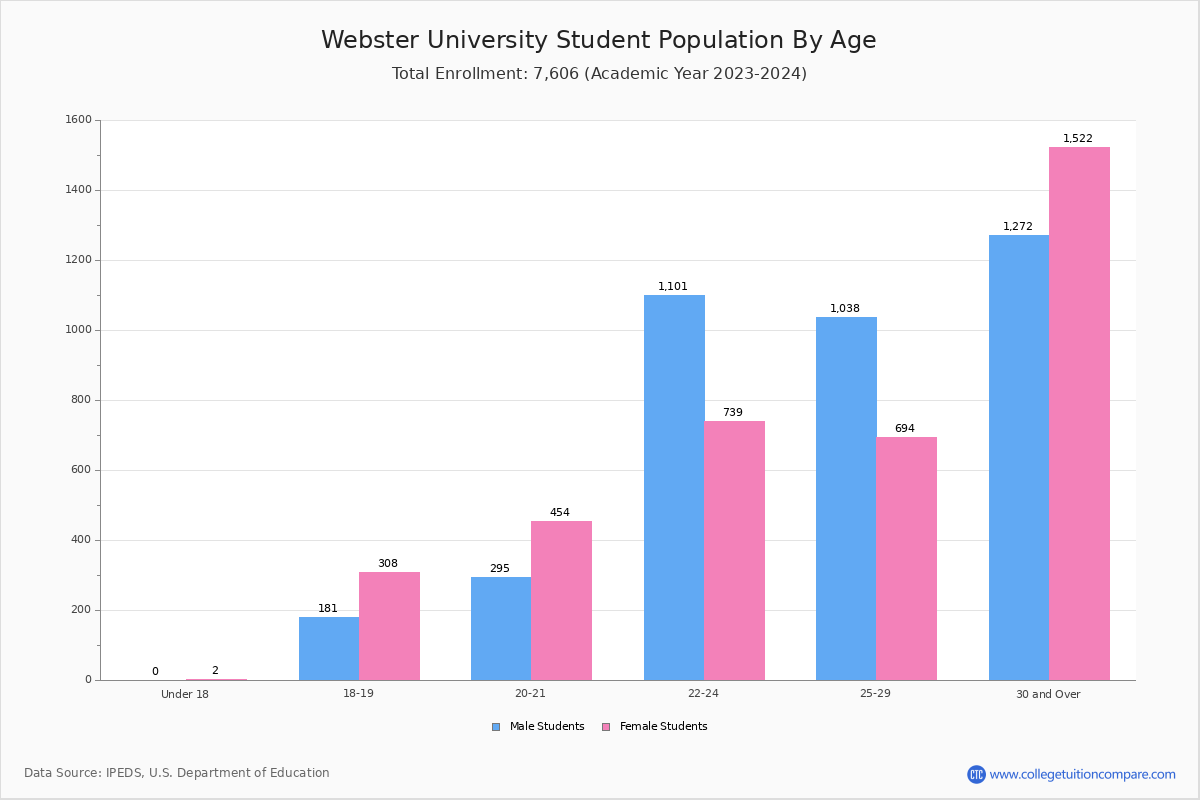
| Age | Total | Men | Women |
|---|---|---|---|
| Under 18 | 12 | 7 | 5 |
| 18-19 | 598 | 391 | 207 |
| 20-21 | 739 | 419 | 320 |
| 22-24 | 838 | 420 | 418 |
| 25-29 | 1,126 | 596 | 530 |
| 30-34 | 855 | 466 | 389 |
| 35-39 | 678 | 368 | 310 |
| 40-49 | 977 | 556 | 421 |
| 50-64 | 485 | 282 | 203 |
| Over 65 | 34 | 21 | 13 |
| Age | Total | Men | Women |
|---|---|---|---|
| Under 18 | 12 | 7 | 5 |
| 18-19 | 598 | 391 | 207 |
| 20-21 | 713 | 402 | 311 |
| 22-24 | 366 | 198 | 168 |
| 25-29 | 162 | 88 | 74 |
| 30-34 | 117 | 55 | 62 |
| 35-39 | 80 | 39 | 41 |
| 40-49 | 97 | 56 | 41 |
| 50-64 | 46 | 29 | 17 |
| Over 65 | 4 | 1 | 3 |
| Age | Total | Men | Women |
|---|
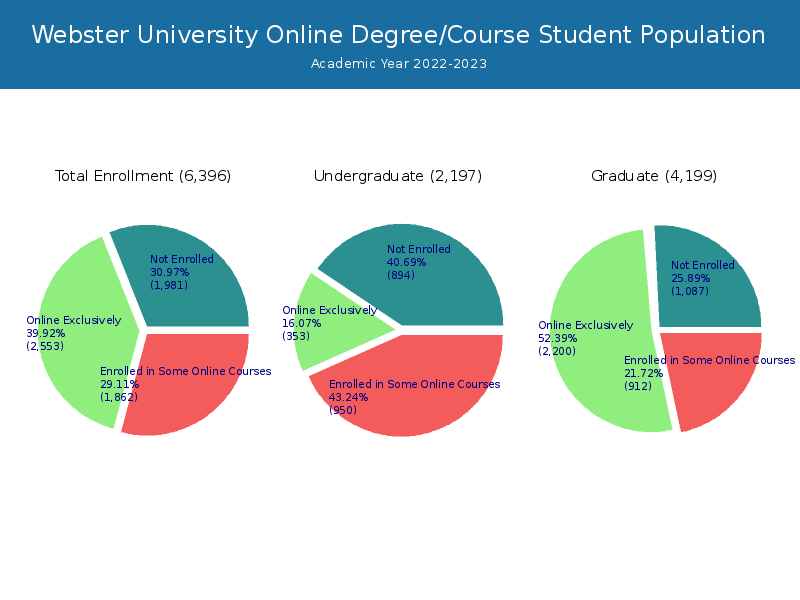
Online Student Enrollment
Distance learning, also called online education, is very attractive to students, especially who want to continue education and work in field. At Webster University, 2,553 students are enrolled exclusively in online courses and 1,862 students are enrolled in some online courses.
843 students lived in Missouri or jurisdiction in which the school is located are enrolled exclusively in online courses and 1,710 students live in other State or outside of the United States.
| All Students | Enrolled Exclusively Online Courses | Enrolled in Some Online Courses | |
|---|---|---|---|
| All Students | 6,396 | 2,553 | 1,862 |
| Undergraduate | 2,197 | 353 | 950 |
| Graduate | 4,199 | 2,200 | 912 |
| Missouri Residents | Other States in U.S. | Outside of U.S. | |
|---|---|---|---|
| All Students | 843 | 1,632 | 78 |
| Undergraduate | 179 | 159 | 15 |
| Graduate | 664 | 1,473 | 63 |
Transfer-in Students (Undergraduate)
Among 2,197 enrolled in undergraduate programs, 247 students have transferred-in from other institutions. The percentage of transfer-in students is 11.24%.184 students have transferred in as full-time status and 63 students transferred in as part-time status.
| Number of Students | |
|---|---|
| Regular Full-time | 1,604 |
| Transfer-in Full-time | 184 |
| Regular Part-time | 346 |
| Transfer-in Part-time | 63 |