Student Population by Gender
Kansas City University has a total of 1,306 enrolled students for the academic year 2022-2023. All 1,306 students are enrolled into graduate programs.
By gender, 624 male and 682 female students (the male-female ratio is 48:52) are attending the school. The gender distribution is based on the 2022-2023 data.
| Graduate | |
|---|---|
| Total | 1,306 |
| Men | 624 |
| Women | 682 |
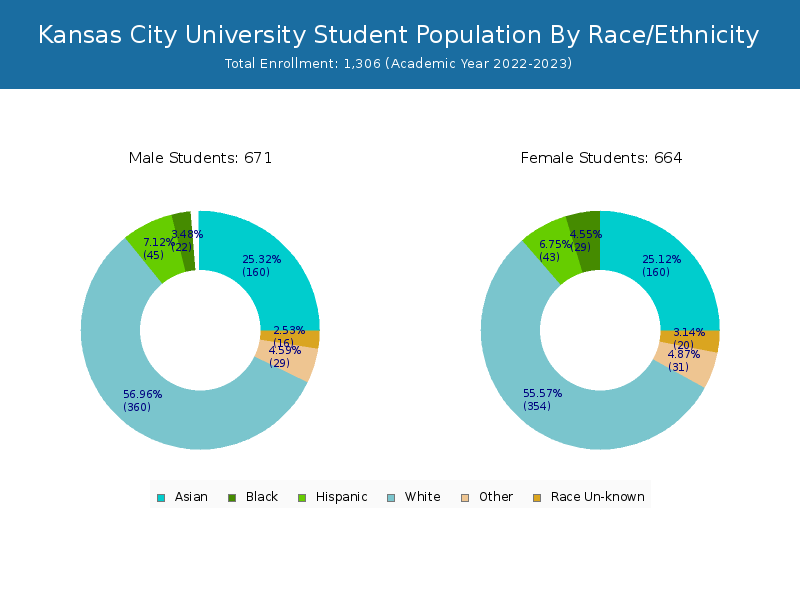
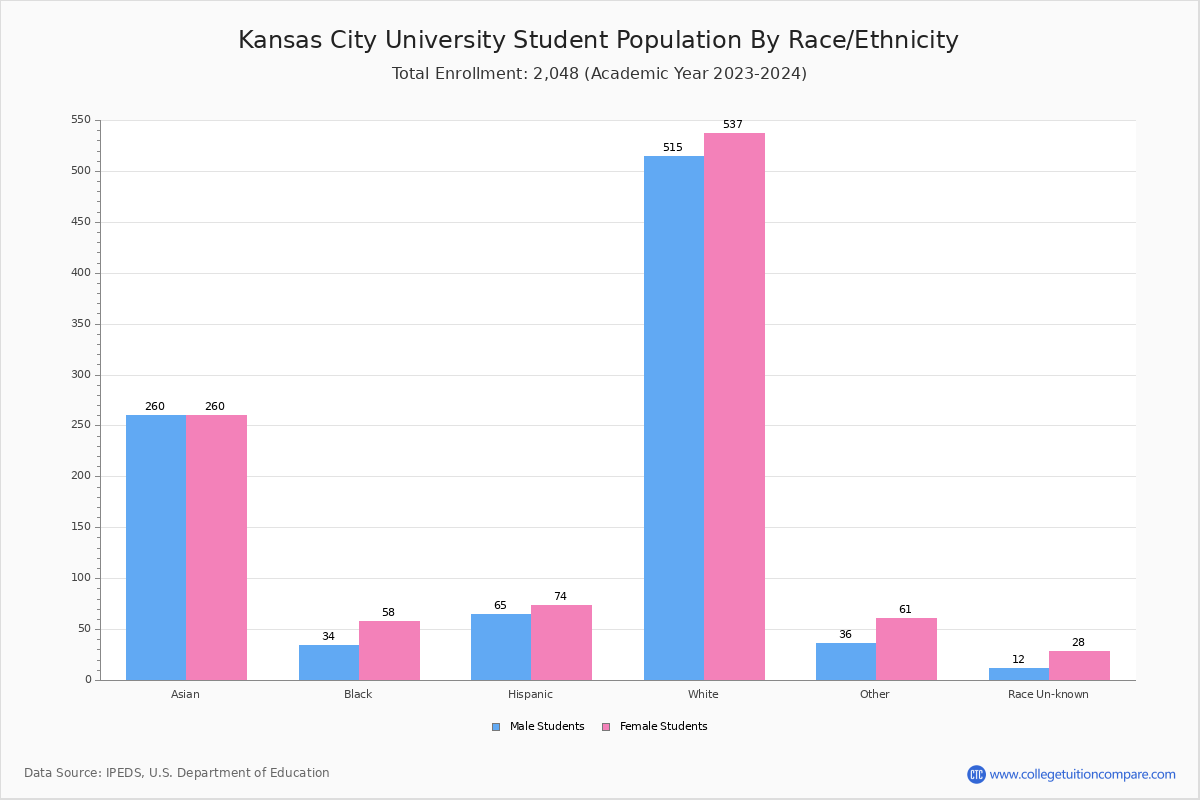
Student Distribution by Race/Ethnicity
By race/ethnicity, 660 White, 59 Black, and 329 Asian students out of a total of 1,306 are attending at Kansas City University. Comprehensive enrollment statistic data by race/ethnicity is shown in the next chart (Academic year 2022-2023 data).
| Race | Total | Men | Women |
|---|---|---|---|
| American Indian or Native American | 0 | 0 | 0 |
| Asian | 329 | 168 | 161 |
| Black | 59 | 25 | 34 |
| Hispanic | 95 | 47 | 48 |
| Native Hawaiian or Other Pacific Islanders | 3 | 1 | 2 |
| White | 660 | 310 | 350 |
| Two or more races | 54 | 18 | 36 |
| Race Unknown | 36 | 13 | 23 |
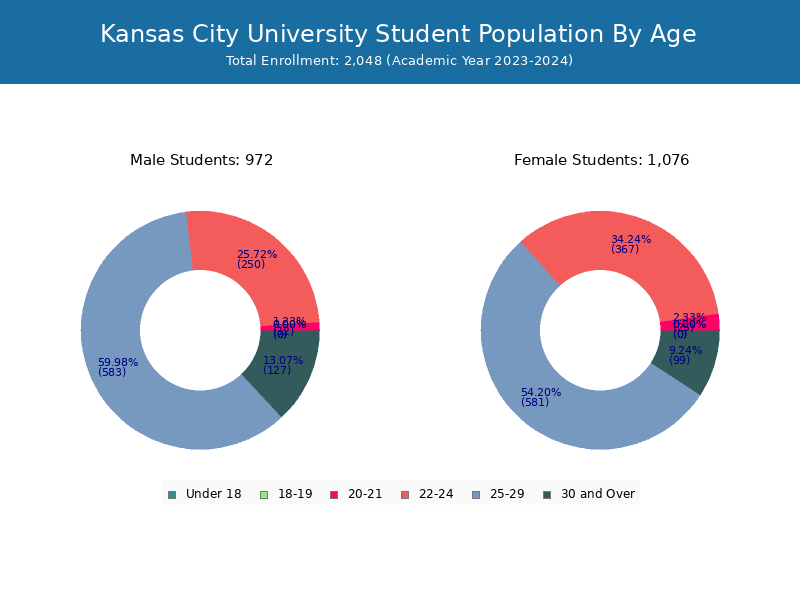
Student Age Distribution
There are 329 students under 25 years old, and 977 students over 25 years old out of 1,306 total students.

| Age | Total | Men | Women |
|---|