Student Population by Gender
Ozark Christian College has a total of 689 enrolled students for the academic year 2022-2023. 608 students have enrolled in undergraduate programs and 81 students joined graduate programs.
By gender, 384 male and 305 female students (the male-female ratio is 56:44) are attending the school. The gender distribution is based on the 2022-2023 data.
| Total | Undergraduate | Graduate | |
|---|---|---|---|
| Total | 689 | 608 | 81 |
| Men | 384 | 328 | 56 |
| Women | 305 | 280 | 25 |
Student Distribution by Race/Ethnicity
| Race | Total | Men | Women |
|---|---|---|---|
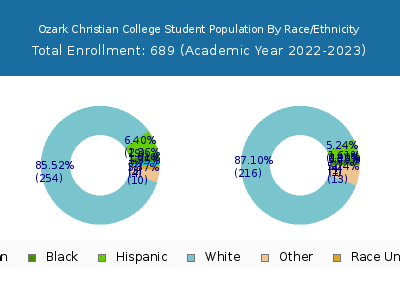
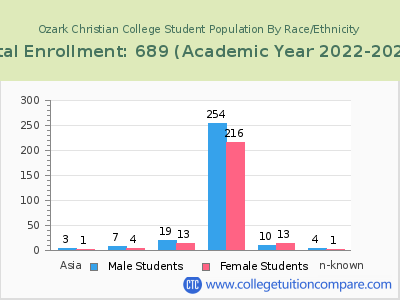
| American Indian or Native American | 12 | 7 | 5 |
| Asian | 9 | 5 | 4 |
| Black | 14 | 11 | 3 |
| Hispanic | 41 | 22 | 19 |
| Native Hawaiian or Other Pacific Islanders | 0 | 0 | 0 |
| White | 576 | 317 | 259 |
| Two or more races | 20 | 9 | 11 |
| Race Unknown | 5 | 4 | 1 |
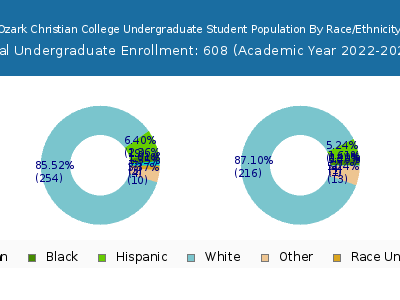
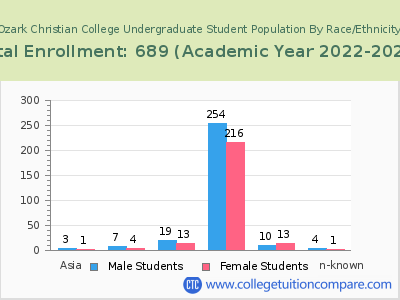
| Race | Total | Men | Women |
|---|---|---|---|
| American Indian or Native American | 10 | 5 | 5 |
| Asian | 9 | 5 | 4 |
| Black | 12 | 9 | 3 |
| Hispanic | 40 | 22 | 18 |
| Native Hawaiian or Other Pacific Islanders | 0 | 0 | 0 |
| White | 502 | 267 | 235 |
| Two or more races | 18 | 7 | 11 |
| Race Unknown | 5 | 4 | 1 |
| Race | Total | Men | Women |
|---|---|---|---|
| American Indian or Native American | 0 | 0 | 0 |
| Asian | 0 | 0 | 0 |
| Black | 2 | 2 | 0 |
| Hispanic | 3 | 2 | 1 |
| Native Hawaiian or Other Pacific Islanders | 0 | 0 | 0 |
| White | 37 | 24 | 13 |
| Two or more races | 0 | 0 | 0 |
| Race Unknown | 1 | 1 | 0 |
Student Age Distribution
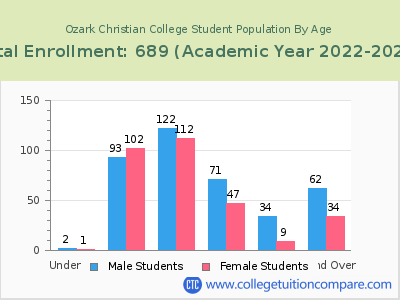
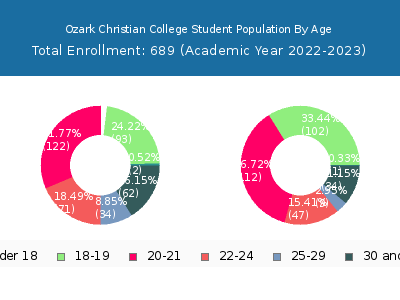
By age, Ozark Christian has 3 students under 18 years old and 4 students over 65 years old. There are 550 students under 25 years old, and 139 students over 25 years old out of 689 total students.
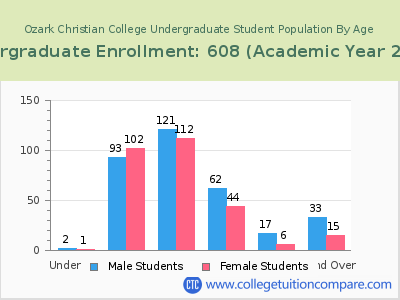
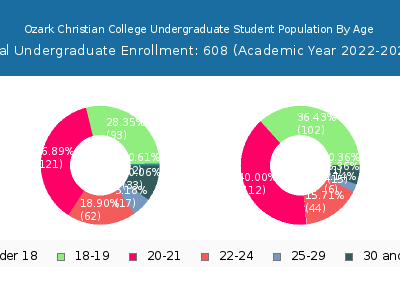
In undergraduate programs, 3 students are younger than 18 and 2 students are older than 65. Ozark Christian has 537 undergraduate students aged under 25 and 71 students aged 25 and over.
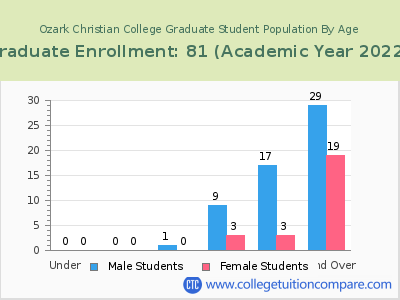
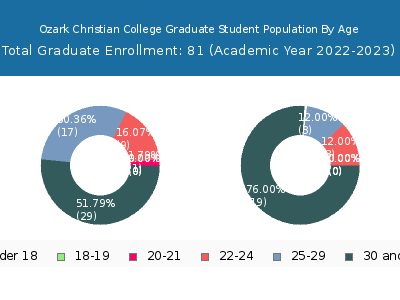
It has 13 graduate students aged under 25 and 68 students aged 25 and over.
| Age | Total | Men | Women |
|---|---|---|---|
| Under 18 | 3 | 1 | 2 |
| 18-19 | 195 | 102 | 93 |
| 20-21 | 234 | 112 | 122 |
| 22-24 | 118 | 47 | 71 |
| 25-29 | 43 | 9 | 34 |
| 30-34 | 22 | 8 | 14 |
| 35-39 | 19 | 7 | 12 |
| 40-49 | 28 | 9 | 19 |
| 50-64 | 23 | 9 | 14 |
| Over 65 | 4 | 1 | 3 |
| Age | Total | Men | Women |
|---|---|---|---|
| Under 18 | 3 | 1 | 2 |
| 18-19 | 195 | 102 | 93 |
| 20-21 | 233 | 112 | 121 |
| 22-24 | 106 | 44 | 62 |
| 25-29 | 23 | 6 | 17 |
| 30-34 | 11 | 3 | 8 |
| 35-39 | 9 | 4 | 5 |
| 40-49 | 15 | 4 | 11 |
| 50-64 | 11 | 4 | 7 |
| Over 65 | 2 | 0 | 2 |
| Age | Total | Men | Women |
|---|
Online Student Enrollment
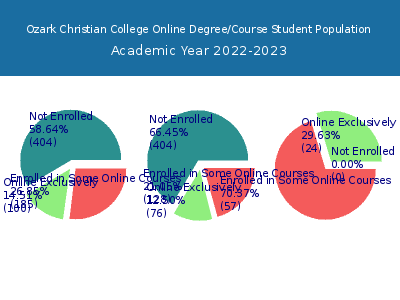
Distance learning, also called online education, is very attractive to students, especially who want to continue education and work in field. At Ozark Christian College, 100 students are enrolled exclusively in online courses and 185 students are enrolled in some online courses.
22 students lived in Missouri or jurisdiction in which the school is located are enrolled exclusively in online courses and 78 students live in other State or outside of the United States.
| All Students | Enrolled Exclusively Online Courses | Enrolled in Some Online Courses | |
|---|---|---|---|
| All Students | 689 | 100 | 185 |
| Undergraduate | 608 | 76 | 128 |
| Graduate | 81 | 24 | 57 |
| Missouri Residents | Other States in U.S. | Outside of U.S. | |
|---|---|---|---|
| All Students | 22 | 78 | 0 |
| Undergraduate | 16 | 60 | 0 |
| Graduate | 6 | 18 | 0 |
Transfer-in Students (Undergraduate)
Among 608 enrolled in undergraduate programs, 45 students have transferred-in from other institutions. The percentage of transfer-in students is 7.40%.39 students have transferred in as full-time status and 6 students transferred in as part-time status.
| Number of Students | |
|---|---|
| Regular Full-time | 452 |
| Transfer-in Full-time | 39 |
| Regular Part-time | 111 |
| Transfer-in Part-time | 6 |
