Student Population by Gender
Fontbonne University has a total of 944 enrolled students for the academic year 2022-2023. 684 students have enrolled in undergraduate programs and 260 students joined graduate programs.
By gender, 383 male and 561 female students (the male-female ratio is 41:59) are attending the school. The gender distribution is based on the 2022-2023 data.
| Total | Undergraduate | Graduate | |
|---|---|---|---|
| Total | 944 | 684 | 260 |
| Men | 383 | 326 | 57 |
| Women | 561 | 358 | 203 |
Student Distribution by Race/Ethnicity
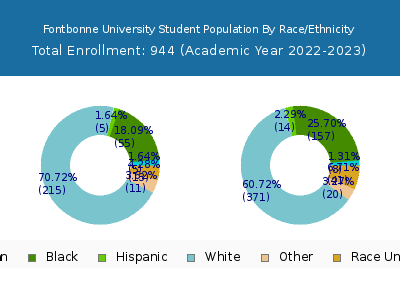
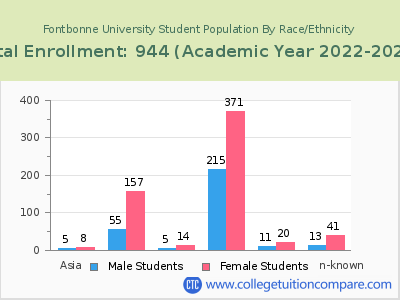
| Race | Total | Men | Women |
|---|---|---|---|
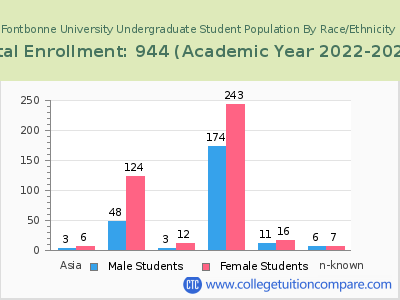
| American Indian or Native American | 2 | 1 | 1 |
| Asian | 15 | 7 | 8 |
| Black | 202 | 82 | 120 |
| Hispanic | 13 | 5 | 8 |
| Native Hawaiian or Other Pacific Islanders | 1 | 1 | 0 |
| White | 561 | 241 | 320 |
| Two or more races | 40 | 21 | 19 |
| Race Unknown | 81 | 10 | 71 |
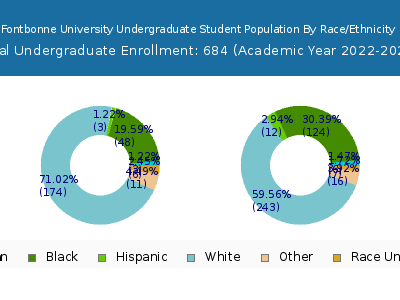
| Race | Total | Men | Women |
|---|---|---|---|
| American Indian or Native American | 2 | 1 | 1 |
| Asian | 11 | 5 | 6 |
| Black | 168 | 77 | 91 |
| Hispanic | 11 | 4 | 7 |
| Native Hawaiian or Other Pacific Islanders | 1 | 1 | 0 |
| White | 427 | 207 | 220 |
| Two or more races | 35 | 20 | 15 |
| Race Unknown | 16 | 4 | 12 |
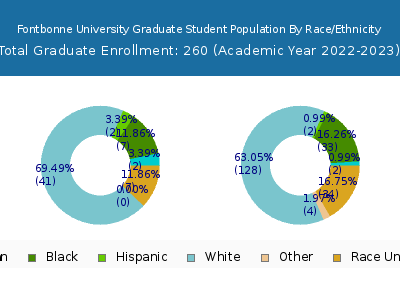
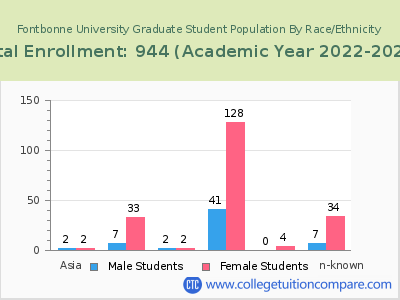
| Race | Total | Men | Women |
|---|---|---|---|
| American Indian or Native American | 0 | 0 | 0 |
| Asian | 0 | 0 | 0 |
| Black | 6 | 5 | 1 |
| Hispanic | 0 | 0 | 0 |
| Native Hawaiian or Other Pacific Islanders | 1 | 1 | 0 |
| White | 40 | 23 | 17 |
| Two or more races | 2 | 2 | 0 |
| Race Unknown | 2 | 2 | 0 |
Student Age Distribution
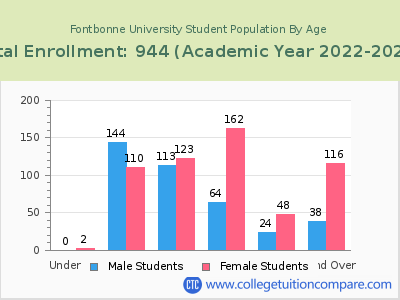
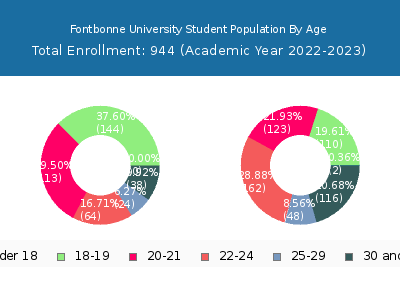
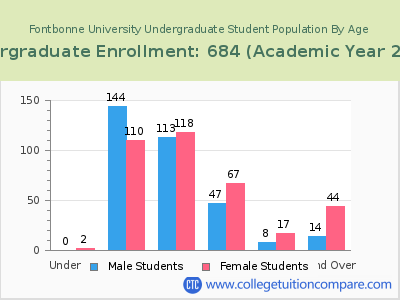
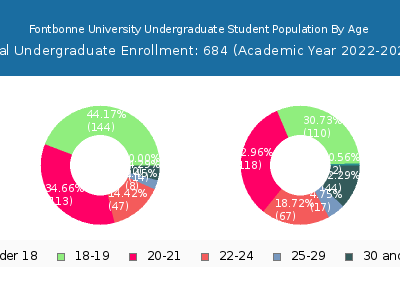
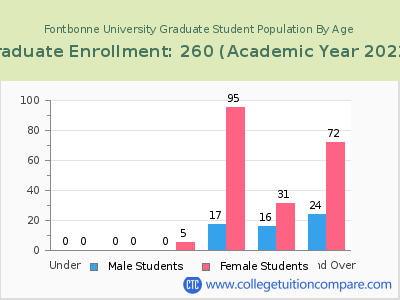
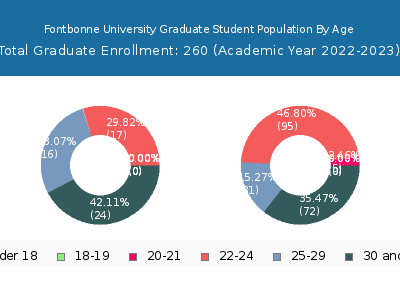
By age, Fontbonne has 2 students under 18 years old and 2 students over 65 years old. There are 718 students under 25 years old, and 226 students over 25 years old out of 944 total students.
In undergraduate programs, 2 students are younger than 18 and 1 students are older than 65. Fontbonne has 601 undergraduate students aged under 25 and 83 students aged 25 and over.
It has 117 graduate students aged under 25 and 143 students aged 25 and over.
| Age | Total | Men | Women |
|---|---|---|---|
| Under 18 | 2 | 2 | 0 |
| 18-19 | 254 | 110 | 144 |
| 20-21 | 236 | 123 | 113 |
| 22-24 | 226 | 162 | 64 |
| 25-29 | 72 | 48 | 24 |
| 30-34 | 46 | 32 | 14 |
| 35-39 | 32 | 23 | 9 |
| 40-49 | 52 | 40 | 12 |
| 50-64 | 22 | 20 | 2 |
| Over 65 | 2 | 1 | 1 |
| Age | Total | Men | Women |
|---|---|---|---|
| Under 18 | 2 | 2 | 0 |
| 18-19 | 254 | 110 | 144 |
| 20-21 | 231 | 118 | 113 |
| 22-24 | 114 | 67 | 47 |
| 25-29 | 25 | 17 | 8 |
| 30-34 | 20 | 15 | 5 |
| 35-39 | 12 | 8 | 4 |
| 40-49 | 16 | 13 | 3 |
| 50-64 | 9 | 7 | 2 |
| Over 65 | 1 | 1 | 0 |
| Age | Total | Men | Women |
|---|
Online Student Enrollment
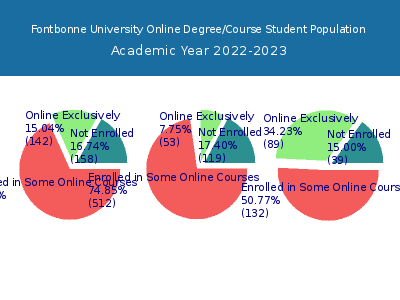
Distance learning, also called online education, is very attractive to students, especially who want to continue education and work in field. At Fontbonne University, 142 students are enrolled exclusively in online courses and 644 students are enrolled in some online courses.
114 students lived in Missouri or jurisdiction in which the school is located are enrolled exclusively in online courses and 28 students live in other State or outside of the United States.
| All Students | Enrolled Exclusively Online Courses | Enrolled in Some Online Courses | |
|---|---|---|---|
| All Students | 944 | 142 | 644 |
| Undergraduate | 684 | 53 | 512 |
| Graduate | 260 | 89 | 132 |
| Missouri Residents | Other States in U.S. | Outside of U.S. | |
|---|---|---|---|
| All Students | 114 | 24 | 4 |
| Undergraduate | 42 | 8 | 3 |
| Graduate | 72 | 16 | 1 |
Transfer-in Students (Undergraduate)
Among 684 enrolled in undergraduate programs, 51 students have transferred-in from other institutions. The percentage of transfer-in students is 7.46%.44 students have transferred in as full-time status and 7 students transferred in as part-time status.
| Number of Students | |
|---|---|
| Regular Full-time | 571 |
| Transfer-in Full-time | 44 |
| Regular Part-time | 62 |
| Transfer-in Part-time | 7 |
