Student Population by Gender
Millsaps College has a total of 661 enrolled students for the academic year 2022-2023. 627 students have enrolled in undergraduate programs and 34 students joined graduate programs.
By gender, 364 male and 297 female students (the male-female ratio is 55:45) are attending the school. The gender distribution is based on the 2022-2023 data.
| Total | Undergraduate | Graduate | |
|---|---|---|---|
| Total | 661 | 627 | 34 |
| Men | 364 | 343 | 21 |
| Women | 297 | 284 | 13 |
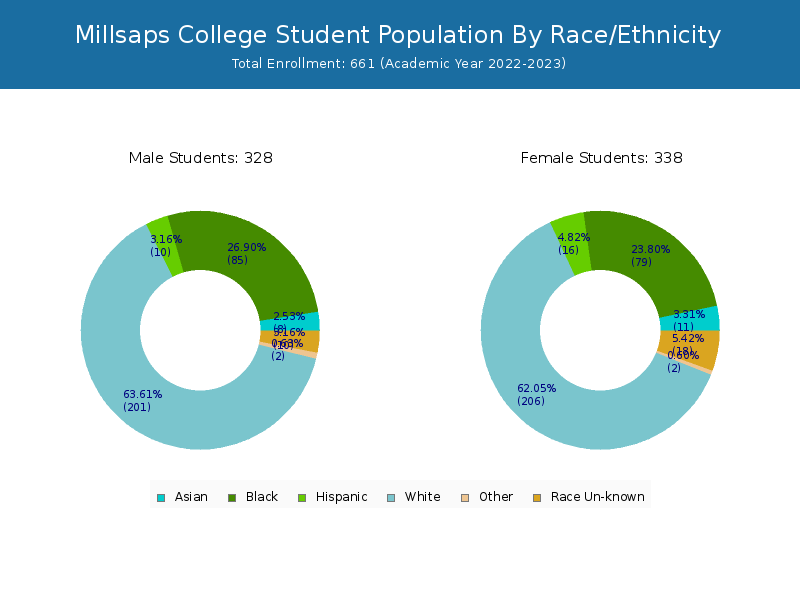
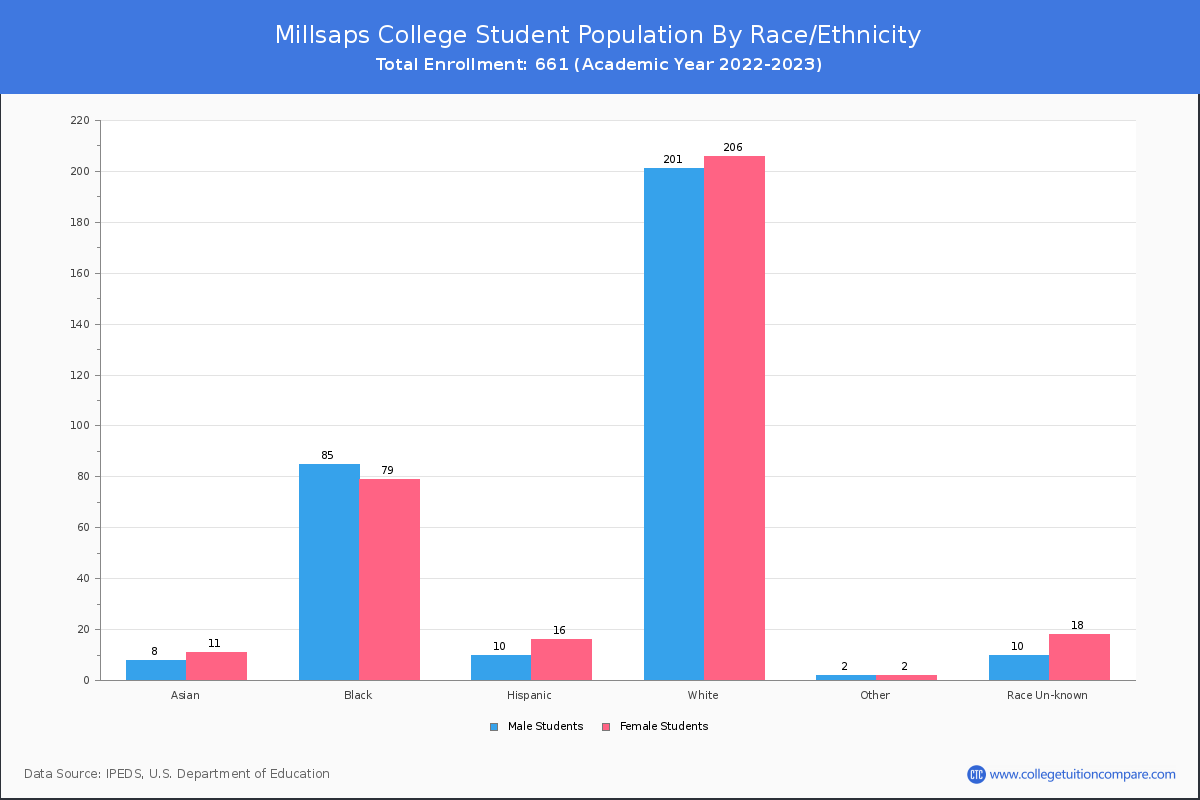
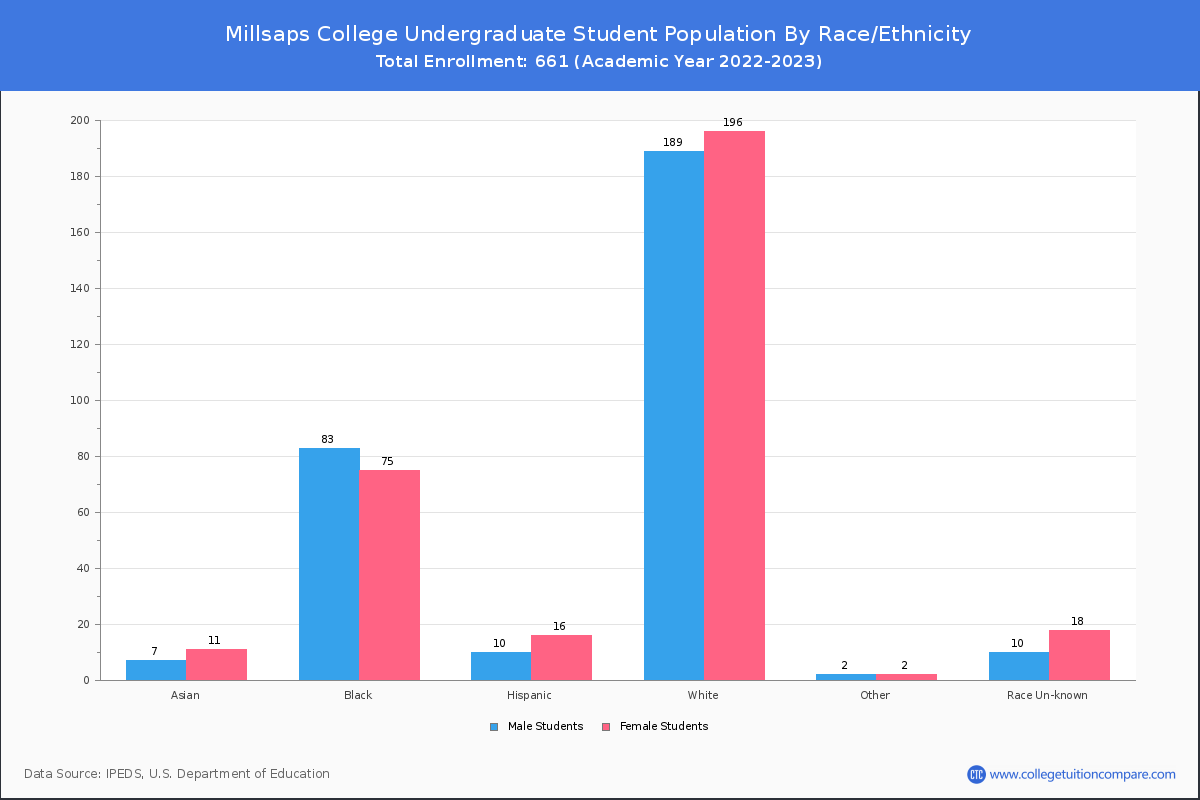
Student Distribution by Race/Ethnicity
By race/ethnicity, 393 White, 177 Black, and 20 Asian students out of a total of 661 are attending at Millsaps College. Comprehensive enrollment statistic data by race/ethnicity is shown in the next chart (Academic year 2022-2023 data).

| Race | Total | Men | Women |
|---|---|---|---|
| American Indian or Native American | 2 | 0 | 2 |
| Asian | 20 | 8 | 12 |
| Black | 177 | 102 | 75 |
| Hispanic | 27 | 13 | 14 |
| Native Hawaiian or Other Pacific Islanders | 1 | 1 | 0 |
| White | 393 | 215 | 178 |
| Two or more races | 6 | 4 | 2 |
| Race Unknown | 18 | 11 | 7 |
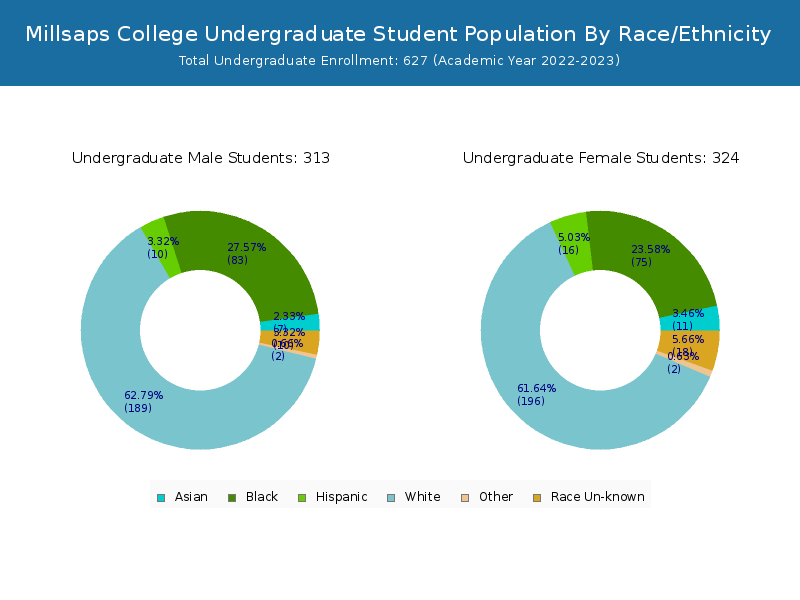
| Race | Total | Men | Women |
|---|---|---|---|
| American Indian or Native American | 2 | 0 | 2 |
| Asian | 18 | 7 | 11 |
| Black | 168 | 98 | 70 |
| Hispanic | 27 | 13 | 14 |
| Native Hawaiian or Other Pacific Islanders | 1 | 1 | 0 |
| White | 373 | 202 | 171 |
| Two or more races | 6 | 4 | 2 |
| Race Unknown | 16 | 9 | 7 |
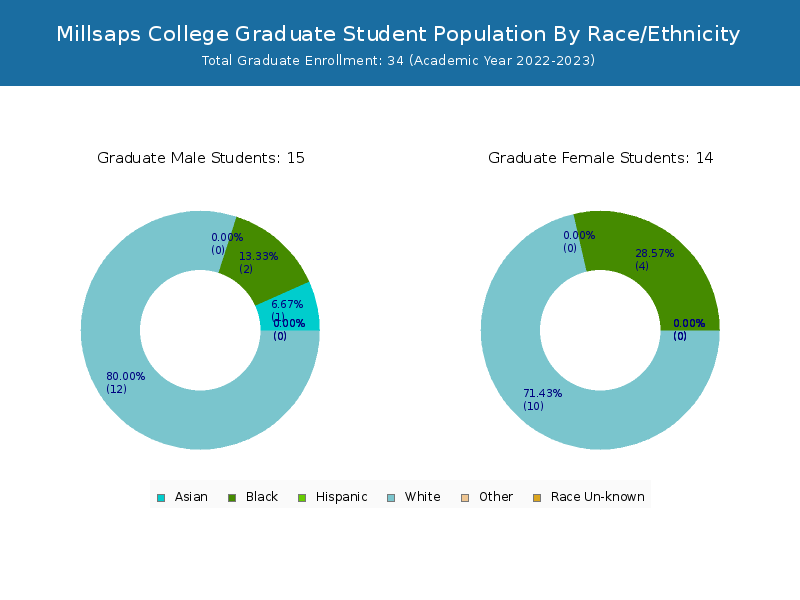
| Race | Total | Men | Women |
|---|---|---|---|
| American Indian or Native American | 0 | 0 | 0 |
| Asian | 1 | 0 | 1 |
| Black | 2 | 2 | 0 |
| Hispanic | 0 | 0 | 0 |
| Native Hawaiian or Other Pacific Islanders | 0 | 0 | 0 |
| White | 11 | 5 | 6 |
| Two or more races | 1 | 0 | 1 |
| Race Unknown | 1 | 1 | 0 |
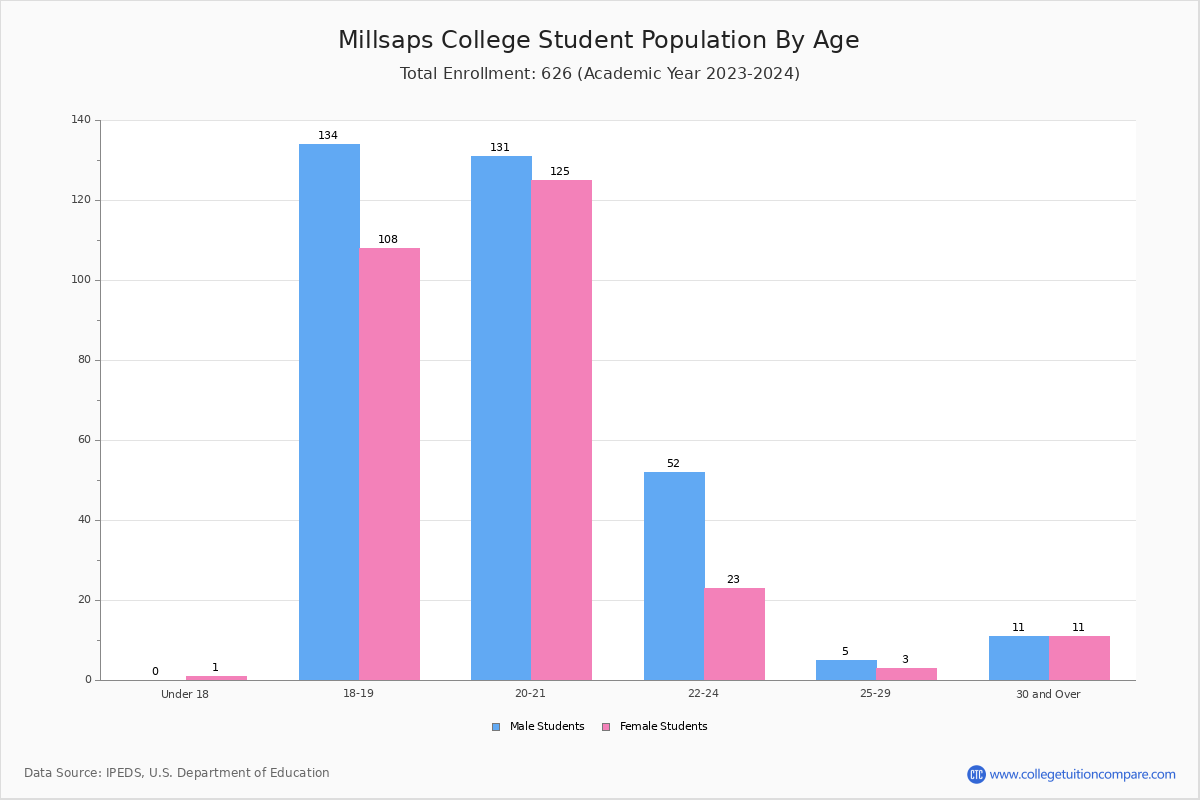
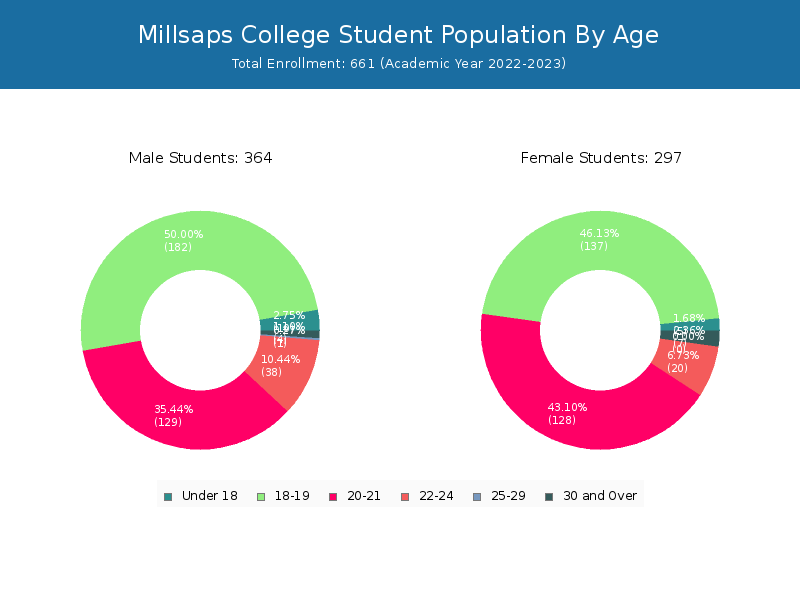
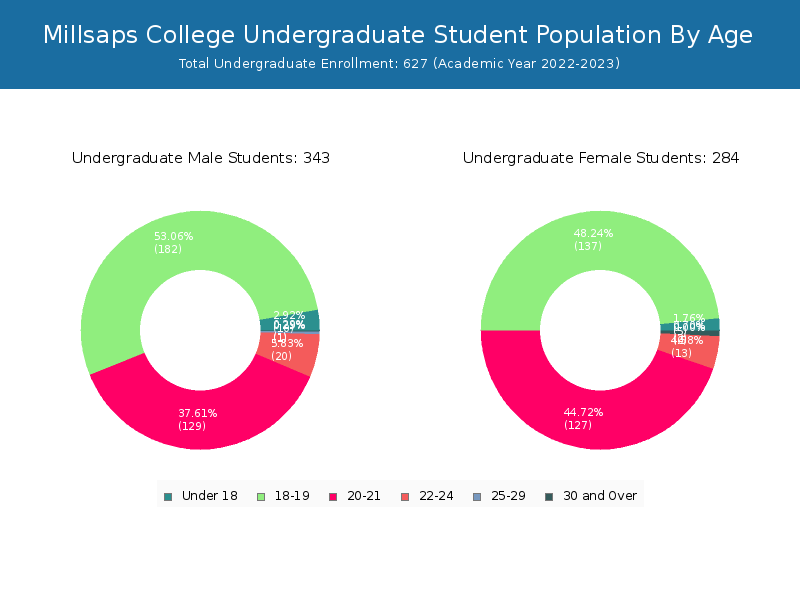
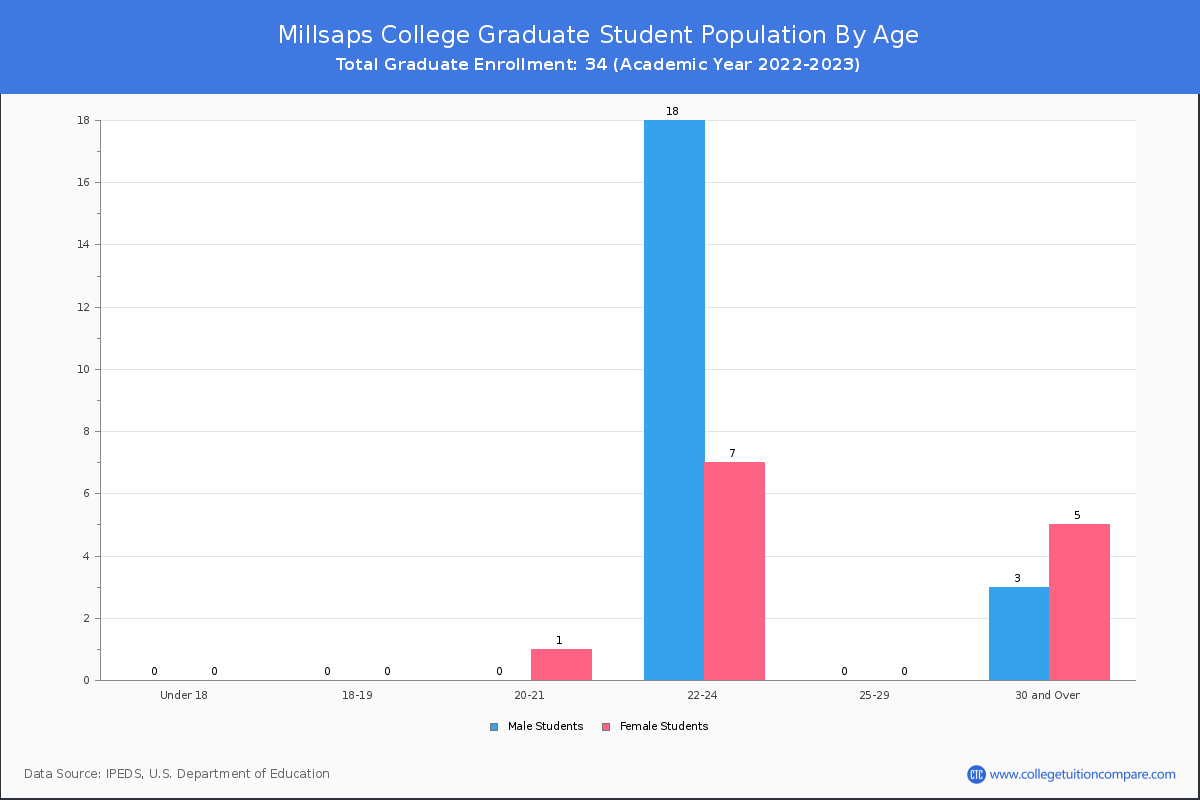
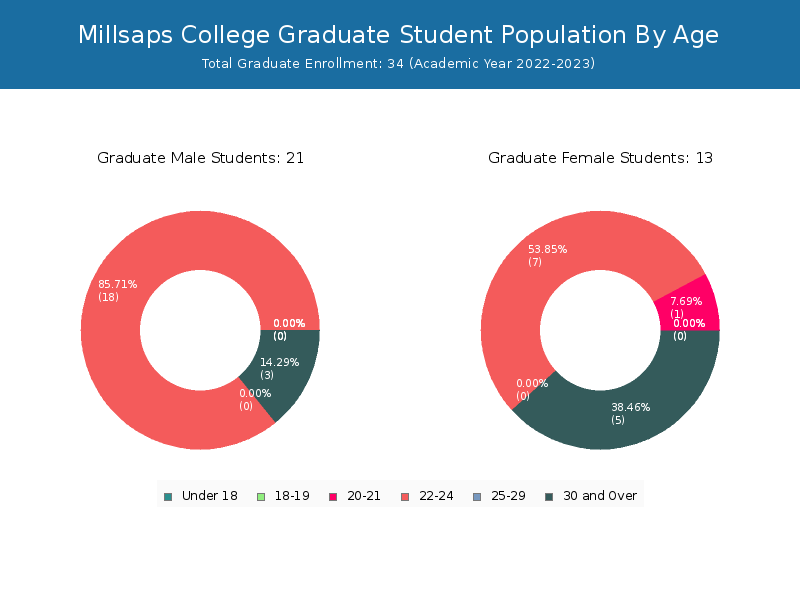
Student Age Distribution
By age, Millsaps has 15 students under 18 years old and 1 students over 65 years old. There are 649 students under 25 years old, and 12 students over 25 years old out of 661 total students.
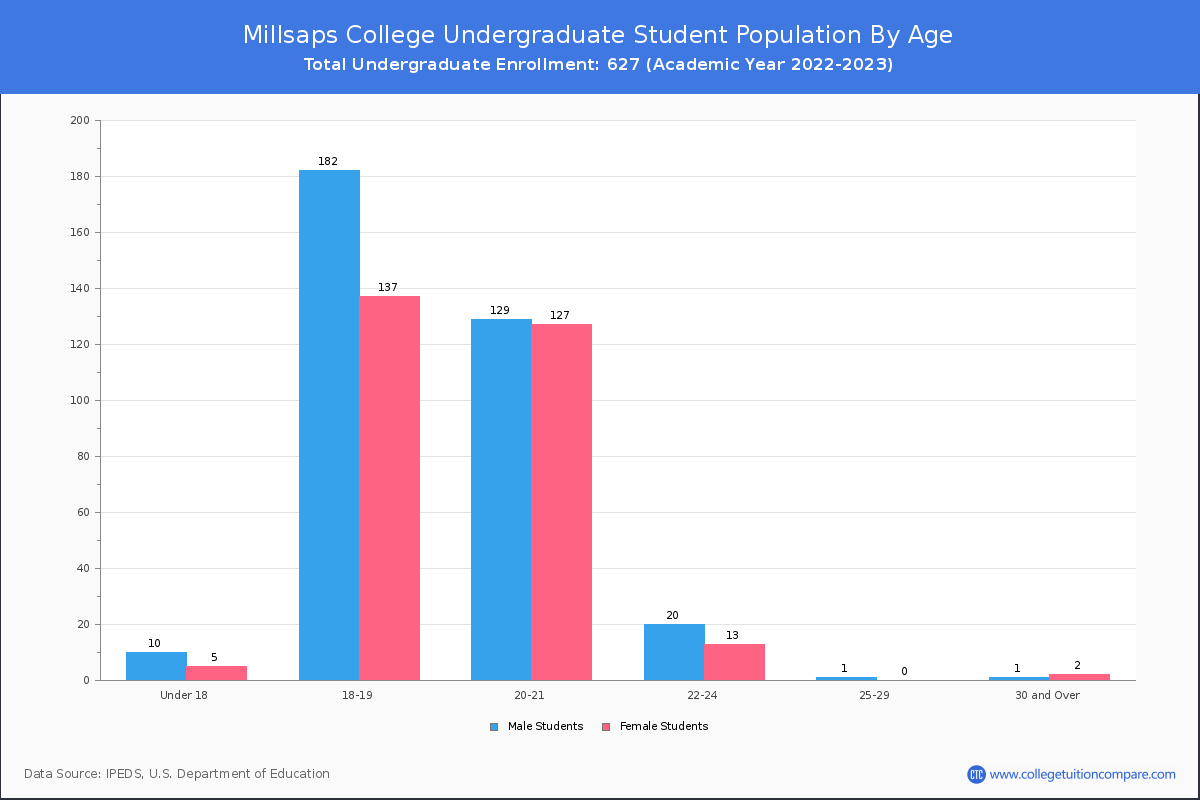
In undergraduate programs, 15 students are younger than 18 and 1 students are older than 65. Millsaps has 623 undergraduate students aged under 25 and 4 students aged 25 and over.
It has 26 graduate students aged under 25 and 8 students aged 25 and over.
| Age | Total | Men | Women |
|---|---|---|---|
| Under 18 | 15 | 5 | 10 |
| 18-19 | 319 | 137 | 182 |
| 20-21 | 257 | 128 | 129 |
| 22-24 | 58 | 20 | 38 |
| 25-29 | 1 | 0 | 1 |
| 30-34 | 4 | 4 | 0 |
| 35-39 | 2 | 2 | 0 |
| 40-49 | 4 | 1 | 3 |
| Age | Total | Men | Women |
|---|---|---|---|
| Under 18 | 15 | 5 | 10 |
| 18-19 | 319 | 137 | 182 |
| 20-21 | 256 | 127 | 129 |
| 22-24 | 33 | 13 | 20 |
| 25-29 | 1 | 0 | 1 |
| 30-34 | 1 | 1 | 0 |
| 35-39 | 1 | 1 | 0 |
| Age | Total | Men | Women |
|---|
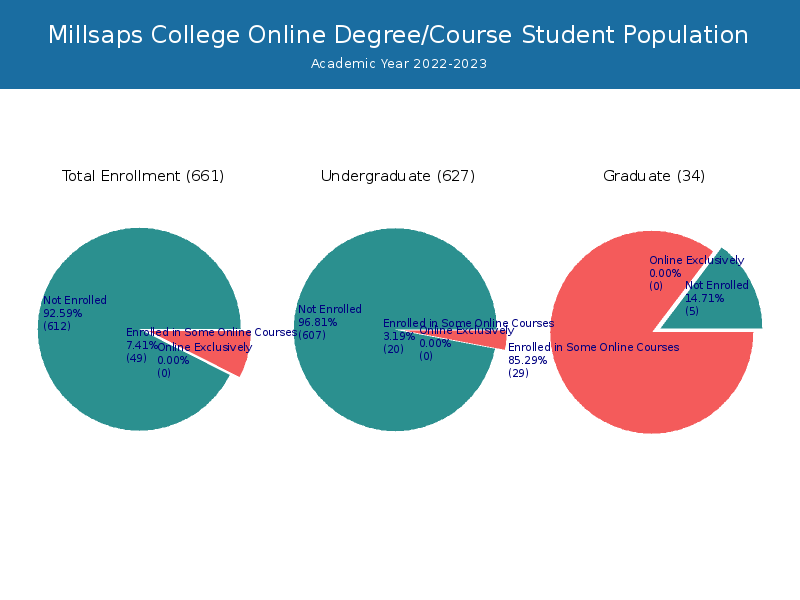
Online Student Enrollment
Distance learning, also called online education, is very attractive to students, especially who want to continue education and work in field. At Millsaps College, 49 students are enrolled in some online courses.
| All Students | Enrolled Exclusively Online Courses | Enrolled in Some Online Courses | |
|---|---|---|---|
| All Students | 661 | 0 | 49 |
| Undergraduate | 627 | 0 | 20 |
| Graduate | 34 | 0 | 29 |
| Mississippi Residents | Other States in U.S. | Outside of U.S. | |
|---|---|---|---|
| All Students | 0 | - | 0 |
| Undergraduate | 0 | - | 0 |
| Graduate | 0 | - | 0 |
Transfer-in Students (Undergraduate)
Among 627 enrolled in undergraduate programs, 16 students have transferred-in from other institutions. The percentage of transfer-in students is 2.55%.
| Number of Students | |
|---|---|
| Regular Full-time | 605 |
| Transfer-in Full-time | 16 |