Student Population by Gender
Delta State University has a total of 2,556 enrolled students for the academic year 2022-2023. 1,889 students have enrolled in undergraduate programs and 667 students joined graduate programs.
By gender, 942 male and 1,614 female students (the male-female ratio is 37:63) are attending the school. The gender distribution is based on the 2022-2023 data.
| Total | Undergraduate | Graduate | |
|---|---|---|---|
| Total | 2,556 | 1,889 | 667 |
| Men | 942 | 762 | 180 |
| Women | 1,614 | 1,127 | 487 |
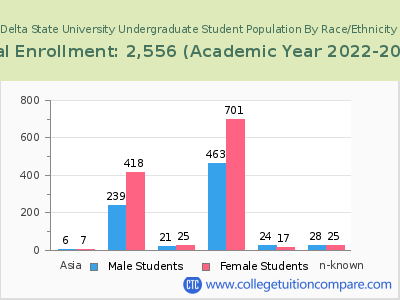
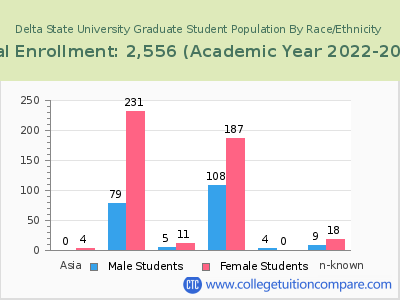
Student Distribution by Race/Ethnicity
| Race | Total | Men | Women |
|---|---|---|---|
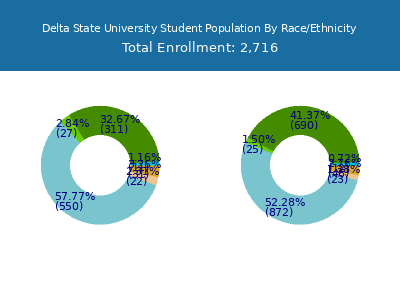
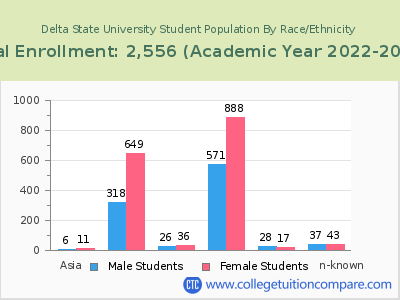
| American Indian or Native American | 5 | 3 | 2 |
| Asian | 11 | 2 | 9 |
| Black | 923 | 287 | 636 |
| Hispanic | 62 | 29 | 33 |
| Native Hawaiian or Other Pacific Islanders | 1 | 0 | 1 |
| White | 1,360 | 522 | 838 |
| Two or more races | 36 | 22 | 14 |
| Race Unknown | 74 | 31 | 43 |
| Race | Total | Men | Women |
|---|---|---|---|
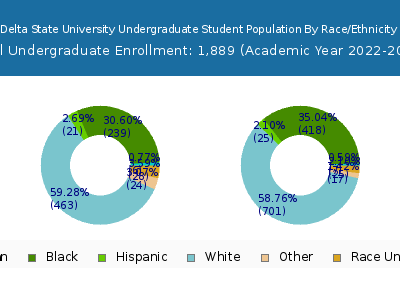
| American Indian or Native American | 4 | 2 | 2 |
| Asian | 8 | 2 | 6 |
| Black | 623 | 220 | 403 |
| Hispanic | 43 | 20 | 23 |
| Native Hawaiian or Other Pacific Islanders | 0 | 0 | 0 |
| White | 1,062 | 438 | 624 |
| Two or more races | 30 | 17 | 13 |
| Race Unknown | 60 | 29 | 31 |
| Race | Total | Men | Women |
|---|---|---|---|
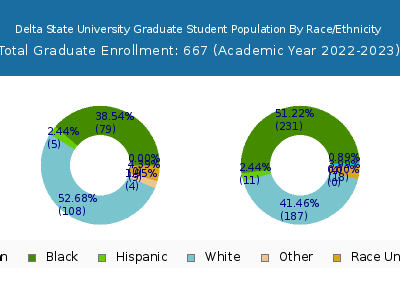
| American Indian or Native American | 0 | 0 | 0 |
| Asian | 0 | 0 | 0 |
| Black | 113 | 38 | 75 |
| Hispanic | 10 | 5 | 5 |
| Native Hawaiian or Other Pacific Islanders | 0 | 0 | 0 |
| White | 160 | 73 | 87 |
| Two or more races | 3 | 2 | 1 |
| Race Unknown | 12 | 6 | 6 |
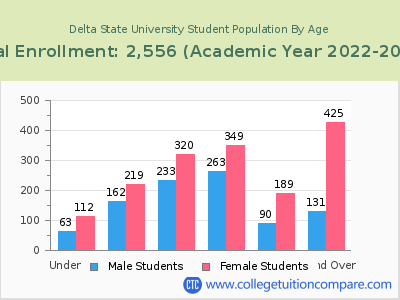
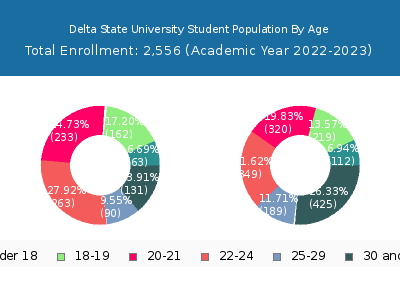
Student Age Distribution
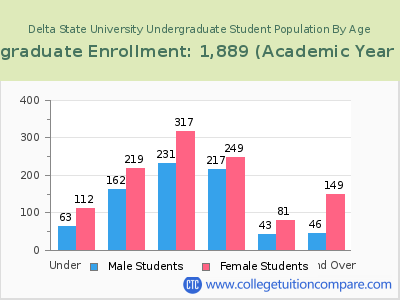
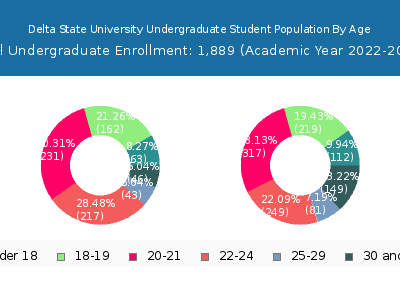
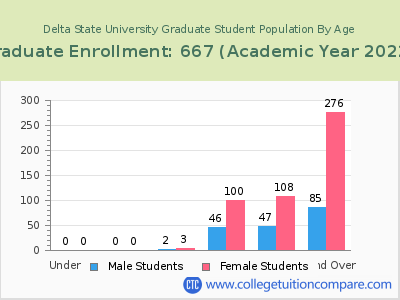
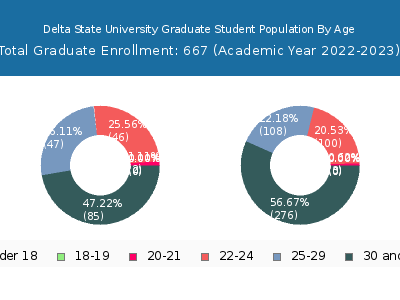
By age, Delta State has 175 students under 18 years old and 53 students over 65 years old. There are 1,721 students under 25 years old, and 835 students over 25 years old out of 2,556 total students.
In undergraduate programs, 175 students are younger than 18 and 49 students are older than 65. Delta State has 1,570 undergraduate students aged under 25 and 319 students aged 25 and over.
It has 151 graduate students aged under 25 and 516 students aged 25 and over.
| Age | Total | Men | Women |
|---|---|---|---|
| Under 18 | 175 | 112 | 63 |
| 18-19 | 381 | 219 | 162 |
| 20-21 | 553 | 320 | 233 |
| 22-24 | 612 | 349 | 263 |
| 25-29 | 279 | 189 | 90 |
| 30-34 | 165 | 124 | 41 |
| 35-39 | 94 | 65 | 29 |
| 40-49 | 162 | 132 | 30 |
| 50-64 | 82 | 57 | 25 |
| Over 65 | 53 | 47 | 6 |
| Age | Total | Men | Women |
|---|---|---|---|
| Under 18 | 175 | 112 | 63 |
| 18-19 | 381 | 219 | 162 |
| 20-21 | 548 | 317 | 231 |
| 22-24 | 466 | 249 | 217 |
| 25-29 | 124 | 81 | 43 |
| 30-34 | 45 | 32 | 13 |
| 35-39 | 31 | 20 | 11 |
| 40-49 | 42 | 32 | 10 |
| 50-64 | 28 | 22 | 6 |
| Over 65 | 49 | 43 | 6 |
| Age | Total | Men | Women |
|---|
Online Student Enrollment
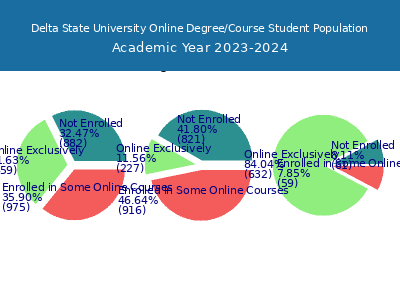
Distance learning, also called online education, is very attractive to students, especially who want to continue education and work in field. At Delta State University, 776 students are enrolled exclusively in online courses and 943 students are enrolled in some online courses.
636 students lived in Mississippi or jurisdiction in which the school is located are enrolled exclusively in online courses and 140 students live in other State or outside of the United States.
| All Students | Enrolled Exclusively Online Courses | Enrolled in Some Online Courses | |
|---|---|---|---|
| All Students | 2,556 | 776 | 943 |
| Undergraduate | 1,889 | 215 | 898 |
| Graduate | 667 | 561 | 45 |
| Mississippi Residents | Other States in U.S. | Outside of U.S. | |
|---|---|---|---|
| All Students | 636 | 130 | 10 |
| Undergraduate | 162 | 49 | 4 |
| Graduate | 474 | 81 | 6 |
Transfer-in Students (Undergraduate)
Among 1,889 enrolled in undergraduate programs, 310 students have transferred-in from other institutions. The percentage of transfer-in students is 16.41%.274 students have transferred in as full-time status and 36 students transferred in as part-time status.
| Number of Students | |
|---|---|
| Regular Full-time | 1,144 |
| Transfer-in Full-time | 274 |
| Regular Part-time | 435 |
| Transfer-in Part-time | 36 |
