Student Population by Gender
University of Northwestern-St Paul has a total of 3,253 enrolled students for the academic year 2022-2023. 3,161 students have enrolled in undergraduate programs and 92 students joined graduate programs.
By gender, 1,260 male and 1,993 female students (the male-female ratio is 39:61) are attending the school. The gender distribution is based on the 2022-2023 data.
| Total | Undergraduate | Graduate | |
|---|---|---|---|
| Total | 3,253 | 3,161 | 92 |
| Men | 1,260 | 1,209 | 51 |
| Women | 1,993 | 1,952 | 41 |
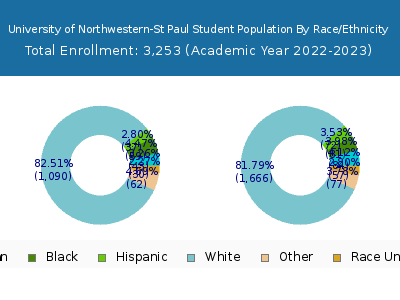
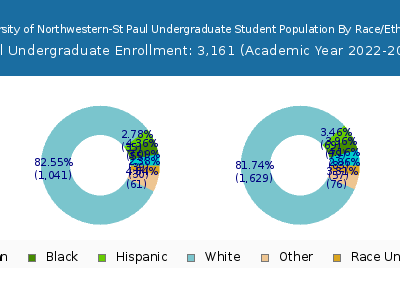
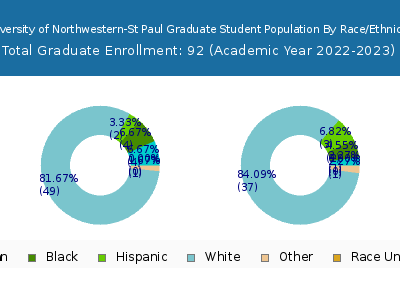
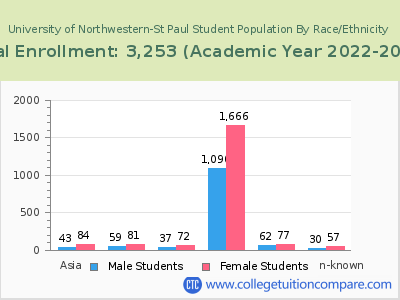
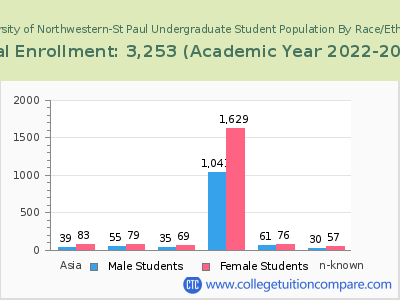
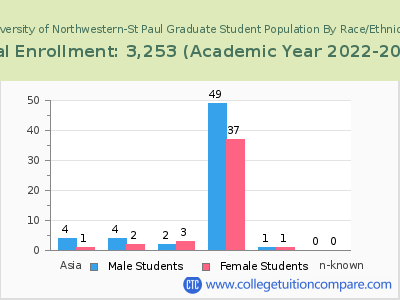
Student Distribution by Race/Ethnicity
| Race | Total | Men | Women |
|---|---|---|---|
| American Indian or Native American | 2 | 2 | 0 |
| Asian | 122 | 37 | 85 |
| Black | 129 | 59 | 70 |
| Hispanic | 141 | 57 | 84 |
| Native Hawaiian or Other Pacific Islanders | 3 | 2 | 1 |
| White | 2,611 | 994 | 1,617 |
| Two or more races | 130 | 60 | 70 |
| Race Unknown | 78 | 27 | 51 |
| Race | Total | Men | Women |
|---|---|---|---|
| American Indian or Native American | 2 | 2 | 0 |
| Asian | 114 | 33 | 81 |
| Black | 122 | 55 | 67 |
| Hispanic | 139 | 56 | 83 |
| Native Hawaiian or Other Pacific Islanders | 3 | 2 | 1 |
| White | 2,545 | 958 | 1,587 |
| Two or more races | 127 | 59 | 68 |
| Race Unknown | 75 | 24 | 51 |
| Race | Total | Men | Women |
|---|---|---|---|
| American Indian or Native American | 0 | 0 | 0 |
| Asian | 6 | 0 | 6 |
| Black | 12 | 2 | 10 |
| Hispanic | 7 | 3 | 4 |
| Native Hawaiian or Other Pacific Islanders | 0 | 0 | 0 |
| White | 67 | 31 | 36 |
| Two or more races | 7 | 2 | 5 |
| Race Unknown | 0 | 0 | 0 |
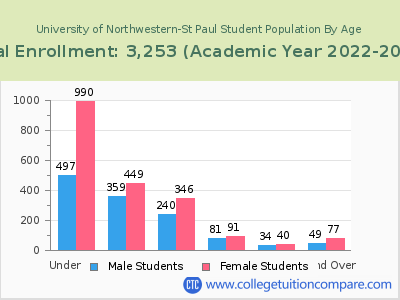
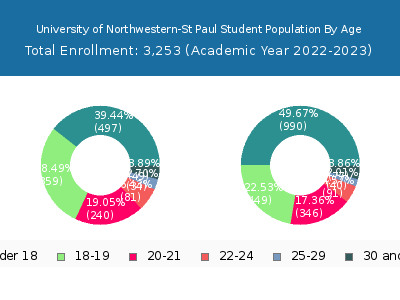
Student Age Distribution
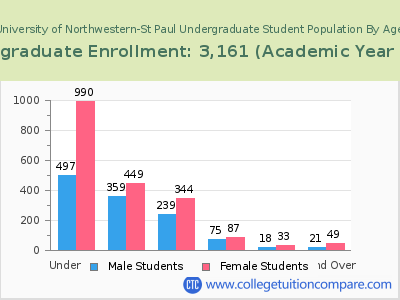
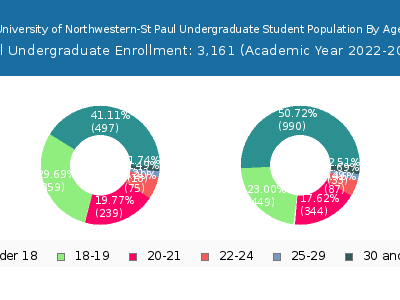
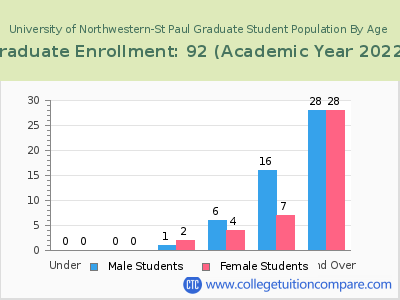
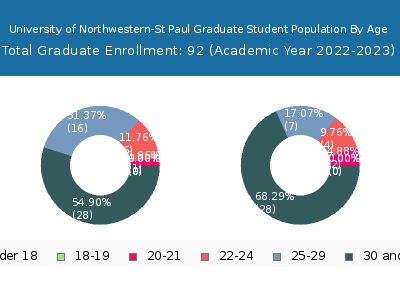
By age, U of Northwestern-St Paul has 1,487 students under 18 years old and 4 students over 65 years old. There are 3,053 students under 25 years old, and 200 students over 25 years old out of 3,253 total students.
In undergraduate programs, 1,487 students are younger than 18 and 1 students are older than 65. U of Northwestern-St Paul has 3,040 undergraduate students aged under 25 and 121 students aged 25 and over.
It has 13 graduate students aged under 25 and 79 students aged 25 and over.
| Age | Total | Men | Women |
|---|---|---|---|
| Under 18 | 1,487 | 990 | 497 |
| 18-19 | 808 | 449 | 359 |
| 20-21 | 586 | 346 | 240 |
| 22-24 | 172 | 91 | 81 |
| 25-29 | 74 | 40 | 34 |
| 30-34 | 29 | 15 | 14 |
| 35-39 | 24 | 17 | 7 |
| 40-49 | 44 | 30 | 14 |
| 50-64 | 25 | 12 | 13 |
| Over 65 | 4 | 3 | 1 |
| Age | Total | Men | Women |
|---|---|---|---|
| Under 18 | 1,487 | 990 | 497 |
| 18-19 | 808 | 449 | 359 |
| 20-21 | 583 | 344 | 239 |
| 22-24 | 162 | 87 | 75 |
| 25-29 | 51 | 33 | 18 |
| 30-34 | 14 | 10 | 4 |
| 35-39 | 15 | 11 | 4 |
| 40-49 | 30 | 20 | 10 |
| 50-64 | 10 | 7 | 3 |
| Over 65 | 1 | 1 | 0 |
| Age | Total | Men | Women |
|---|
Online Student Enrollment
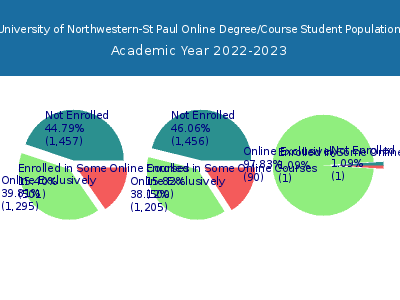
Distance learning, also called online education, is very attractive to students, especially who want to continue education and work in field. At University of Northwestern-St Paul, 1,295 students are enrolled exclusively in online courses and 501 students are enrolled in some online courses.
1,202 students lived in Minnesota or jurisdiction in which the school is located are enrolled exclusively in online courses and 93 students live in other State or outside of the United States.
| All Students | Enrolled Exclusively Online Courses | Enrolled in Some Online Courses | |
|---|---|---|---|
| All Students | 3,253 | 1,295 | 501 |
| Undergraduate | 3,161 | 1,205 | 500 |
| Graduate | 92 | 90 | 1 |
| Minnesota Residents | Other States in U.S. | Outside of U.S. | |
|---|---|---|---|
| All Students | 1,202 | 90 | 3 |
| Undergraduate | 1,140 | 63 | 2 |
| Graduate | 62 | 27 | 1 |
Transfer-in Students (Undergraduate)
Among 3,161 enrolled in undergraduate programs, 103 students have transferred-in from other institutions. The percentage of transfer-in students is 3.26%.85 students have transferred in as full-time status and 18 students transferred in as part-time status.
| Number of Students | |
|---|---|
| Regular Full-time | 1,798 |
| Transfer-in Full-time | 85 |
| Regular Part-time | 1,260 |
| Transfer-in Part-time | 18 |
