Student Population by Gender
Wayne State University has a total of 23,630 enrolled students for the academic year 2022-2023. 15,958 students have enrolled in undergraduate programs and 7,672 students joined graduate programs.
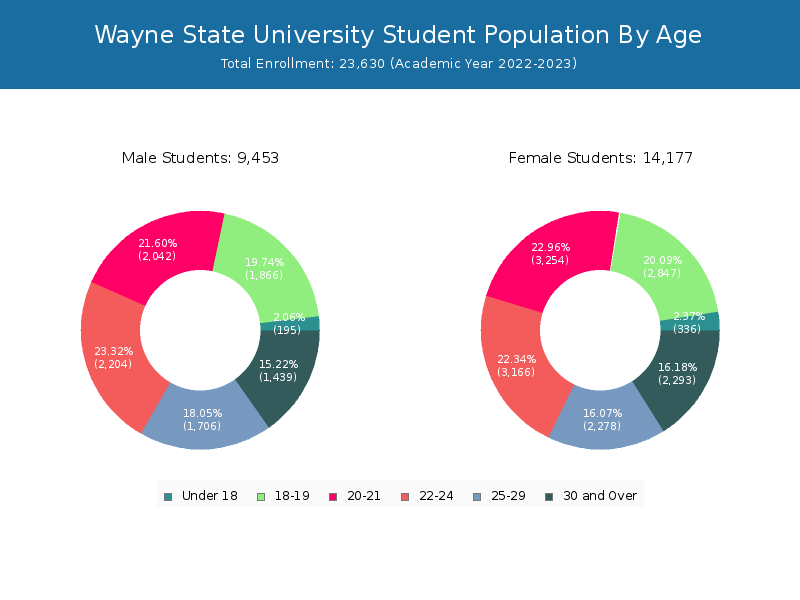
By gender, 9,453 male and 14,177 female students (the male-female ratio is 40:60) are attending the school. The gender distribution is based on the 2022-2023 data.
| Total | Undergraduate | Graduate | |
|---|---|---|---|
| Total | 23,630 | 15,958 | 7,672 |
| Men | 9,453 | 6,491 | 2,962 |
| Women | 14,177 | 9,467 | 4,710 |
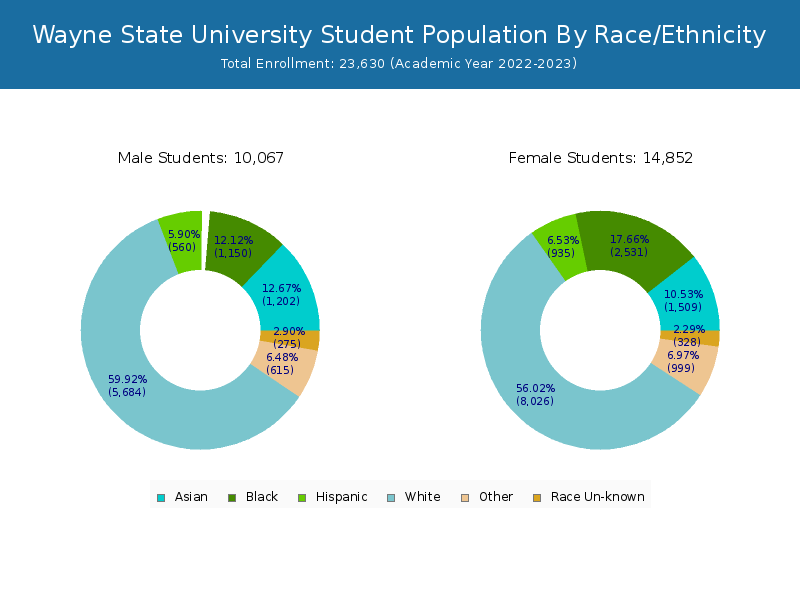
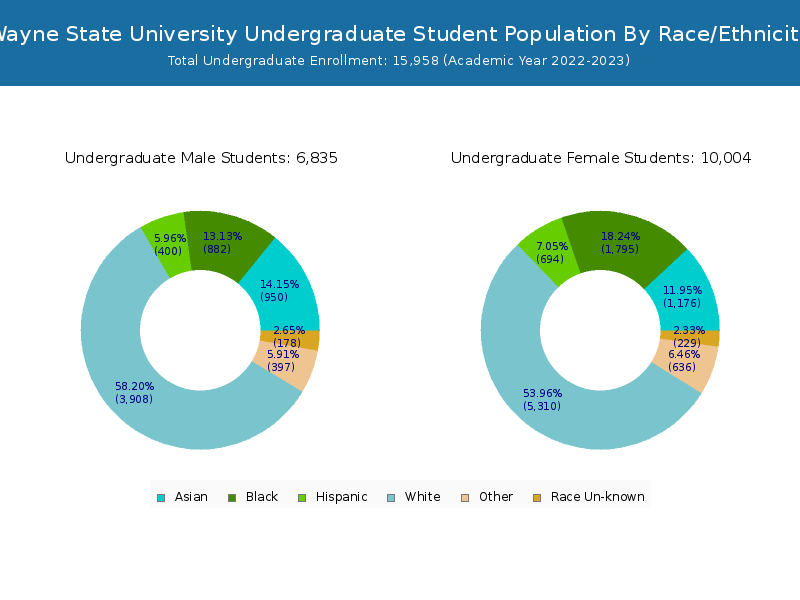
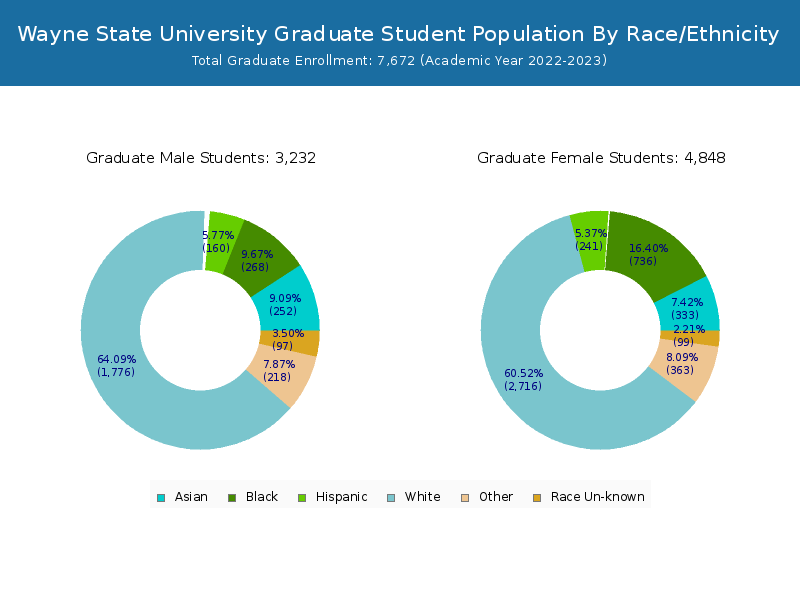
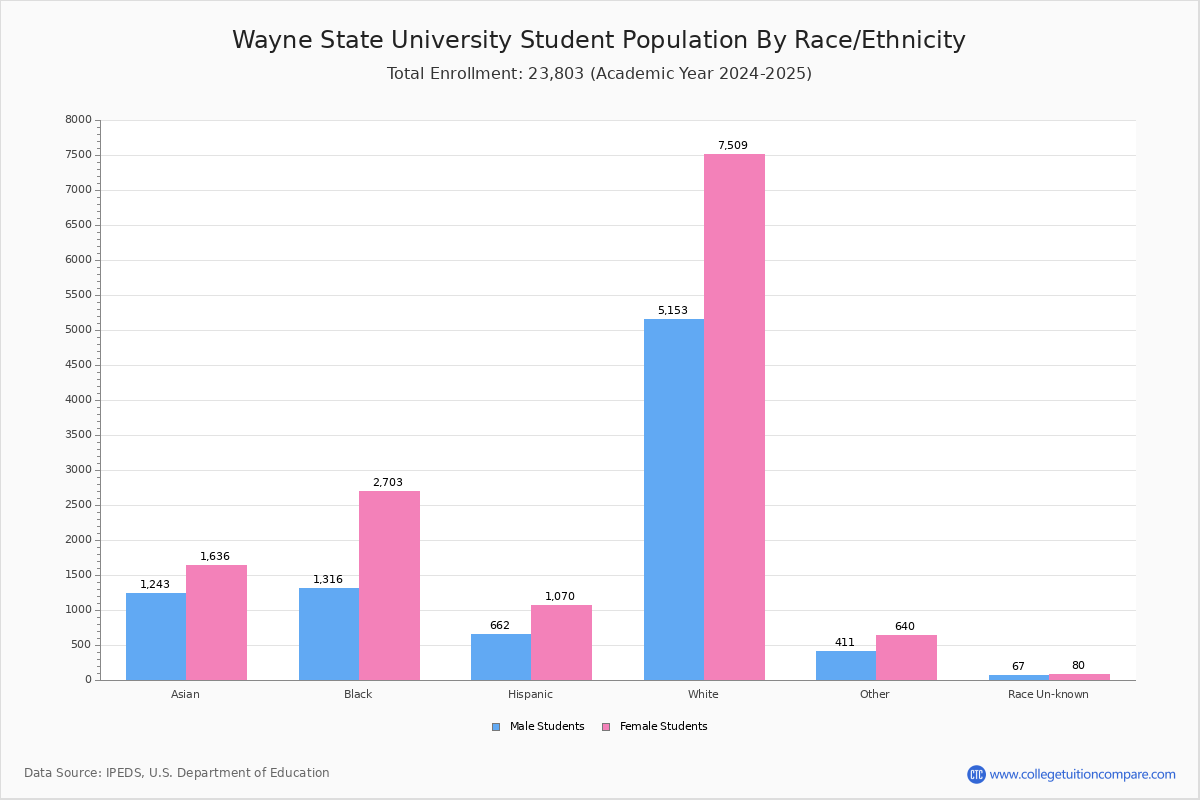
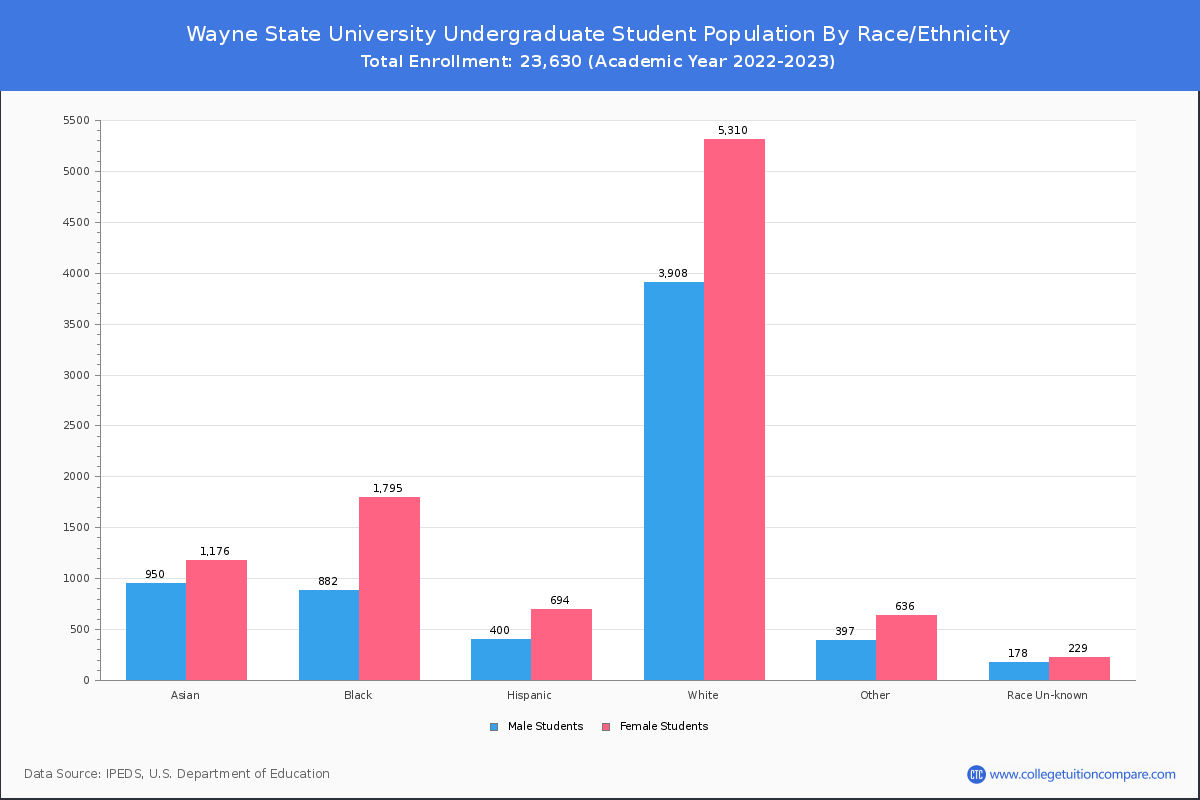
Student Distribution by Race/Ethnicity
By race/ethnicity, 13,182 White, 3,531 Black, and 2,725 Asian students out of a total of 23,630 are attending at Wayne State University. Comprehensive enrollment statistic data by race/ethnicity is shown in the next chart (Academic year 2022-2023 data).
| Race | Total | Men | Women |
|---|---|---|---|
| American Indian or Native American | 53 | 22 | 31 |
| Asian | 2,725 | 1,195 | 1,530 |
| Black | 3,531 | 1,114 | 2,417 |
| Hispanic | 1,456 | 530 | 926 |
| Native Hawaiian or Other Pacific Islanders | 11 | 6 | 5 |
| White | 13,182 | 5,327 | 7,855 |
| Two or more races | 909 | 353 | 556 |
| Race Unknown | 517 | 239 | 278 |
| Race | Total | Men | Women |
|---|---|---|---|
| American Indian or Native American | 39 | 19 | 20 |
| Asian | 2,123 | 939 | 1,184 |
| Black | 2,528 | 842 | 1,686 |
| Hispanic | 1,110 | 403 | 707 |
| Native Hawaiian or Other Pacific Islanders | 6 | 3 | 3 |
| White | 8,826 | 3,716 | 5,110 |
| Two or more races | 668 | 261 | 407 |
| Race Unknown | 340 | 153 | 187 |
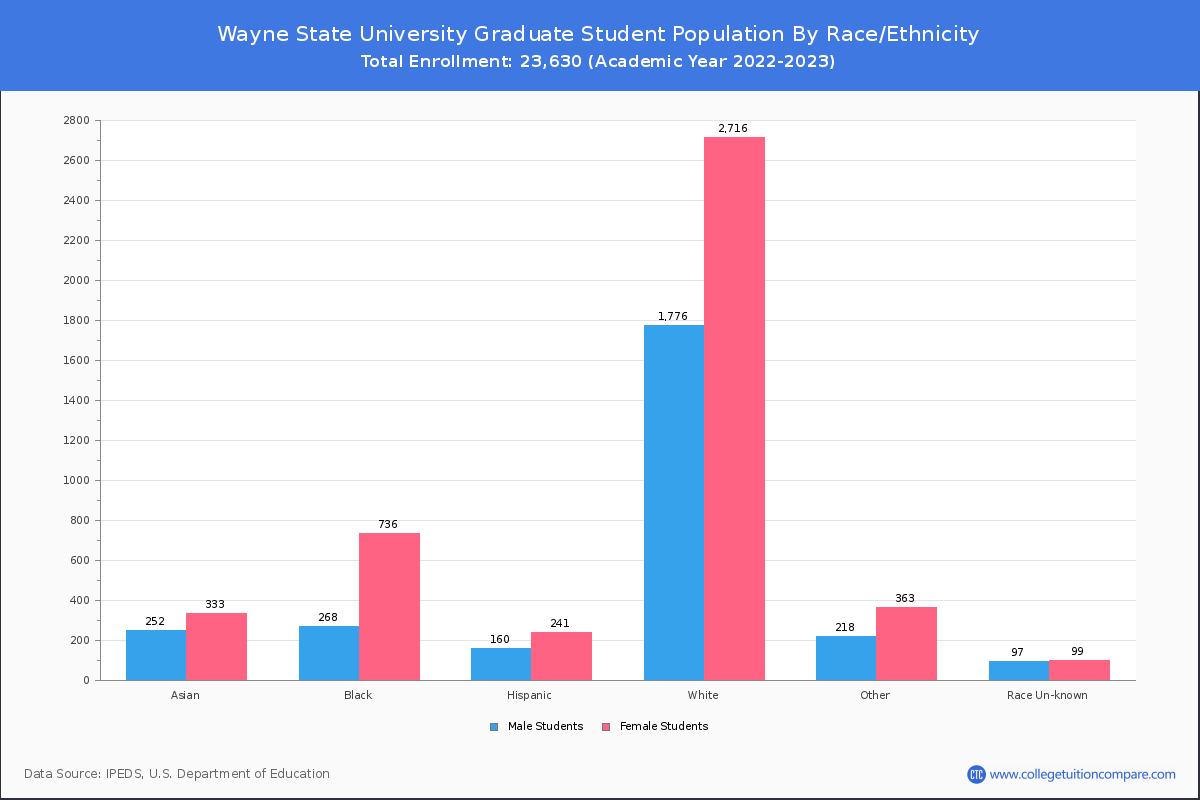
| Race | Total | Men | Women |
|---|---|---|---|
| American Indian or Native American | 2 | 0 | 2 |
| Asian | 85 | 40 | 45 |
| Black | 242 | 70 | 172 |
| Hispanic | 87 | 30 | 57 |
| Native Hawaiian or Other Pacific Islanders | 0 | 0 | 0 |
| White | 925 | 372 | 553 |
| Two or more races | 58 | 21 | 37 |
| Race Unknown | 25 | 6 | 19 |
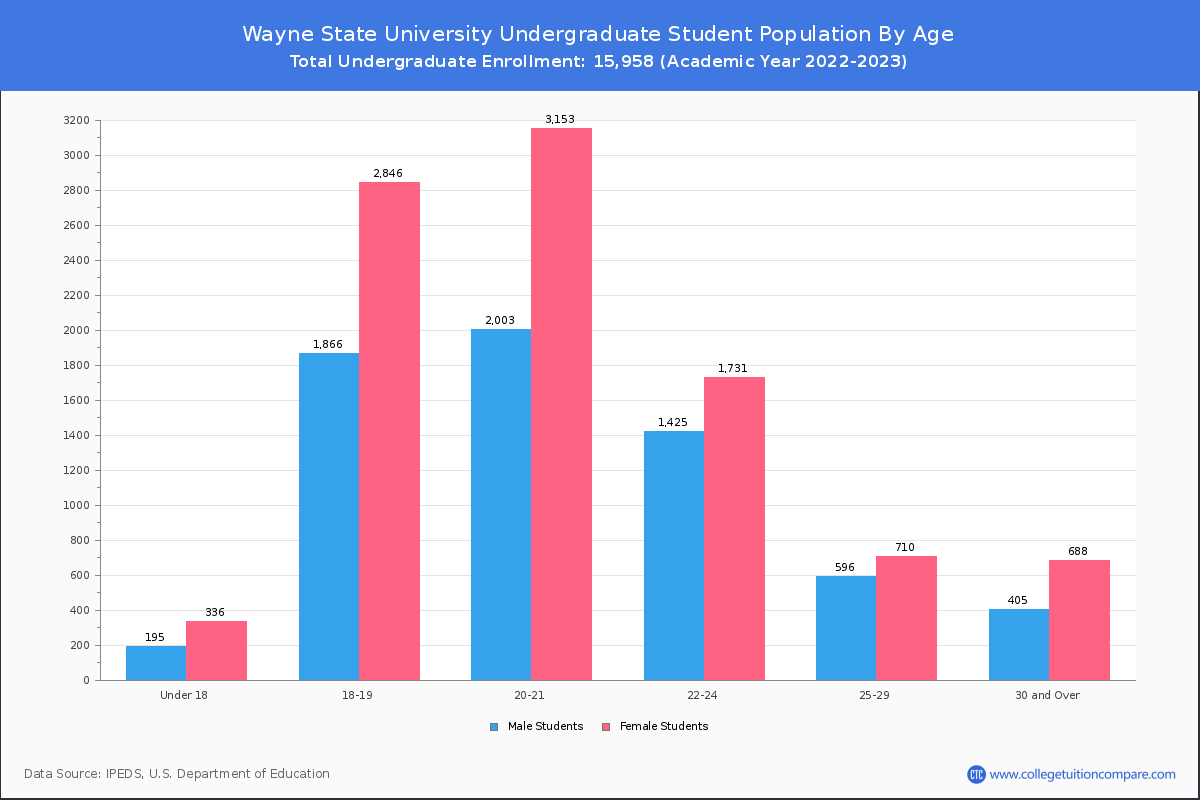
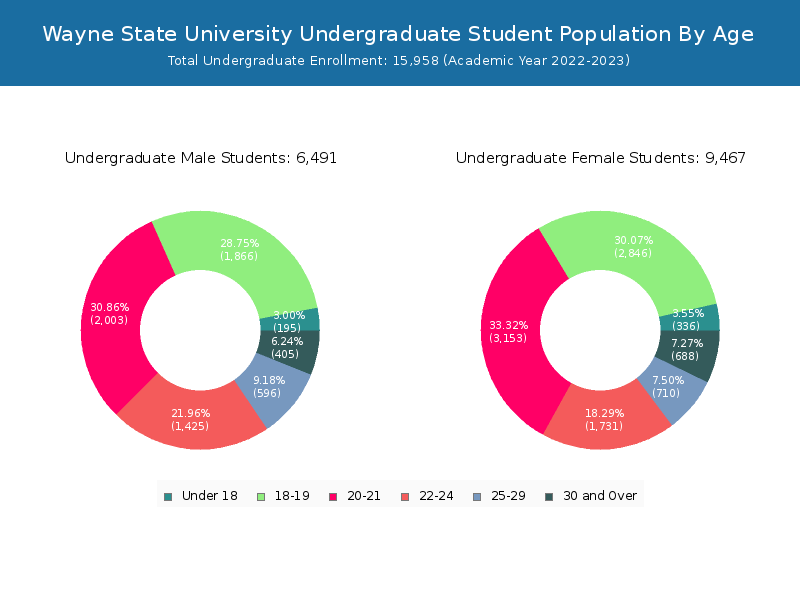
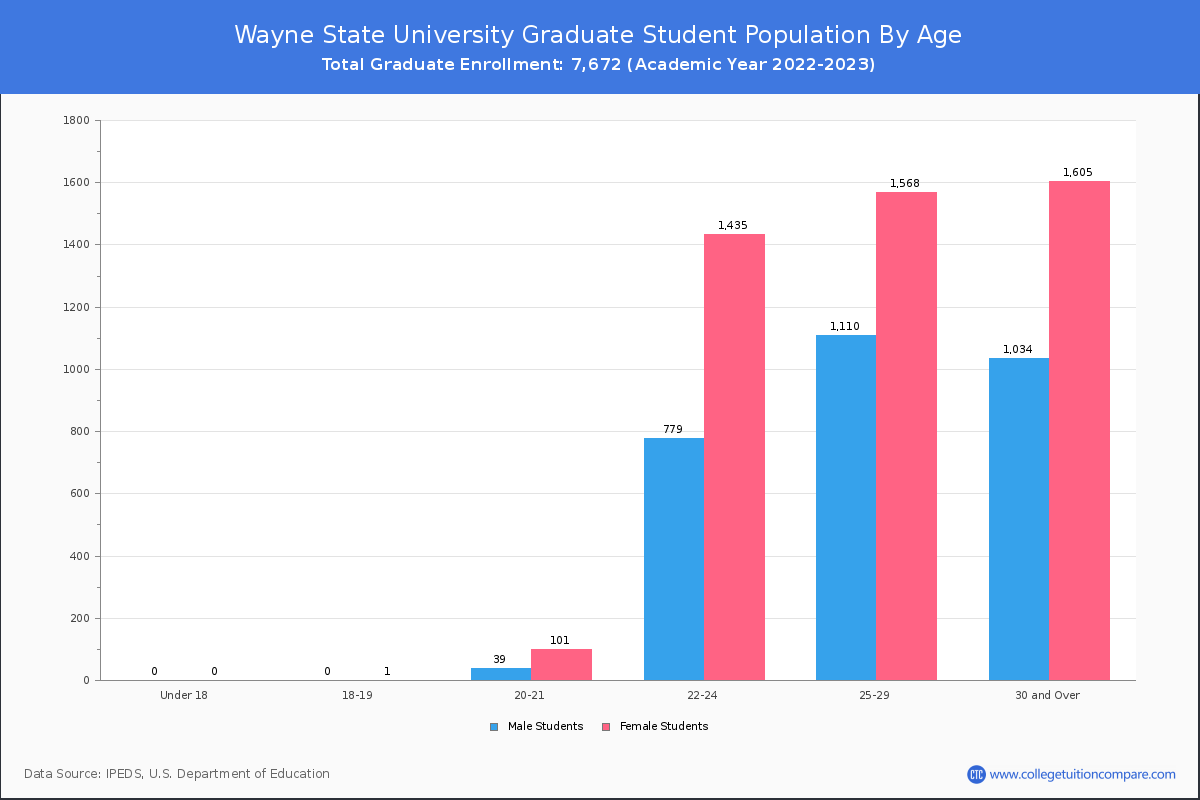
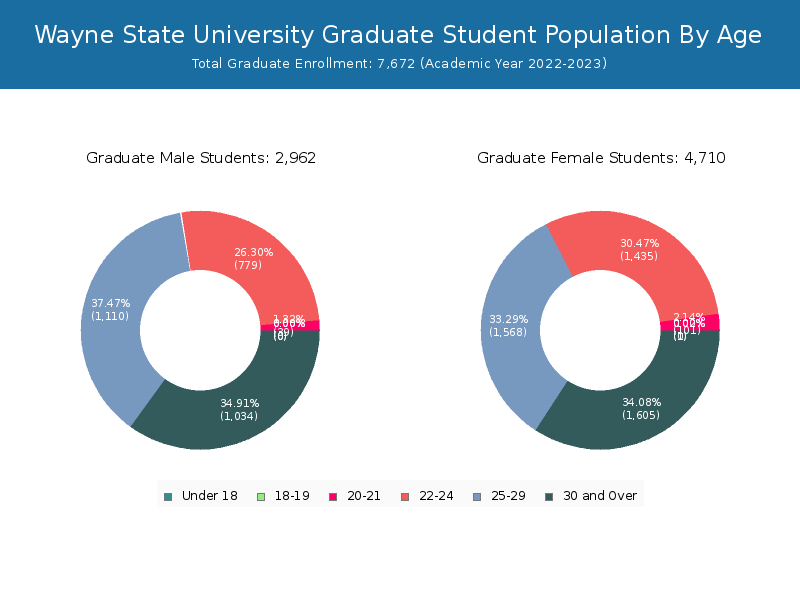
Student Age Distribution
By age, WSU has 531 students under 18 years old and 89 students over 65 years old. There are 15,910 students under 25 years old, and 7,716 students over 25 years old out of 23,630 total students.
In undergraduate programs, 531 students are younger than 18 and 38 students are older than 65. WSU has 13,555 undergraduate students aged under 25 and 2,399 students aged 25 and over.
It has 2,355 graduate students aged under 25 and 5,317 students aged 25 and over.
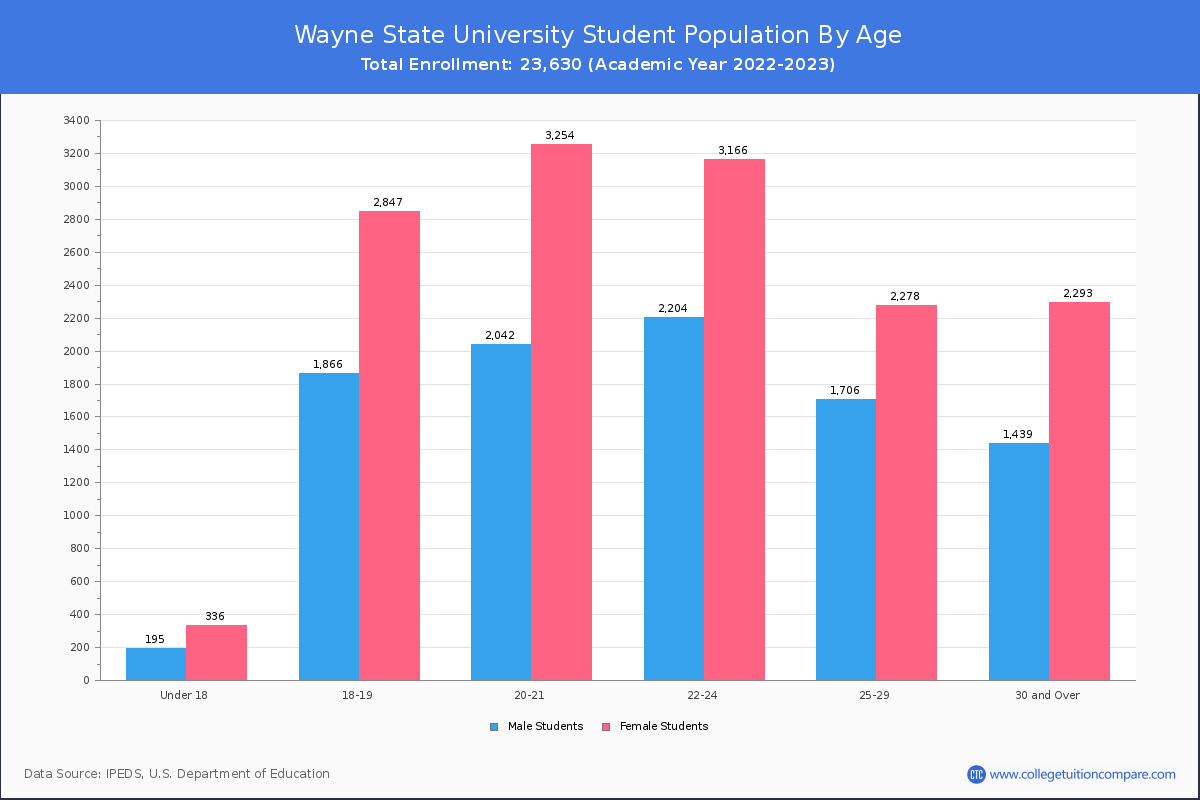
| Age | Total | Men | Women |
|---|---|---|---|
| Under 18 | 531 | 336 | 195 |
| 18-19 | 4,713 | 2,847 | 1,866 |
| 20-21 | 5,296 | 3,254 | 2,042 |
| 22-24 | 5,370 | 3,166 | 2,204 |
| 25-29 | 3,984 | 2,278 | 1,706 |
| 30-34 | 1,570 | 882 | 688 |
| 35-39 | 802 | 503 | 299 |
| 40-49 | 843 | 551 | 292 |
| 50-64 | 428 | 308 | 120 |
| Over 65 | 89 | 49 | 40 |
| Age | Total | Men | Women |
|---|---|---|---|
| Under 18 | 531 | 336 | 195 |
| 18-19 | 4,712 | 2,846 | 1,866 |
| 20-21 | 5,156 | 3,153 | 2,003 |
| 22-24 | 3,156 | 1,731 | 1,425 |
| 25-29 | 1,306 | 710 | 596 |
| 30-34 | 449 | 266 | 183 |
| 35-39 | 243 | 163 | 80 |
| 40-49 | 216 | 136 | 80 |
| 50-64 | 147 | 102 | 45 |
| Over 65 | 38 | 21 | 17 |
| Age | Total | Men | Women |
|---|
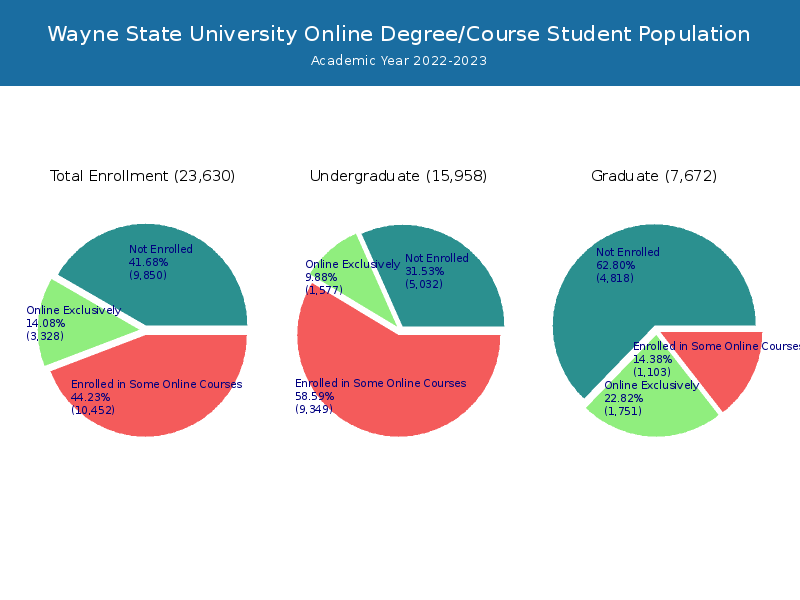
Online Student Enrollment
Distance learning, also called online education, is very attractive to students, especially who want to continue education and work in field. At Wayne State University, 3,328 students are enrolled exclusively in online courses and 10,452 students are enrolled in some online courses.
3,134 students lived in Michigan or jurisdiction in which the school is located are enrolled exclusively in online courses and 194 students live in other State or outside of the United States.
| All Students | Enrolled Exclusively Online Courses | Enrolled in Some Online Courses | |
|---|---|---|---|
| All Students | 23,630 | 3,328 | 10,452 |
| Undergraduate | 15,958 | 1,577 | 9,349 |
| Graduate | 7,672 | 1,751 | 1,103 |
| Michigan Residents | Other States in U.S. | Outside of U.S. | |
|---|---|---|---|
| All Students | 3,134 | 109 | 85 |
| Undergraduate | 1,536 | 24 | 17 |
| Graduate | 1,598 | 85 | 68 |
Transfer-in Students (Undergraduate)
Among 15,958 enrolled in undergraduate programs, 1,451 students have transferred-in from other institutions. The percentage of transfer-in students is 9.09%.974 students have transferred in as full-time status and 477 students transferred in as part-time status.
| Number of Students | |
|---|---|
| Regular Full-time | 11,132 |
| Transfer-in Full-time | 974 |
| Regular Part-time | 3,375 |
| Transfer-in Part-time | 477 |