Graduation Rates in Reasonable Completion Time
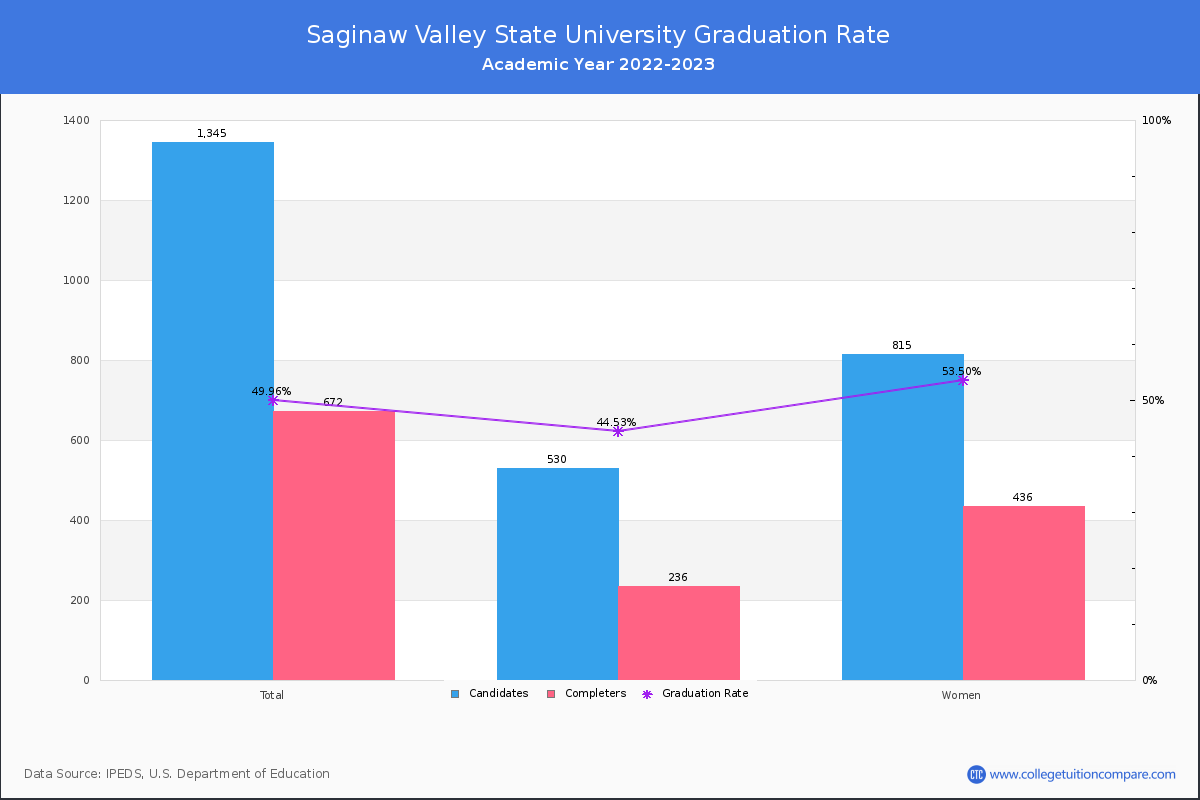
For the academic year 2022-2023, 672 students out of 1,345 candidates have completed their courses within 150% normal time (i.e. in 6 years for 4-year BS degree) at Saginaw Valley State University.
By gender, 236 male and 436 female students graduated the school last year completing their jobs in the period. Its graduation rate is around the average rate when comparing similar colleges' rate of 48.89% (public Master's College and University with larger programs).
| Candidates | Completers | Graduation Rates | |
|---|---|---|---|
| Total | 1,345 | 672 | 49.96% |
| Men | 530 | 236 | 44.53% |
| Women | 815 | 436 | 53.50% |
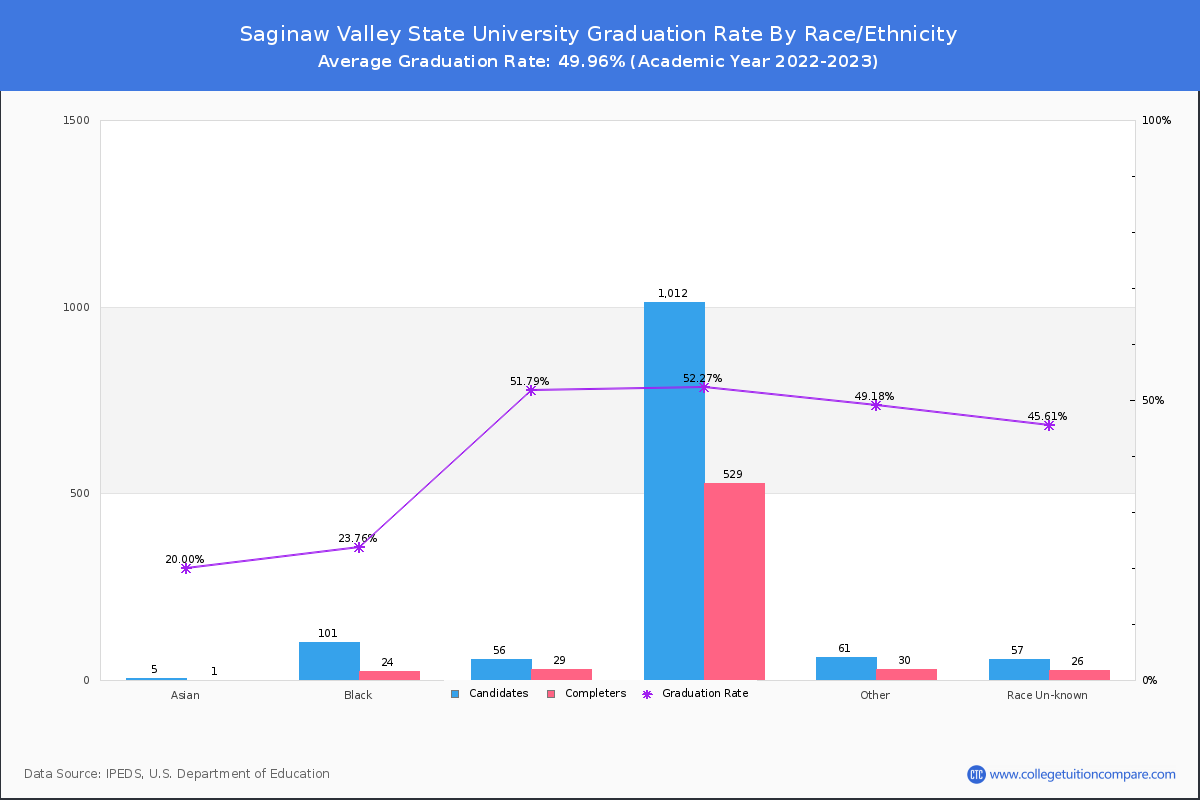
Graduation Rate By Race/Ethnicity
The following table shows graduation rate by race and at Saginaw Valley State University.
- American Indian or Alaska Native: 25.00%
- Asian: 20.00%
- Black (Non-Hispanic): 23.76%
- Hispanic: 51.79%
- White: 52.27%
- Two or More Race: 50.88%
- Unknown: 45.61%
| Total | Male | Female | |
|---|---|---|---|
| American Indian or Alaska Native | 25.00%(1/4) | 33.33%(1/3) | - |
| Asian | 20.00%(1/5) | - | 33.33%(1/3) |
| Black (Non-Hispanic) | 23.76%(24/101) | 24.53%(13/53) | 22.92%(11/48) |
| Hispanic | 51.79%(29/56) | 43.75%(7/16) | 55.00%(22/40) |
| White | 52.27%(529/1,012) | 46.30%(175/378) | 55.84%(354/634) |
| Two or More Race | 50.88%(29/57) | 46.67%(7/15) | 52.38%(22/42) |
| Unknown | 45.61%(26/57) | 42.31%(11/26) | 48.39%(15/31) |
Non-Resident Alien Graduation Rate
A non-resident alien student is not a US citizen/green card holder and studies with a student visa, such as an F visa, in the United States. At Saginaw Valley State University, 33 of 53 non-resident alien students completed their studies and the graduation rate was 62.26%.