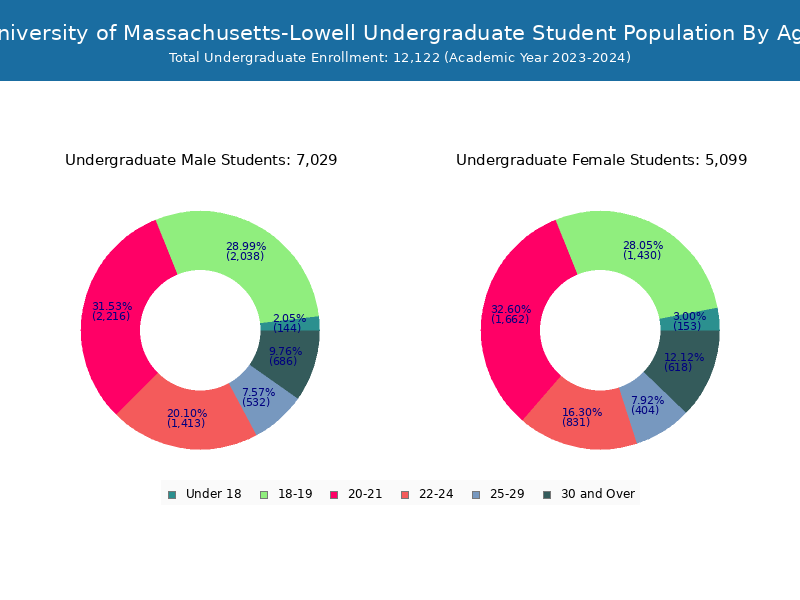
Student Population by Gender
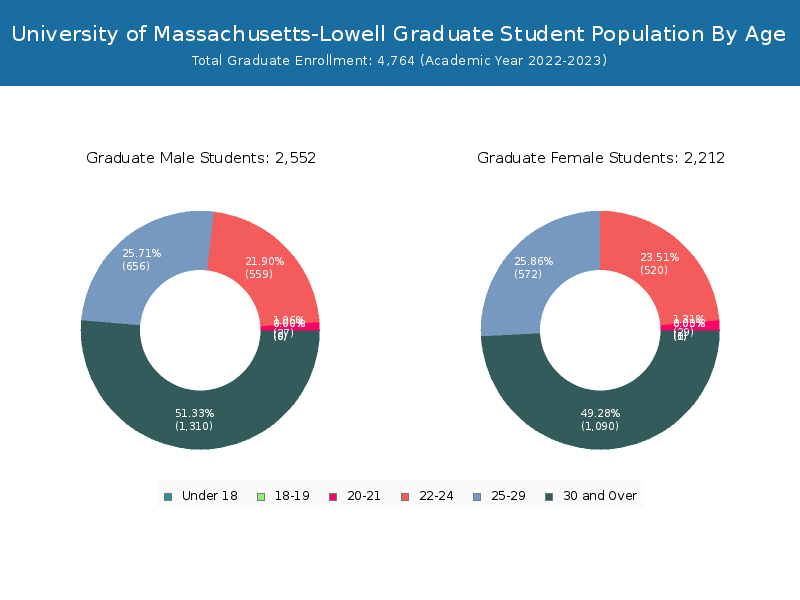
University of Massachusetts-Lowell has a total of 17,153 enrolled students for the academic year 2022-2023. 12,389 students have enrolled in undergraduate programs and 4,764 students joined graduate programs.
By gender, 9,743 male and 7,410 female students (the male-female ratio is 57:43) are attending the school. The gender distribution is based on the 2022-2023 data.
| Total | Undergraduate | Graduate | |
|---|---|---|---|
| Total | 17,153 | 12,389 | 4,764 |
| Men | 9,743 | 7,191 | 2,552 |
| Women | 7,410 | 5,198 | 2,212 |
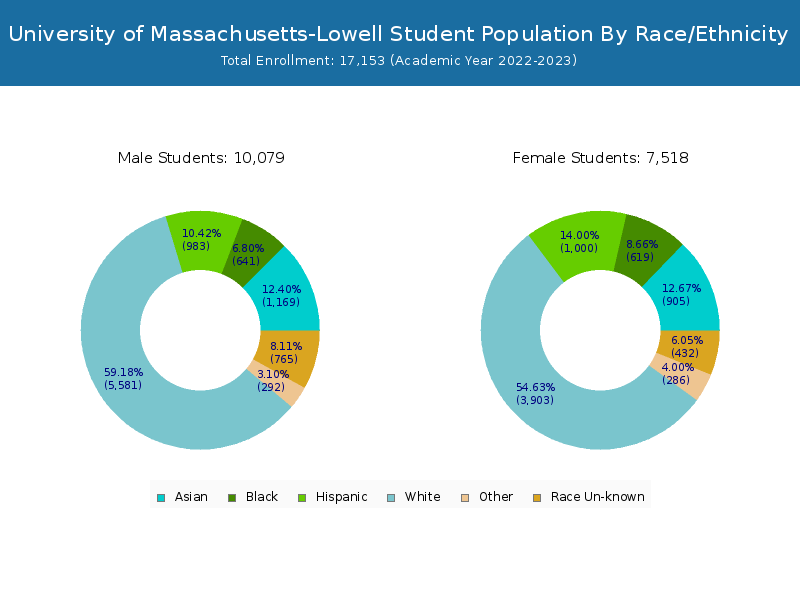
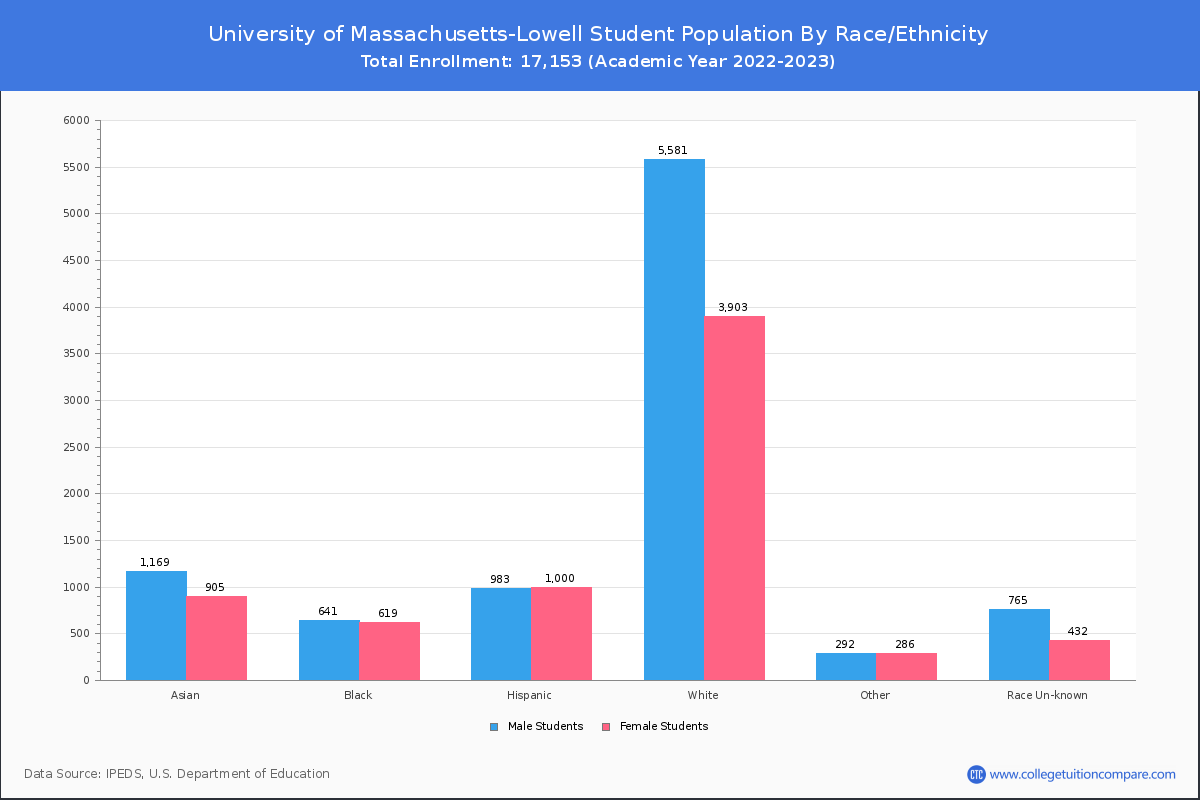
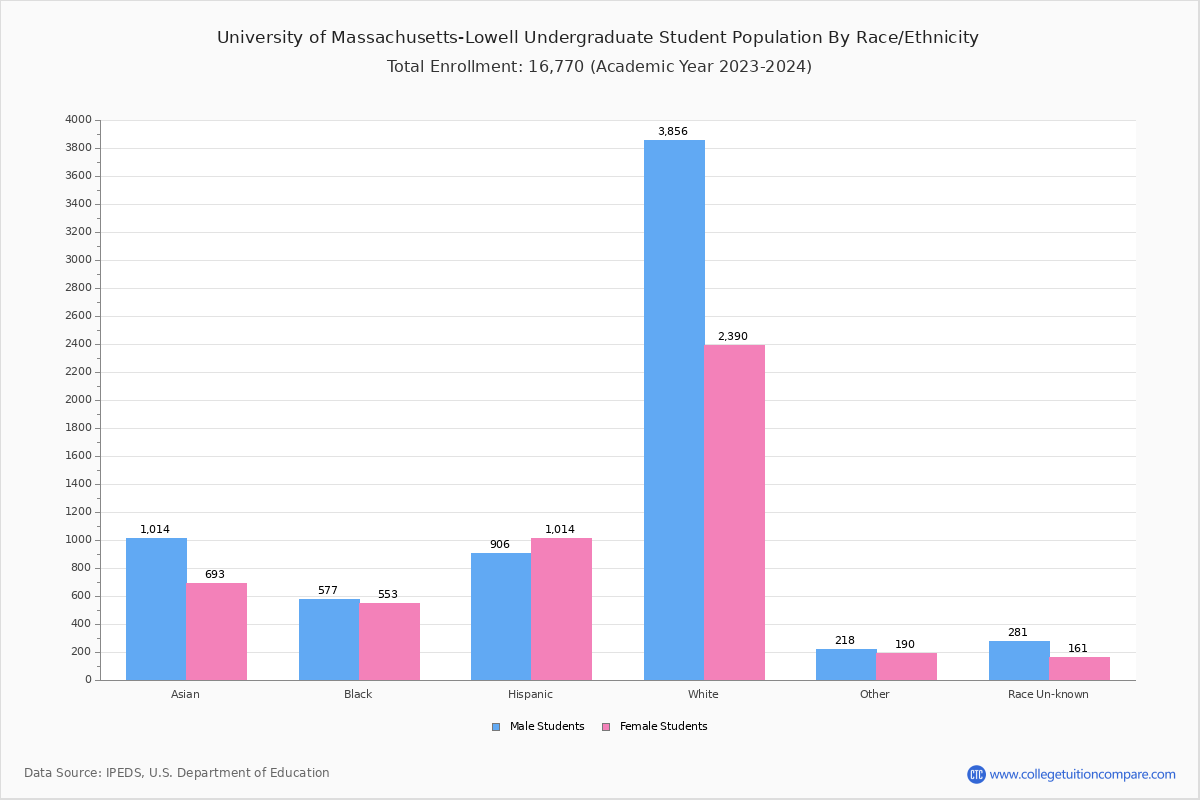
Student Distribution by Race/Ethnicity
By race/ethnicity, 8,871 White, 1,294 Black, and 2,109 Asian students out of a total of 17,153 are attending at University of Massachusetts-Lowell. Comprehensive enrollment statistic data by race/ethnicity is shown in the next chart (Academic year 2022-2023 data).
| Race | Total | Men | Women |
|---|---|---|---|
| American Indian or Native American | 16 | 6 | 10 |
| Asian | 2,109 | 1,184 | 925 |
| Black | 1,294 | 644 | 650 |
| Hispanic | 2,025 | 976 | 1,049 |
| Native Hawaiian or Other Pacific Islanders | 7 | 6 | 1 |
| White | 8,871 | 5,185 | 3,686 |
| Two or more races | 502 | 268 | 234 |
| Race Unknown | 1,113 | 706 | 407 |
| Race | Total | Men | Women |
|---|---|---|---|
| American Indian or Native American | 11 | 5 | 6 |
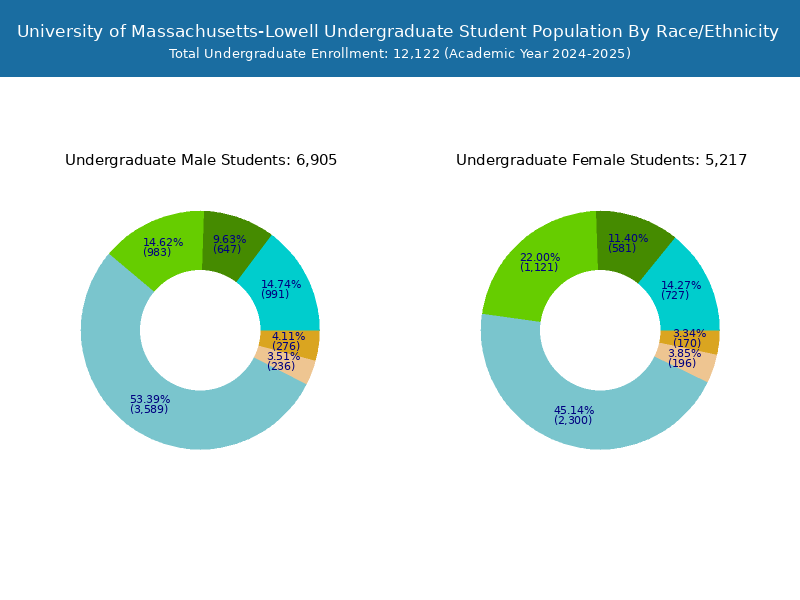
| Asian | 1,714 | 1,002 | 712 |
| Black | 1,022 | 512 | 510 |
| Hispanic | 1,747 | 842 | 905 |
| Native Hawaiian or Other Pacific Islanders | 7 | 6 | 1 |
| White | 6,666 | 4,070 | 2,596 |
| Two or more races | 409 | 224 | 185 |
| Race Unknown | 476 | 305 | 171 |
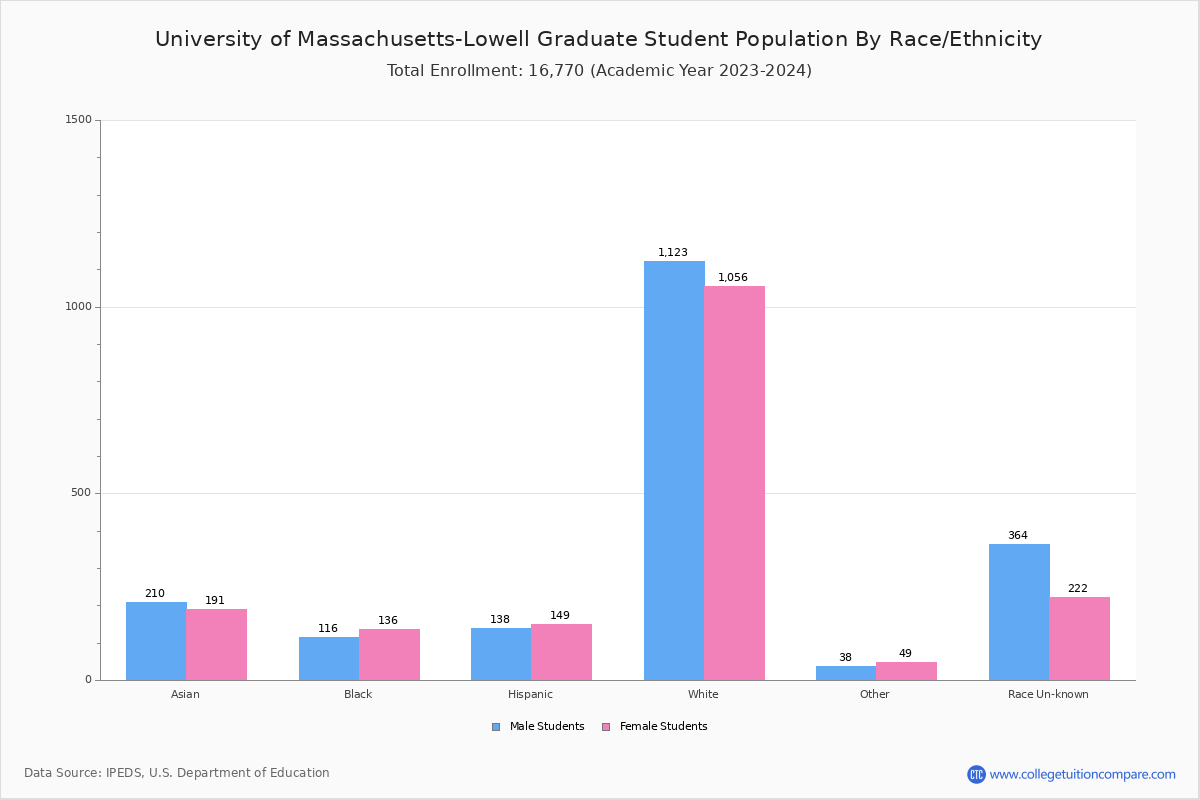
| Race | Total | Men | Women |
|---|---|---|---|
| American Indian or Native American | 3 | 2 | 1 |
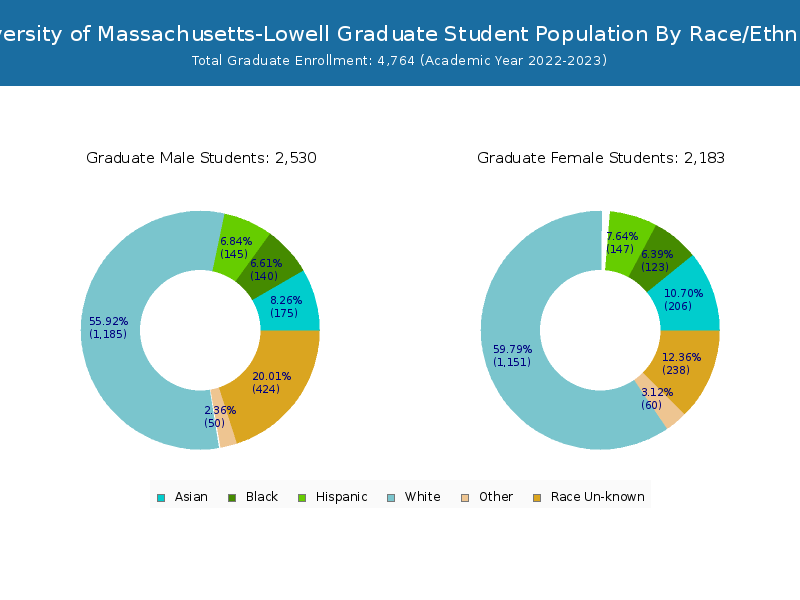
| Asian | 102 | 48 | 54 |
| Black | 92 | 52 | 40 |
| Hispanic | 185 | 74 | 111 |
| Native Hawaiian or Other Pacific Islanders | 0 | 0 | 0 |
| White | 566 | 294 | 272 |
| Two or more races | 46 | 27 | 19 |
| Race Unknown | 27 | 15 | 12 |
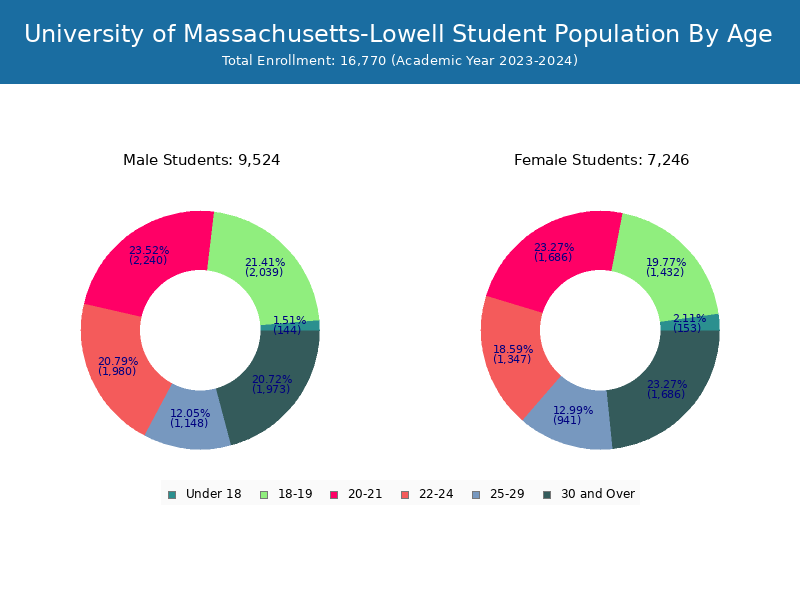
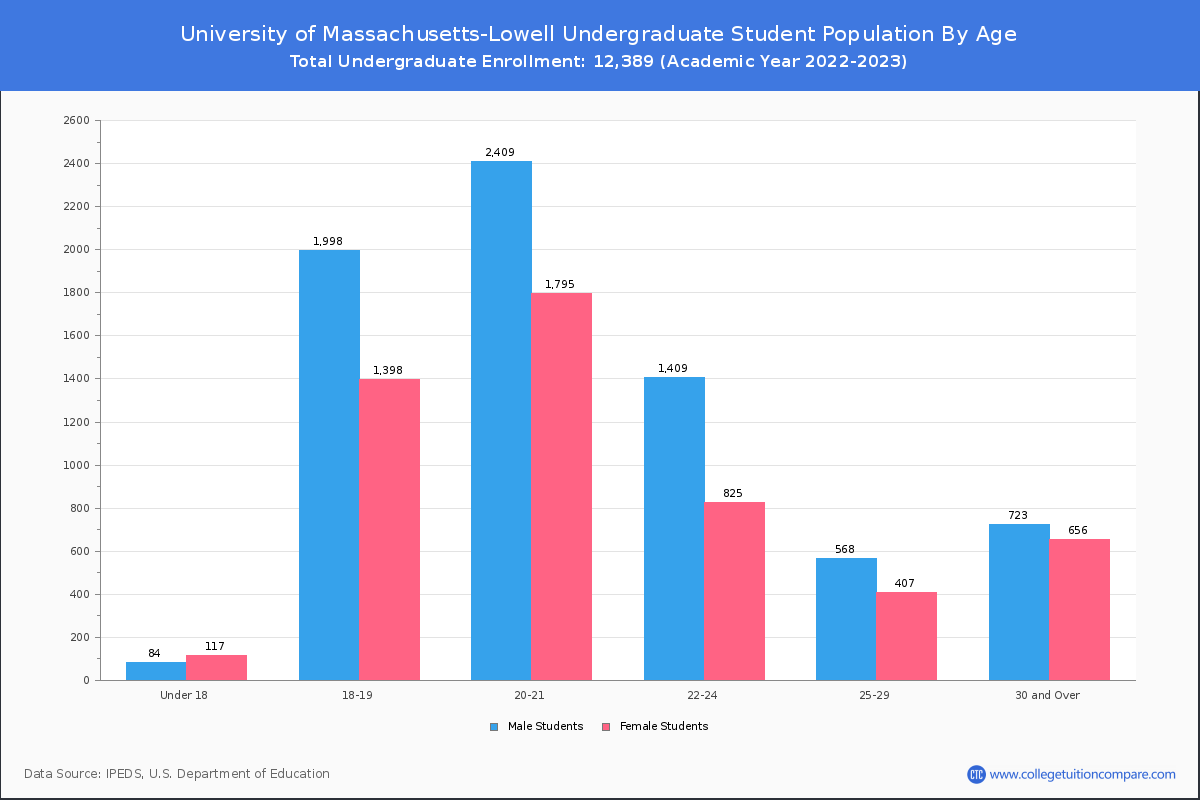
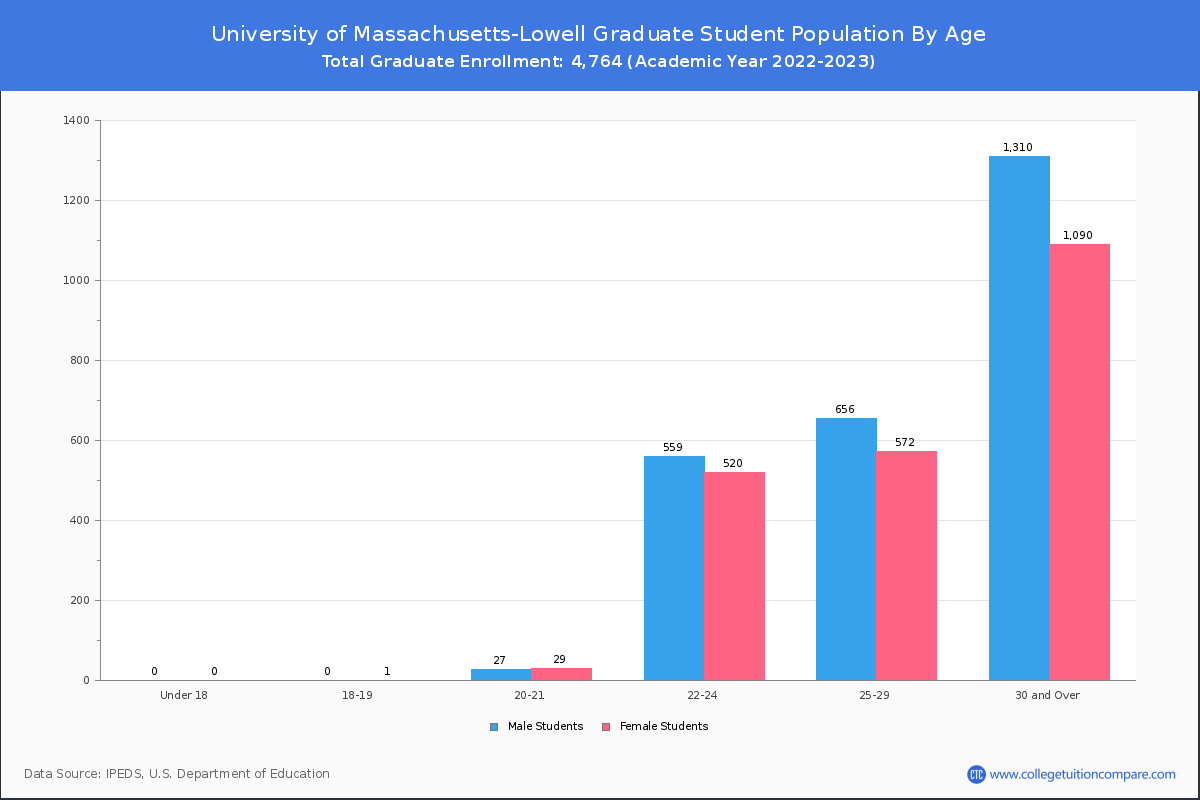
Student Age Distribution
By age, U of Massachusetts-Lowell has 201 students under 18 years old and 25 students over 65 years old. There are 11,171 students under 25 years old, and 5,982 students over 25 years old out of 17,153 total students.
In undergraduate programs, 201 students are younger than 18 and 12 students are older than 65. U of Massachusetts-Lowell has 10,035 undergraduate students aged under 25 and 2,354 students aged 25 and over.
It has 1,136 graduate students aged under 25 and 3,628 students aged 25 and over.
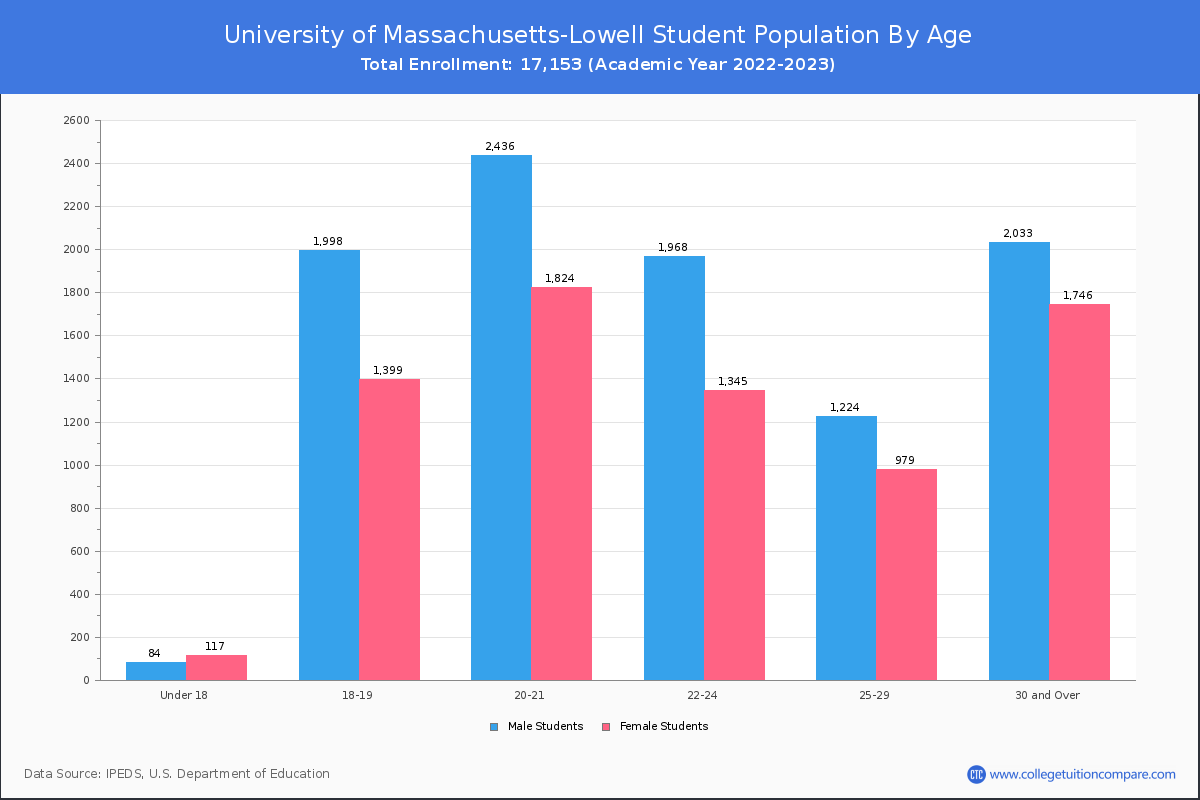
| Age | Total | Men | Women |
|---|---|---|---|
| Under 18 | 201 | 117 | 84 |
| 18-19 | 3,397 | 1,399 | 1,998 |
| 20-21 | 4,260 | 1,824 | 2,436 |
| 22-24 | 3,313 | 1,345 | 1,968 |
| 25-29 | 2,203 | 979 | 1,224 |
| 30-34 | 1,344 | 604 | 740 |
| 35-39 | 880 | 406 | 474 |
| 40-49 | 1,068 | 487 | 581 |
| 50-64 | 462 | 237 | 225 |
| Over 65 | 25 | 12 | 13 |
| Age | Total | Men | Women |
|---|---|---|---|
| Under 18 | 201 | 117 | 84 |
| 18-19 | 3,396 | 1,398 | 1,998 |
| 20-21 | 4,204 | 1,795 | 2,409 |
| 22-24 | 2,234 | 825 | 1,409 |
| 25-29 | 975 | 407 | 568 |
| 30-34 | 527 | 252 | 275 |
| 35-39 | 304 | 149 | 155 |
| 40-49 | 392 | 173 | 219 |
| 50-64 | 144 | 73 | 71 |
| Over 65 | 12 | 9 | 3 |
| Age | Total | Men | Women |
|---|
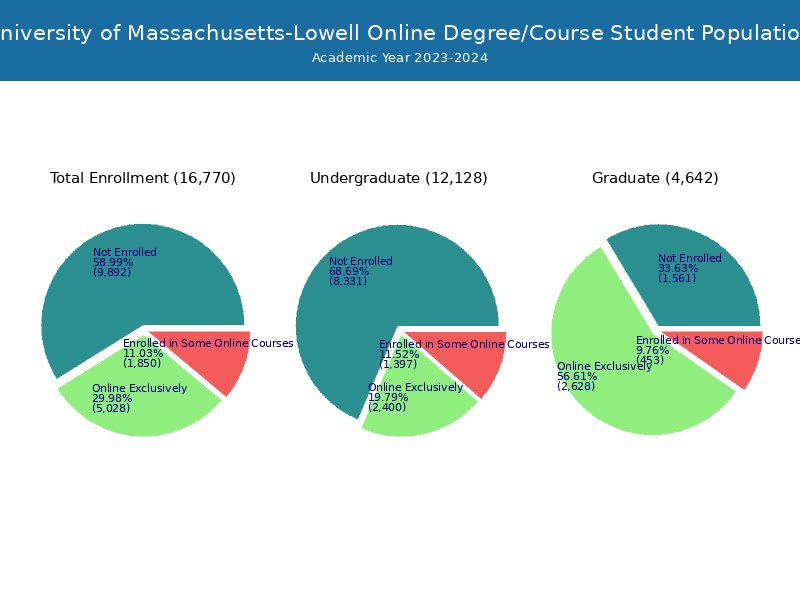
Online Student Enrollment
Distance learning, also called online education, is very attractive to students, especially who want to continue education and work in field. At University of Massachusetts-Lowell, 4,902 students are enrolled exclusively in online courses and 1,746 students are enrolled in some online courses.
3,181 students lived in Massachusetts or jurisdiction in which the school is located are enrolled exclusively in online courses and 1,721 students live in other State or outside of the United States.
| All Students | Enrolled Exclusively Online Courses | Enrolled in Some Online Courses | |
|---|---|---|---|
| All Students | 17,153 | 4,902 | 1,746 |
| Undergraduate | 12,389 | 2,234 | 1,261 |
| Graduate | 4,764 | 2,668 | 485 |
| Massachusetts Residents | Other States in U.S. | Outside of U.S. | |
|---|---|---|---|
| All Students | 3,181 | 1,195 | 526 |
| Undergraduate | 1,711 | 483 | 40 |
| Graduate | 1,470 | 712 | 486 |
Transfer-in Students (Undergraduate)
Among 12,389 enrolled in undergraduate programs, 1,056 students have transferred-in from other institutions. The percentage of transfer-in students is 8.52%.755 students have transferred in as full-time status and 301 students transferred in as part-time status.
| Number of Students | |
|---|---|
| Regular Full-time | 8,885 |
| Transfer-in Full-time | 755 |
| Regular Part-time | 2,448 |
| Transfer-in Part-time | 301 |