Student Population by Gender
Harvard University has a total of 30,631 enrolled students for the academic year 2022-2023. 9,368 students have enrolled in undergraduate programs and 21,263 students joined graduate programs.
By gender, 14,207 male and 16,424 female students (the male-female ratio is 46:54) are attending the school. The gender distribution is based on the 2022-2023 data.
| Total | Undergraduate | Graduate | |
|---|---|---|---|
| Total | 30,631 | 9,368 | 21,263 |
| Men | 14,207 | 4,498 | 9,709 |
| Women | 16,424 | 4,870 | 11,554 |
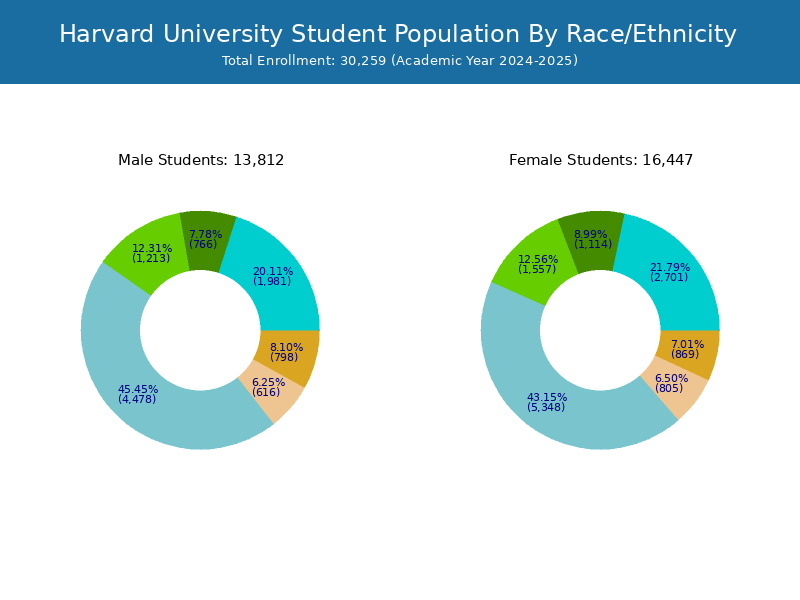
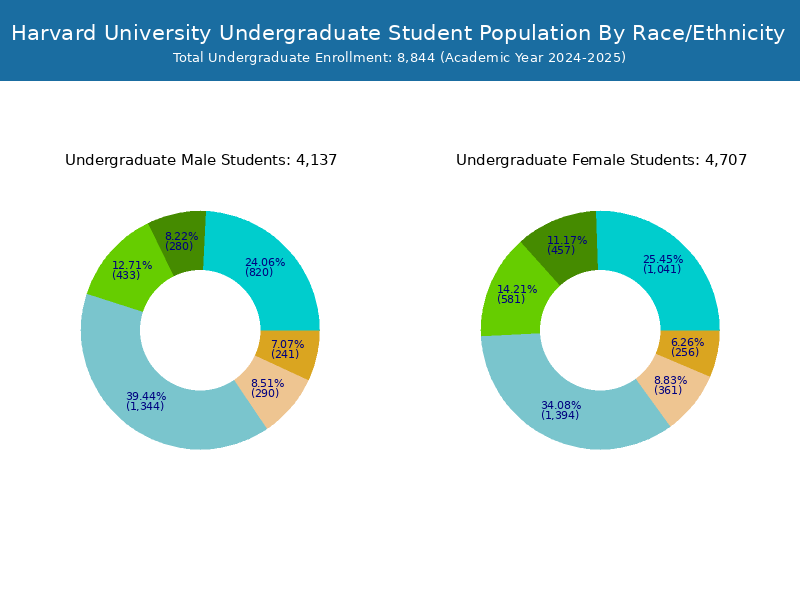
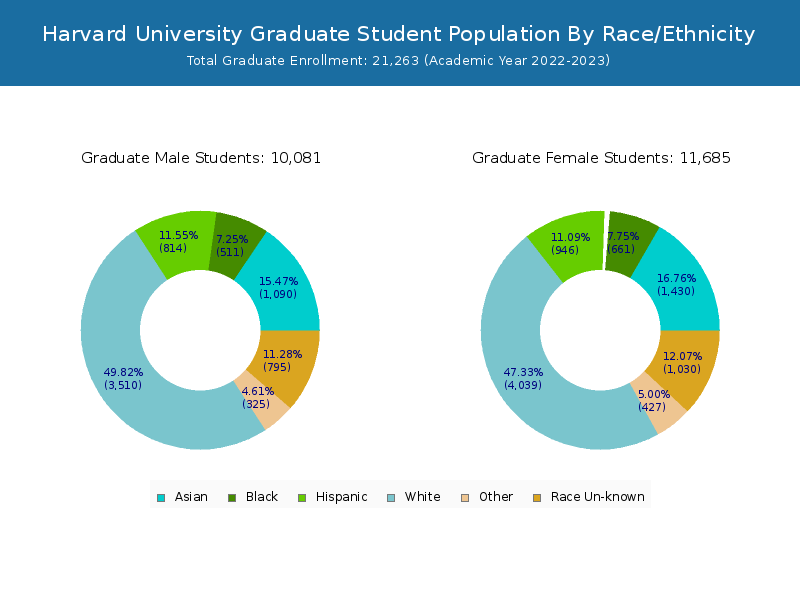
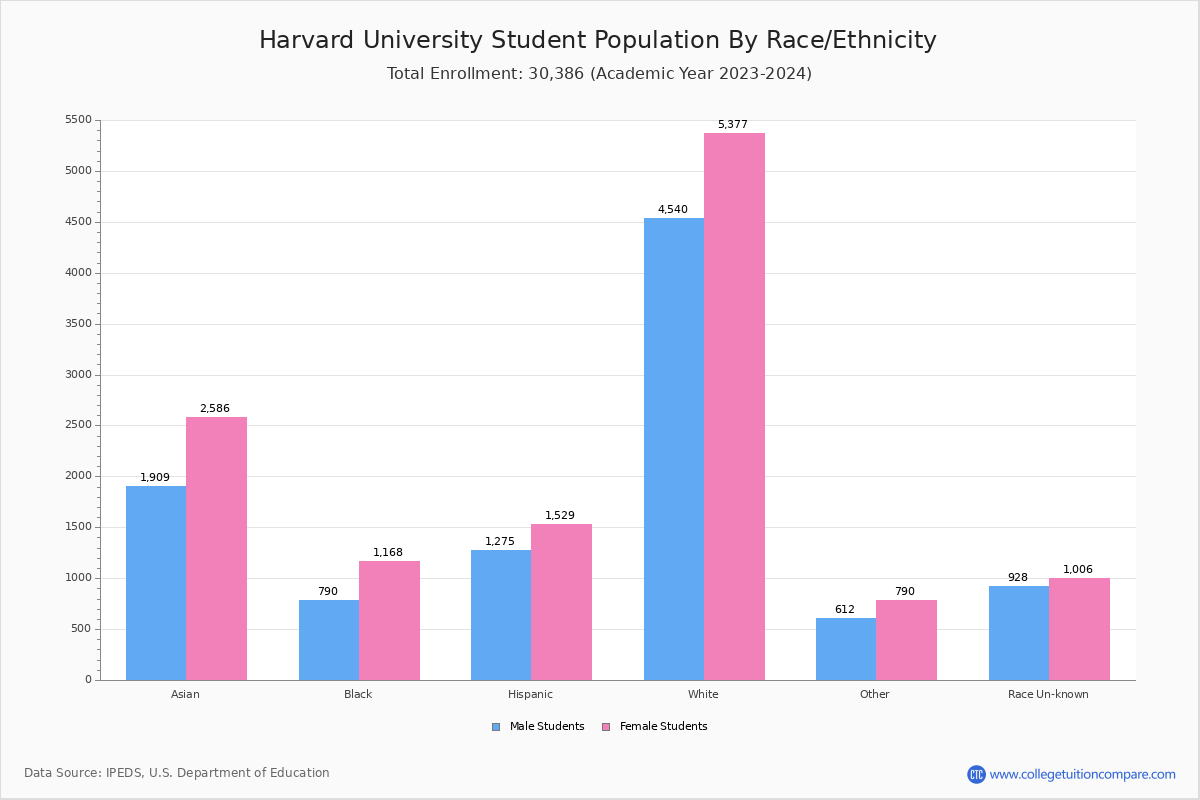
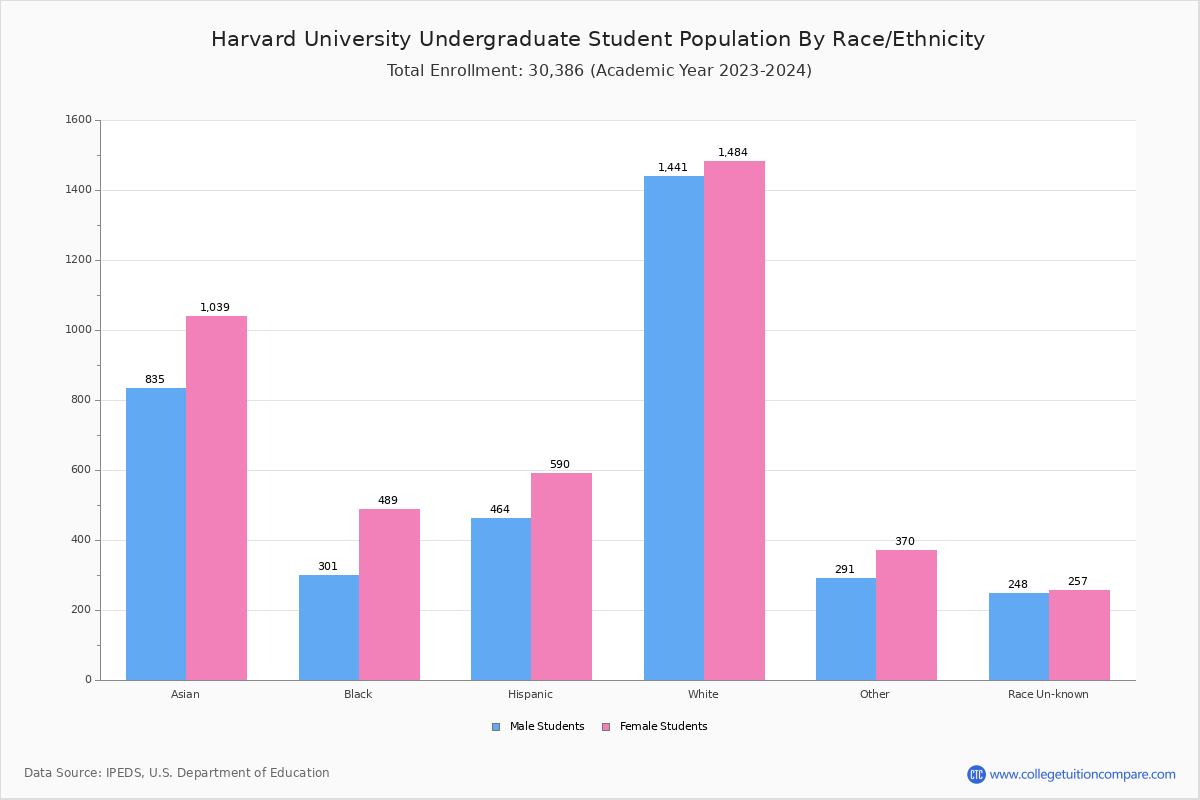
Student Distribution by Race/Ethnicity
By race/ethnicity, 10,182 White, 1,941 Black, and 4,414 Asian students out of a total of 30,631 are attending at Harvard University. Comprehensive enrollment statistic data by race/ethnicity is shown in the next chart (Academic year 2022-2023 data).

| Race | Total | Men | Women |
|---|---|---|---|
| American Indian or Native American | 59 | 26 | 33 |
| Asian | 4,414 | 1,868 | 2,546 |
| Black | 1,941 | 837 | 1,104 |
| Hispanic | 2,823 | 1,311 | 1,512 |
| Native Hawaiian or Other Pacific Islanders | 38 | 19 | 19 |
| White | 10,182 | 4,782 | 5,400 |
| Two or more races | 1,321 | 591 | 730 |
| Race Unknown | 2,151 | 967 | 1,184 |
| Race | Total | Men | Women |
|---|---|---|---|
| American Indian or Native American | 25 | 9 | 16 |
| Asian | 1,836 | 827 | 1,009 |
| Black | 781 | 326 | 455 |
| Hispanic | 1,064 | 485 | 579 |
| Native Hawaiian or Other Pacific Islanders | 14 | 8 | 6 |
| White | 3,120 | 1,558 | 1,562 |
| Two or more races | 638 | 285 | 353 |
| Race Unknown | 586 | 279 | 307 |
| Race | Total | Men | Women |
|---|---|---|---|
| American Indian or Native American | 0 | 0 | 0 |
| Asian | 1 | 0 | 1 |
| Black | 0 | 0 | 0 |
| Hispanic | 1 | 0 | 1 |
| Native Hawaiian or Other Pacific Islanders | 0 | 0 | 0 |
| White | 6 | 2 | 4 |
| Two or more races | 1 | 1 | 0 |
| Race Unknown | 0 | 0 | 0 |
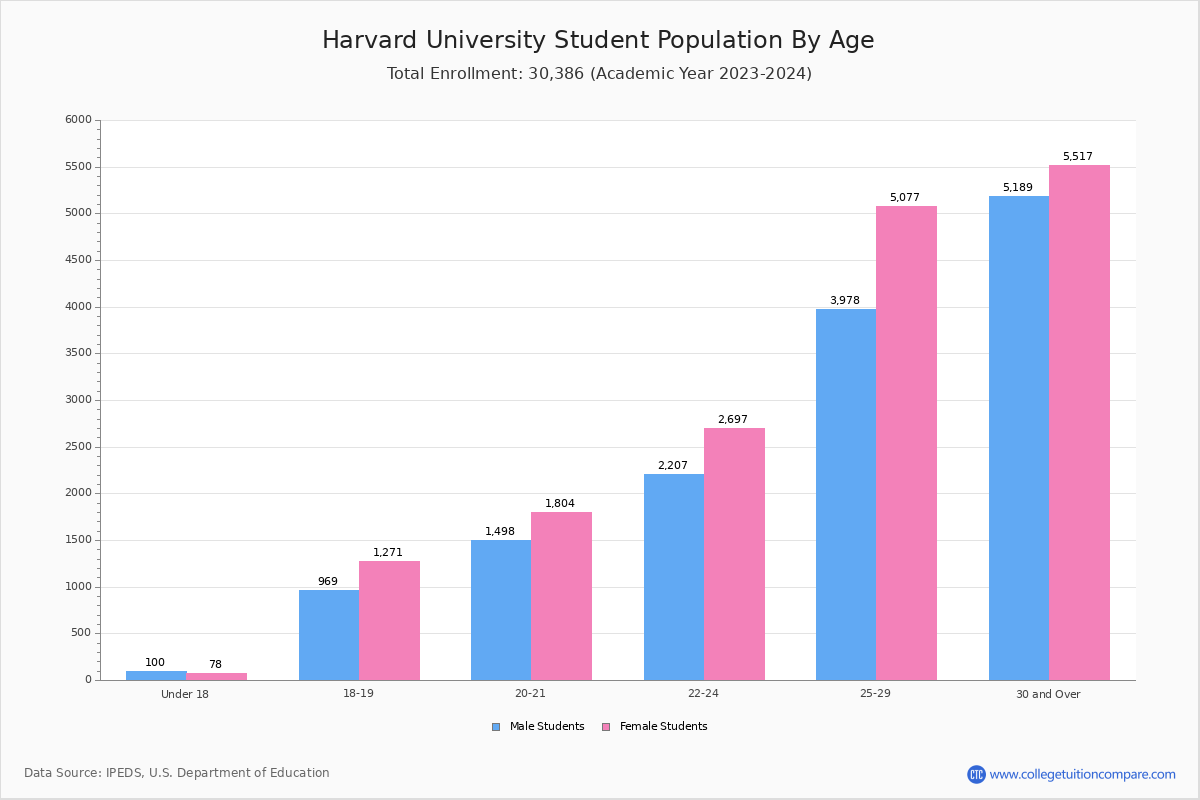
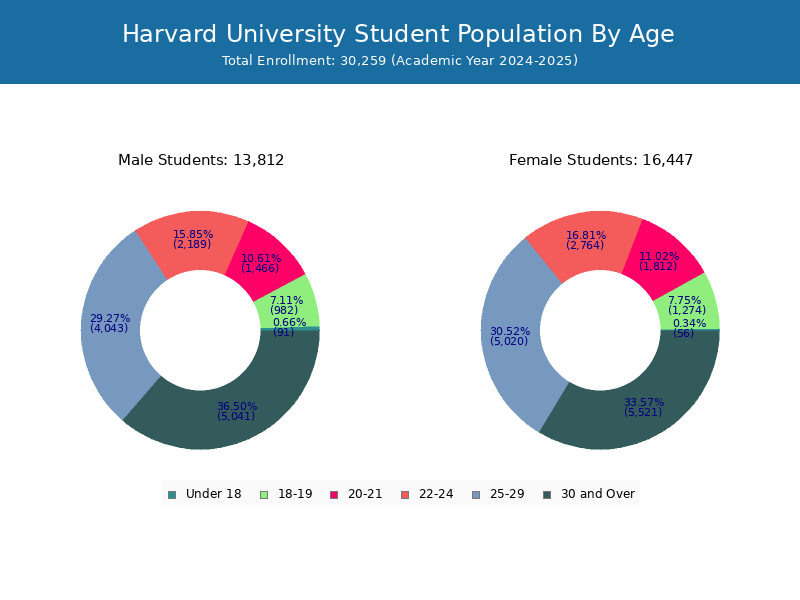
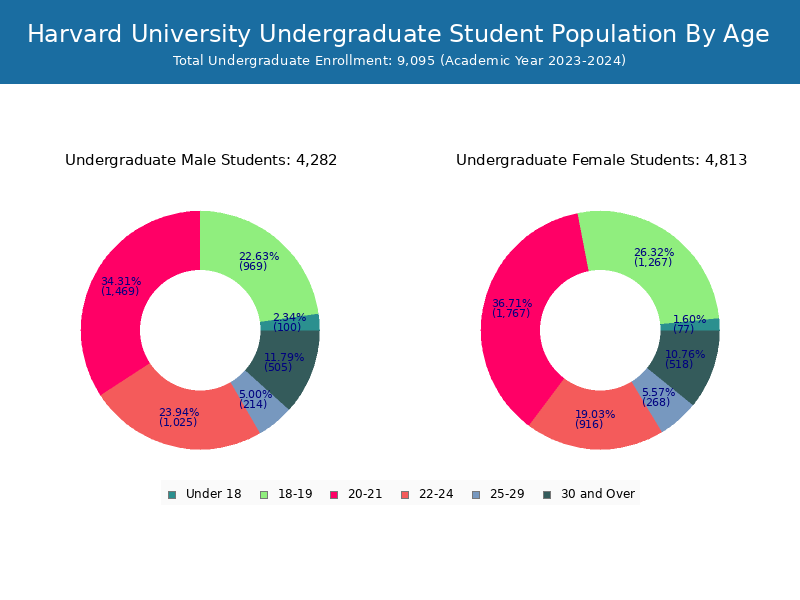
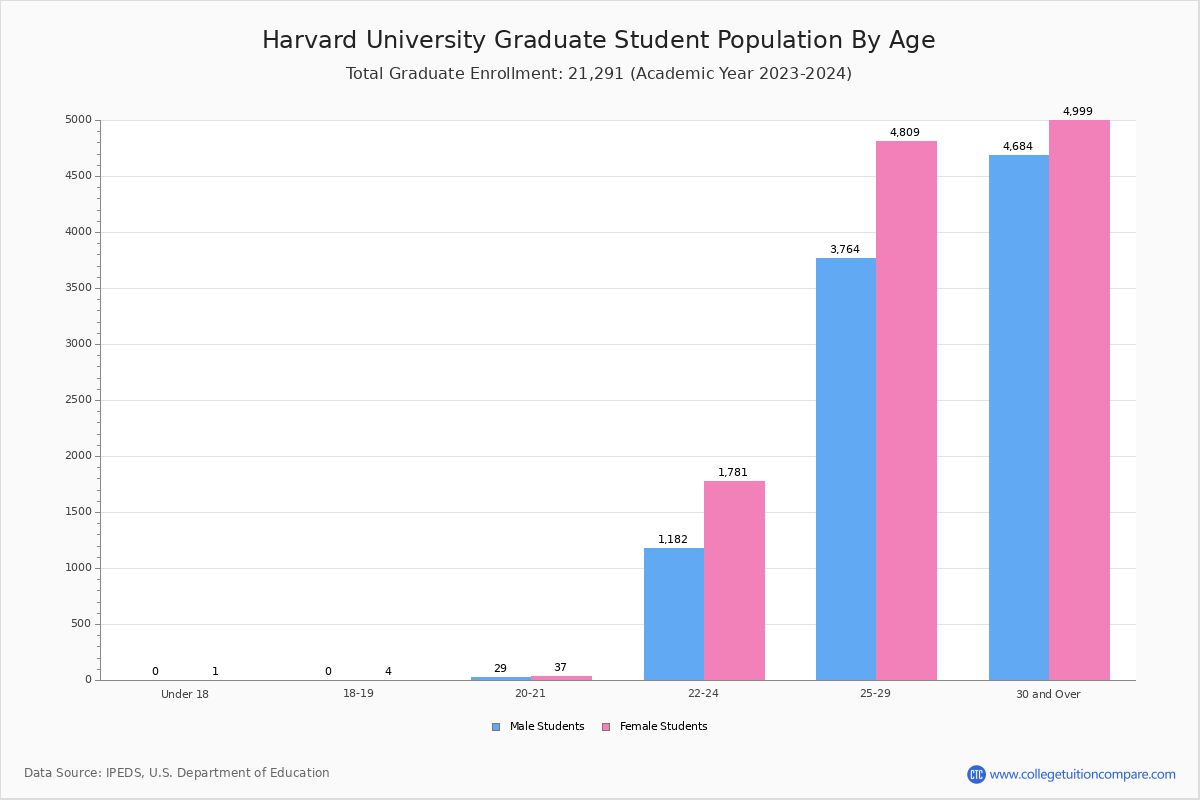
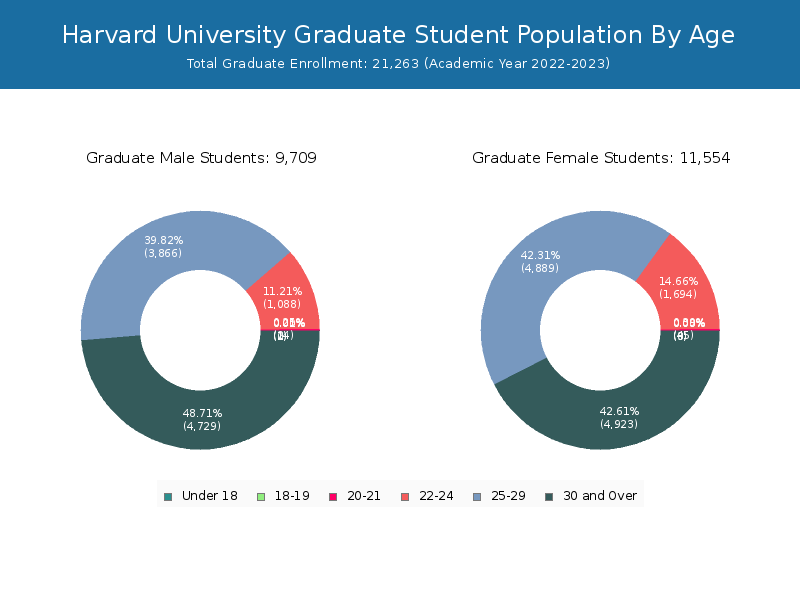
Student Age Distribution
By age, Harvard has 164 students under 18 years old and 148 students over 65 years old. There are 10,635 students under 25 years old, and 19,995 students over 25 years old out of 30,631 total students.
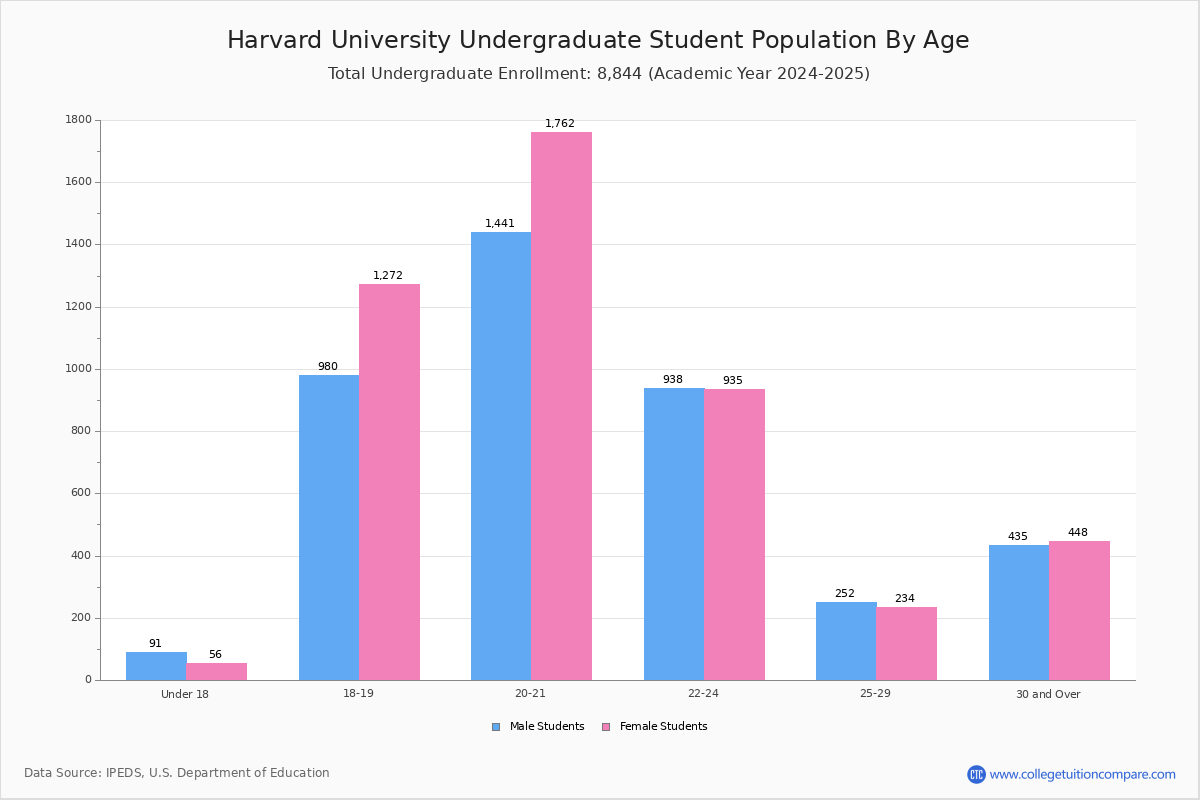
In undergraduate programs, 164 students are younger than 18 and 31 students are older than 65. Harvard has 7,780 undergraduate students aged under 25 and 1,588 students aged 25 and over.
It has 2,855 graduate students aged under 25 and 18,407 students aged 25 and over.
| Age | Total | Men | Women |
|---|---|---|---|
| Under 18 | 164 | 69 | 95 |
| 18-19 | 2,248 | 1,294 | 954 |
| 20-21 | 3,381 | 1,792 | 1,589 |
| 22-24 | 4,842 | 2,642 | 2,200 |
| 25-29 | 9,273 | 5,171 | 4,102 |
| 30-34 | 4,562 | 2,323 | 2,239 |
| 35-39 | 2,197 | 1,102 | 1,095 |
| 40-49 | 2,417 | 1,244 | 1,173 |
| 50-64 | 1,398 | 713 | 685 |
| Over 65 | 148 | 74 | 74 |
| Age | Total | Men | Women |
|---|---|---|---|
| Under 18 | 164 | 69 | 95 |
| 18-19 | 2,244 | 1,291 | 953 |
| 20-21 | 3,312 | 1,747 | 1,565 |
| 22-24 | 2,060 | 948 | 1,112 |
| 25-29 | 518 | 282 | 236 |
| 30-34 | 306 | 162 | 144 |
| 35-39 | 221 | 102 | 119 |
| 40-49 | 311 | 153 | 158 |
| 50-64 | 201 | 103 | 98 |
| Over 65 | 31 | 13 | 18 |
| Age | Total | Men | Women |
|---|
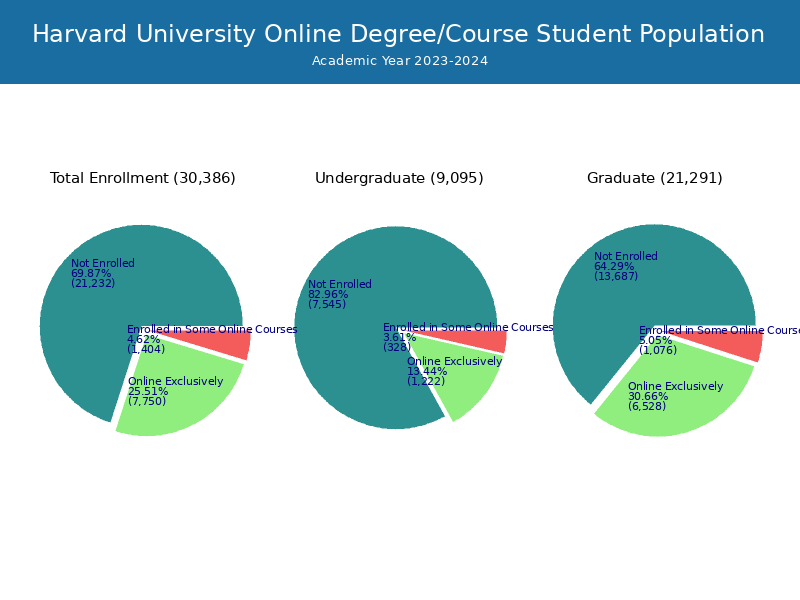
Online Student Enrollment
Distance learning, also called online education, is very attractive to students, especially who want to continue education and work in field. At Harvard University, 6,923 students are enrolled exclusively in online courses and 1,962 students are enrolled in some online courses.
1,598 students lived in Massachusetts or jurisdiction in which the school is located are enrolled exclusively in online courses and 5,325 students live in other State or outside of the United States.
| All Students | Enrolled Exclusively Online Courses | Enrolled in Some Online Courses | |
|---|---|---|---|
| All Students | 30,631 | 6,923 | 1,962 |
| Undergraduate | 9,368 | 1,312 | 407 |
| Graduate | 21,263 | 5,611 | 1,555 |
| Massachusetts Residents | Other States in U.S. | Outside of U.S. | |
|---|---|---|---|
| All Students | 1,598 | 4,211 | 1,114 |
| Undergraduate | 371 | 769 | 172 |
| Graduate | 1,227 | 3,442 | 942 |
Transfer-in Students (Undergraduate)
Among 9,368 enrolled in undergraduate programs, 12 students have transferred-in from other institutions. The percentage of transfer-in students is 0.13%.
| Number of Students | |
|---|---|
| Regular Full-time | 7,504 |
| Transfer-in Full-time | 12 |