Student Population by Gender
Bay Path University has a total of 2,465 enrolled students for the academic year 2022-2023. 1,315 students have enrolled in undergraduate programs and 1,150 students joined graduate programs.
By gender, 121 male and 2,344 female students (the male-female ratio is 5:95) are attending the school. The gender distribution is based on the 2022-2023 data.
| Total | Undergraduate | Graduate | |
|---|---|---|---|
| Total | 2,465 | 1,315 | 1,150 |
| Men | 121 | 7 | 114 |
| Women | 2,344 | 1,308 | 1,036 |
Student Distribution by Race/Ethnicity
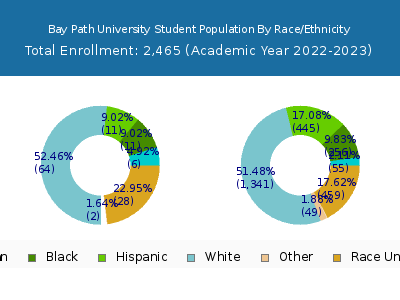
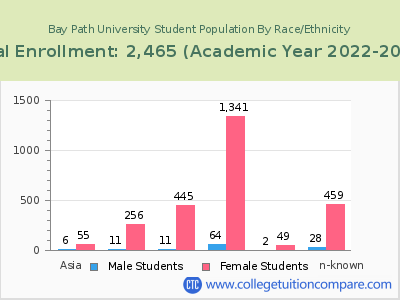
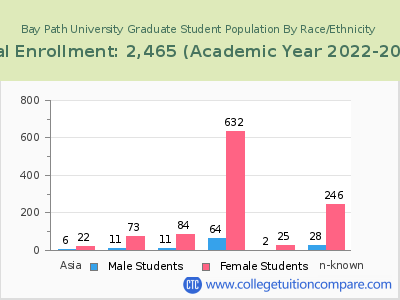
| Race | Total | Men | Women |
|---|---|---|---|
| American Indian or Native American | 2 | 1 | 1 |
| Asian | 59 | 9 | 50 |
| Black | 244 | 14 | 230 |
| Hispanic | 421 | 17 | 404 |
| Native Hawaiian or Other Pacific Islanders | 1 | 0 | 1 |
| White | 1,246 | 55 | 1,191 |
| Two or more races | 24 | 0 | 24 |
| Race Unknown | 461 | 25 | 436 |
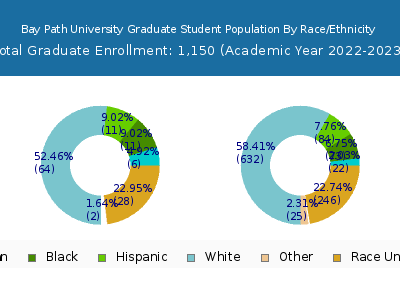
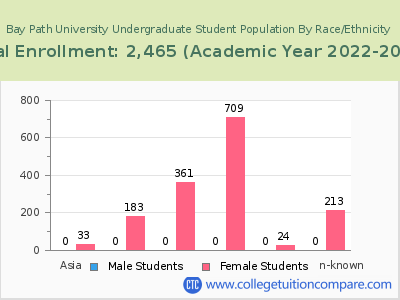
| Race | Total | Men | Women |
|---|---|---|---|
| American Indian or Native American | 1 | 0 | 1 |
| Asian | 30 | 0 | 30 |
| Black | 161 | 1 | 160 |
| Hispanic | 312 | 2 | 310 |
| Native Hawaiian or Other Pacific Islanders | 0 | 0 | 0 |
| White | 573 | 0 | 573 |
| Two or more races | 10 | 0 | 10 |
| Race Unknown | 223 | 4 | 219 |
| Race | Total | Men | Women |
|---|---|---|---|
| American Indian or Native American | 0 | 0 | 0 |
| Asian | 3 | 0 | 3 |
| Black | 20 | 0 | 20 |
| Hispanic | 34 | 0 | 34 |
| Native Hawaiian or Other Pacific Islanders | 0 | 0 | 0 |
| White | 55 | 0 | 55 |
| Two or more races | 0 | 0 | 0 |
| Race Unknown | 21 | 0 | 21 |
Student Age Distribution
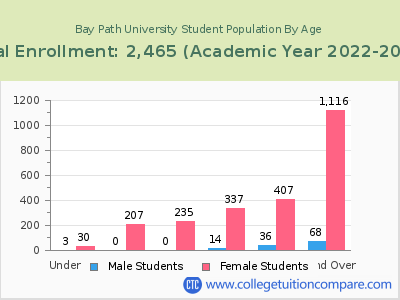
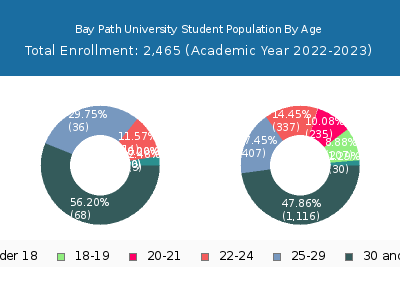
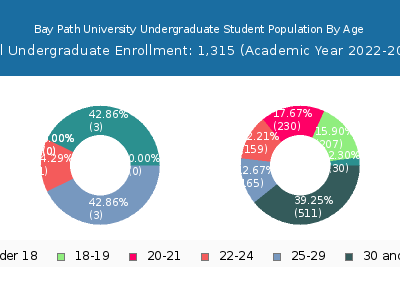
By age, Bay Path has 33 students under 18 years old and 8 students over 65 years old. There are 826 students under 25 years old, and 1,627 students over 25 years old out of 2,465 total students.
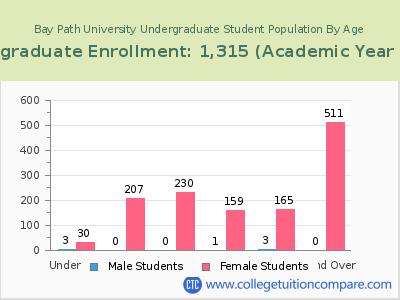
In undergraduate programs, 33 students are younger than 18 and 2 students are older than 65. Bay Path has 630 undergraduate students aged under 25 and 679 students aged 25 and over.
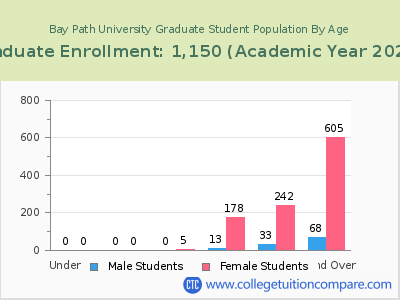
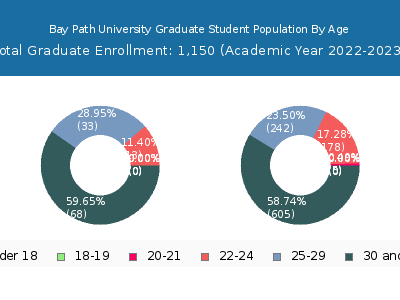
It has 196 graduate students aged under 25 and 948 students aged 25 and over.
| Age | Total | Men | Women |
|---|---|---|---|
| Under 18 | 33 | 30 | 3 |
| 18-19 | 207 | 207 | 0 |
| 20-21 | 235 | 235 | 0 |
| 22-24 | 351 | 337 | 14 |
| 25-29 | 443 | 407 | 36 |
| 30-34 | 375 | 354 | 21 |
| 35-39 | 252 | 242 | 10 |
| 40-49 | 326 | 308 | 18 |
| 50-64 | 223 | 207 | 16 |
| Over 65 | 8 | 5 | 3 |
| Age | Total | Men | Women |
|---|---|---|---|
| Under 18 | 33 | 30 | 3 |
| 18-19 | 207 | 207 | 0 |
| 20-21 | 230 | 230 | 0 |
| 22-24 | 160 | 159 | 1 |
| 25-29 | 168 | 165 | 3 |
| 30-34 | 167 | 167 | 0 |
| 35-39 | 129 | 129 | 0 |
| 40-49 | 123 | 123 | 0 |
| 50-64 | 90 | 90 | 0 |
| Over 65 | 2 | 2 | 0 |
| Age | Total | Men | Women |
|---|
Online Student Enrollment
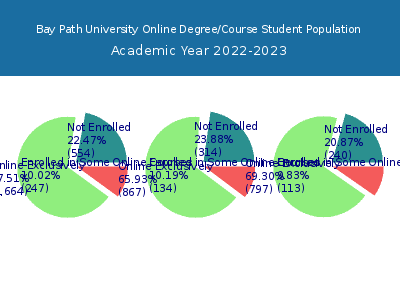
Distance learning, also called online education, is very attractive to students, especially who want to continue education and work in field. At Bay Path University, 1,664 students are enrolled exclusively in online courses and 247 students are enrolled in some online courses.
985 students lived in Massachusetts or jurisdiction in which the school is located are enrolled exclusively in online courses and 679 students live in other State or outside of the United States.
| All Students | Enrolled Exclusively Online Courses | Enrolled in Some Online Courses | |
|---|---|---|---|
| All Students | 2,465 | 1,664 | 247 |
| Undergraduate | 1,315 | 867 | 134 |
| Graduate | 1,150 | 797 | 113 |
| Massachusetts Residents | Other States in U.S. | Outside of U.S. | |
|---|---|---|---|
| All Students | 985 | 677 | 2 |
| Undergraduate | 453 | 412 | 2 |
| Graduate | 532 | 265 | 0 |
Transfer-in Students (Undergraduate)
Among 1,315 enrolled in undergraduate programs, 133 students have transferred-in from other institutions. The percentage of transfer-in students is 10.11%.74 students have transferred in as full-time status and 59 students transferred in as part-time status.
| Number of Students | |
|---|---|
| Regular Full-time | 741 |
| Transfer-in Full-time | 74 |
| Regular Part-time | 441 |
| Transfer-in Part-time | 59 |
