Student Population by Gender
Anna Maria College has a total of 1,436 enrolled students for the academic year 2022-2023. 1,069 students have enrolled in undergraduate programs and 367 students joined graduate programs.
By gender, 855 male and 581 female students (the male-female ratio is 60:40) are attending the school. The gender distribution is based on the 2022-2023 data.
| Total | Undergraduate | Graduate | |
|---|---|---|---|
| Total | 1,436 | 1,069 | 367 |
| Men | 855 | 618 | 237 |
| Women | 581 | 451 | 130 |
Student Distribution by Race/Ethnicity
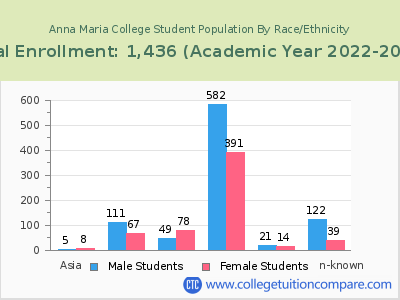
| Race | Total | Men | Women |
|---|---|---|---|
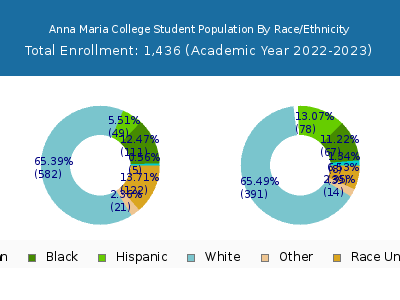
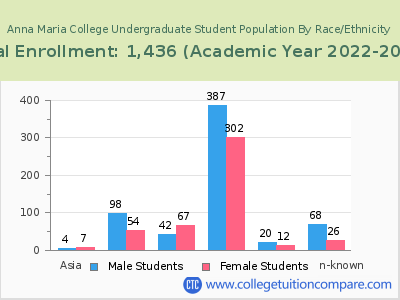
| American Indian or Native American | 8 | 2 | 6 |
| Asian | 18 | 10 | 8 |
| Black | 143 | 85 | 58 |
| Hispanic | 146 | 61 | 85 |
| Native Hawaiian or Other Pacific Islanders | 1 | 1 | 0 |
| White | 793 | 488 | 305 |
| Two or more races | 17 | 10 | 7 |
| Race Unknown | 227 | 148 | 79 |
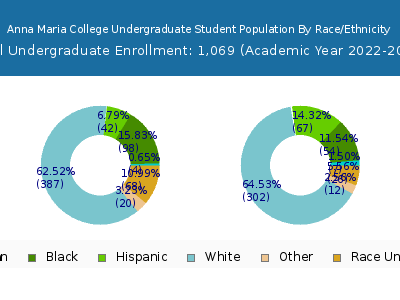
| Race | Total | Men | Women |
|---|---|---|---|
| American Indian or Native American | 7 | 1 | 6 |
| Asian | 14 | 7 | 7 |
| Black | 125 | 75 | 50 |
| Hispanic | 121 | 54 | 67 |
| Native Hawaiian or Other Pacific Islanders | 1 | 1 | 0 |
| White | 543 | 324 | 219 |
| Two or more races | 16 | 10 | 6 |
| Race Unknown | 169 | 104 | 65 |
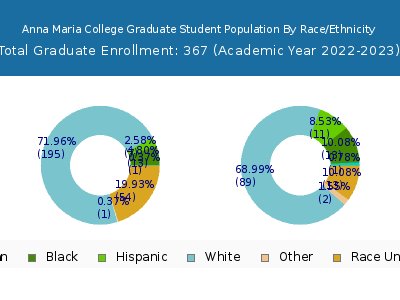
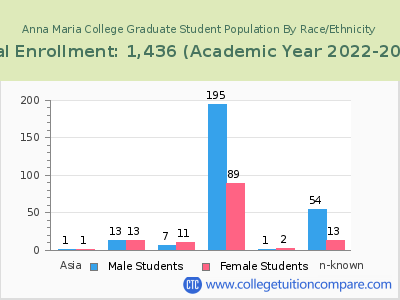
| Race | Total | Men | Women |
|---|---|---|---|
| American Indian or Native American | 0 | 0 | 0 |
| Asian | 3 | 2 | 1 |
| Black | 10 | 4 | 6 |
| Hispanic | 17 | 11 | 6 |
| Native Hawaiian or Other Pacific Islanders | 0 | 0 | 0 |
| White | 68 | 46 | 22 |
| Two or more races | 0 | 0 | 0 |
| Race Unknown | 21 | 14 | 7 |
Student Age Distribution
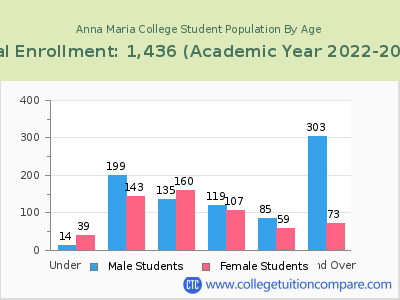
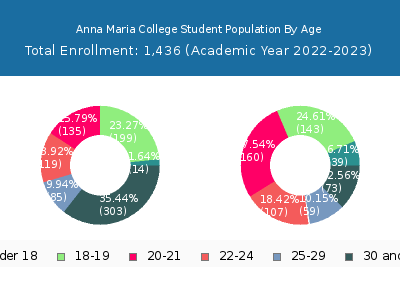
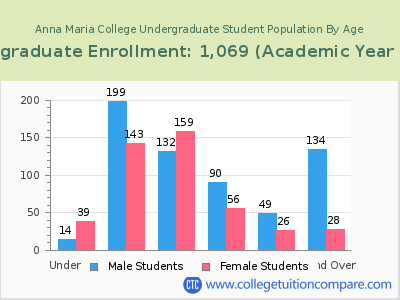
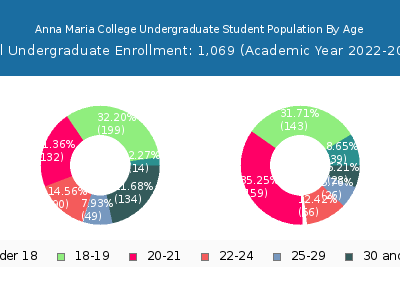
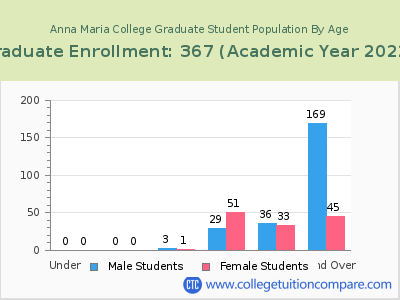
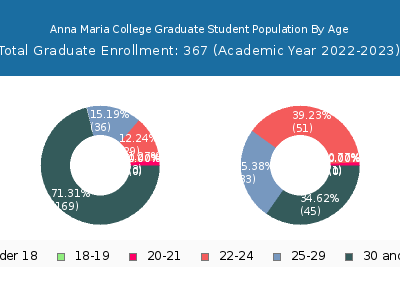
By age, Anna Maria has 53 students under 18 years old and 2 students over 65 years old. There are 916 students under 25 years old, and 520 students over 25 years old out of 1,436 total students.
In undergraduate programs, 53 students are younger than 18 and 1 students are older than 65. Anna Maria has 832 undergraduate students aged under 25 and 237 students aged 25 and over.
It has 84 graduate students aged under 25 and 283 students aged 25 and over.
| Age | Total | Men | Women |
|---|---|---|---|
| Under 18 | 53 | 39 | 14 |
| 18-19 | 342 | 143 | 199 |
| 20-21 | 295 | 160 | 135 |
| 22-24 | 226 | 107 | 119 |
| 25-29 | 144 | 59 | 85 |
| 30-34 | 111 | 25 | 86 |
| 35-39 | 86 | 14 | 72 |
| 40-49 | 122 | 20 | 102 |
| 50-64 | 55 | 12 | 43 |
| Over 65 | 2 | 2 | 0 |
| Age | Total | Men | Women |
|---|---|---|---|
| Under 18 | 53 | 39 | 14 |
| 18-19 | 342 | 143 | 199 |
| 20-21 | 291 | 159 | 132 |
| 22-24 | 146 | 56 | 90 |
| 25-29 | 75 | 26 | 49 |
| 30-34 | 52 | 10 | 42 |
| 35-39 | 44 | 7 | 37 |
| 40-49 | 42 | 5 | 37 |
| 50-64 | 23 | 5 | 18 |
| Over 65 | 1 | 1 | 0 |
| Age | Total | Men | Women |
|---|
Online Student Enrollment
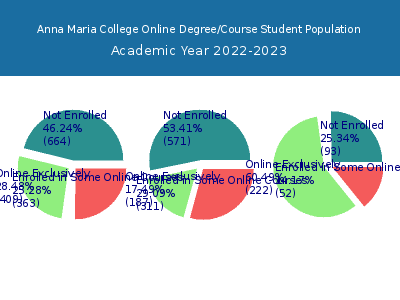
Distance learning, also called online education, is very attractive to students, especially who want to continue education and work in field. At Anna Maria College, 409 students are enrolled exclusively in online courses and 363 students are enrolled in some online courses.
338 students lived in Massachusetts or jurisdiction in which the school is located are enrolled exclusively in online courses and 71 students live in other State or outside of the United States.
| All Students | Enrolled Exclusively Online Courses | Enrolled in Some Online Courses | |
|---|---|---|---|
| All Students | 1,436 | 409 | 363 |
| Undergraduate | 1,069 | 187 | 311 |
| Graduate | 367 | 222 | 52 |
| Massachusetts Residents | Other States in U.S. | Outside of U.S. | |
|---|---|---|---|
| All Students | 338 | 71 | 0 |
| Undergraduate | 155 | 32 | 0 |
| Graduate | 183 | 39 | 0 |
Transfer-in Students (Undergraduate)
Among 1,069 enrolled in undergraduate programs, 123 students have transferred-in from other institutions. The percentage of transfer-in students is 11.51%.78 students have transferred in as full-time status and 45 students transferred in as part-time status.
| Number of Students | |
|---|---|
| Regular Full-time | 751 |
| Transfer-in Full-time | 78 |
| Regular Part-time | 195 |
| Transfer-in Part-time | 45 |
