Student Population by Gender
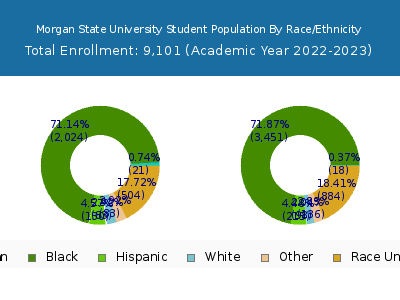
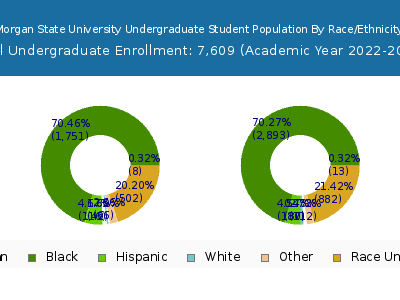
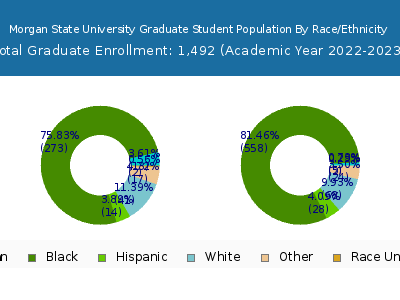
Morgan State University has a total of 9,101 enrolled students for the academic year 2022-2023. 7,609 students have enrolled in undergraduate programs and 1,492 students joined graduate programs.
By gender, 3,483 male and 5,618 female students (the male-female ratio is 38:62) are attending the school. The gender distribution is based on the 2022-2023 data.
| Total | Undergraduate | Graduate | |
|---|---|---|---|
| Total | 9,101 | 7,609 | 1,492 |
| Men | 3,483 | 2,883 | 600 |
| Women | 5,618 | 4,726 | 892 |
Student Distribution by Race/Ethnicity
| Race | Total | Men | Women |
|---|---|---|---|
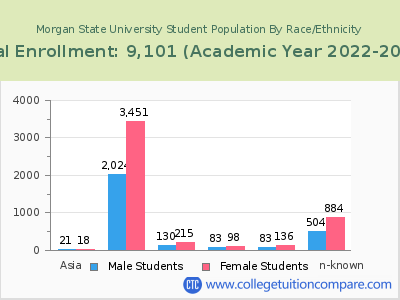
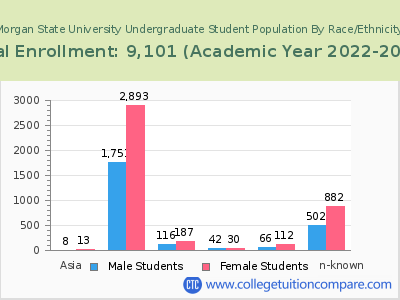
| American Indian or Native American | 12 | 5 | 7 |
| Asian | 39 | 20 | 19 |
| Black | 6,264 | 2,330 | 3,934 |
| Hispanic | 406 | 148 | 258 |
| Native Hawaiian or Other Pacific Islanders | 3 | 2 | 1 |
| White | 164 | 74 | 90 |
| Two or more races | 251 | 84 | 167 |
| Race Unknown | 985 | 340 | 645 |
| Race | Total | Men | Women |
|---|---|---|---|
| American Indian or Native American | 10 | 4 | 6 |
| Asian | 20 | 8 | 12 |
| Black | 5,411 | 2,054 | 3,357 |
| Hispanic | 366 | 133 | 233 |
| Native Hawaiian or Other Pacific Islanders | 3 | 2 | 1 |
| White | 64 | 34 | 30 |
| Two or more races | 211 | 72 | 139 |
| Race Unknown | 983 | 338 | 645 |
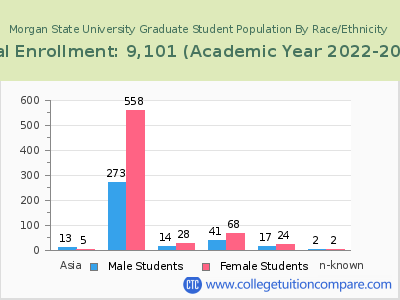
| Race | Total | Men | Women |
|---|---|---|---|
| American Indian or Native American | 1 | 0 | 1 |
| Asian | 1 | 1 | 0 |
| Black | 312 | 118 | 194 |
| Hispanic | 21 | 10 | 11 |
| Native Hawaiian or Other Pacific Islanders | 0 | 0 | 0 |
| White | 11 | 4 | 7 |
| Two or more races | 14 | 4 | 10 |
| Race Unknown | 2 | 0 | 2 |
Student Age Distribution
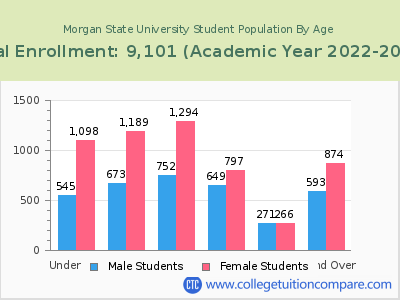
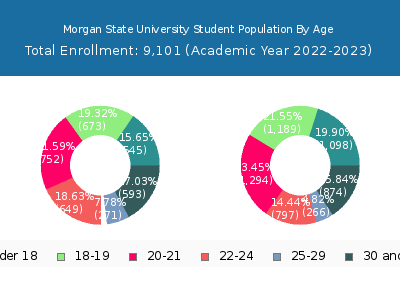
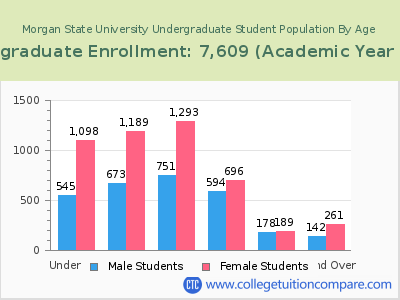
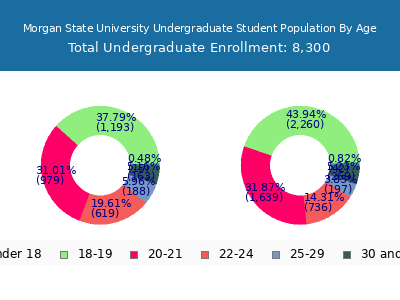
By age, Morgan State has 1,643 students under 18 years old and 39 students over 65 years old. There are 6,997 students under 25 years old, and 2,004 students over 25 years old out of 9,101 total students.
In undergraduate programs, 1,643 students are younger than 18 and 8 students are older than 65. Morgan State has 6,839 undergraduate students aged under 25 and 770 students aged 25 and over.
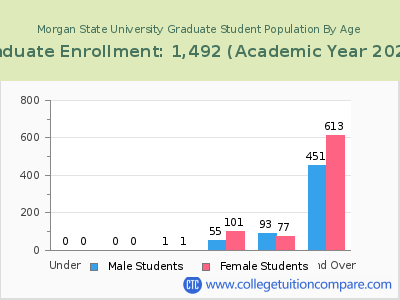
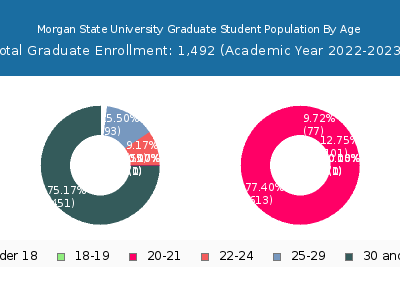
It has 158 graduate students aged under 25 and 1,234 students aged 25 and over.
| Age | Total | Men | Women |
|---|---|---|---|
| Under 18 | 1,643 | 1,098 | 545 |
| 18-19 | 1,862 | 1,189 | 673 |
| 20-21 | 2,046 | 1,294 | 752 |
| 22-24 | 1,446 | 797 | 649 |
| 25-29 | 537 | 266 | 271 |
| 30-34 | 442 | 268 | 174 |
| 35-39 | 334 | 195 | 139 |
| 40-49 | 411 | 236 | 175 |
| 50-64 | 241 | 151 | 90 |
| Over 65 | 39 | 24 | 15 |
| Age | Total | Men | Women |
|---|---|---|---|
| Under 18 | 1,643 | 1,098 | 545 |
| 18-19 | 1,862 | 1,189 | 673 |
| 20-21 | 2,044 | 1,293 | 751 |
| 22-24 | 1,290 | 696 | 594 |
| 25-29 | 367 | 189 | 178 |
| 30-34 | 156 | 95 | 61 |
| 35-39 | 95 | 65 | 30 |
| 40-49 | 86 | 56 | 30 |
| 50-64 | 58 | 41 | 17 |
| Over 65 | 8 | 4 | 4 |
| Age | Total | Men | Women |
|---|
Online Student Enrollment
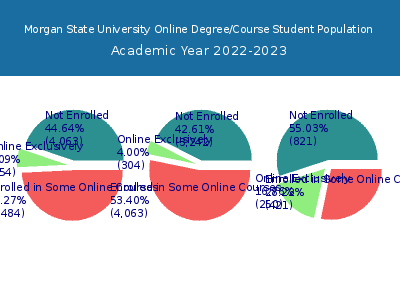
Distance learning, also called online education, is very attractive to students, especially who want to continue education and work in field. At Morgan State University, 554 students are enrolled exclusively in online courses and 4,484 students are enrolled in some online courses.
329 students lived in Maryland or jurisdiction in which the school is located are enrolled exclusively in online courses and 225 students live in other State or outside of the United States.
| All Students | Enrolled Exclusively Online Courses | Enrolled in Some Online Courses | |
|---|---|---|---|
| All Students | 9,101 | 554 | 4,484 |
| Undergraduate | 7,609 | 304 | 4,063 |
| Graduate | 1,492 | 250 | 421 |
| Maryland Residents | Other States in U.S. | Outside of U.S. | |
|---|---|---|---|
| All Students | 329 | 192 | 33 |
| Undergraduate | 185 | 115 | 4 |
| Graduate | 144 | 77 | 29 |
Transfer-in Students (Undergraduate)
Among 7,609 enrolled in undergraduate programs, 415 students have transferred-in from other institutions. The percentage of transfer-in students is 5.45%.342 students have transferred in as full-time status and 73 students transferred in as part-time status.
| Number of Students | |
|---|---|
| Regular Full-time | 6,667 |
| Transfer-in Full-time | 342 |
| Regular Part-time | 527 |
| Transfer-in Part-time | 73 |
