Student Population by Gender
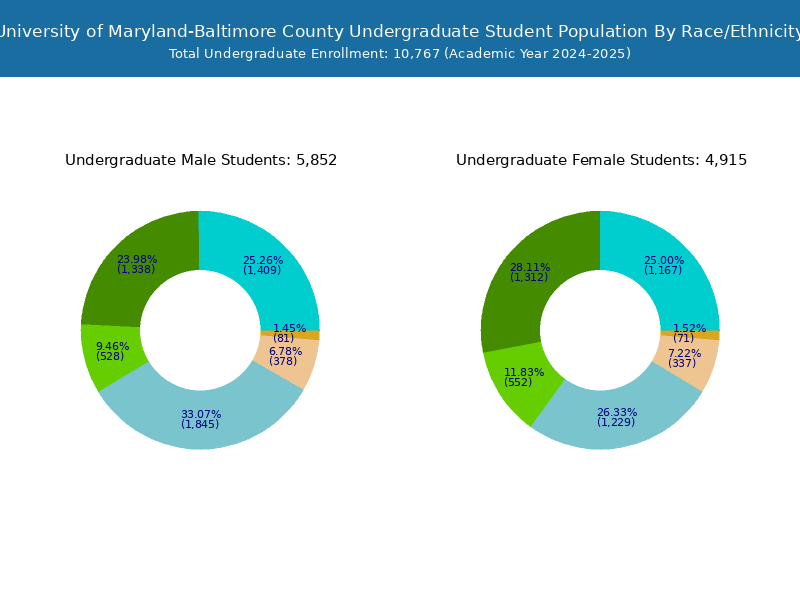
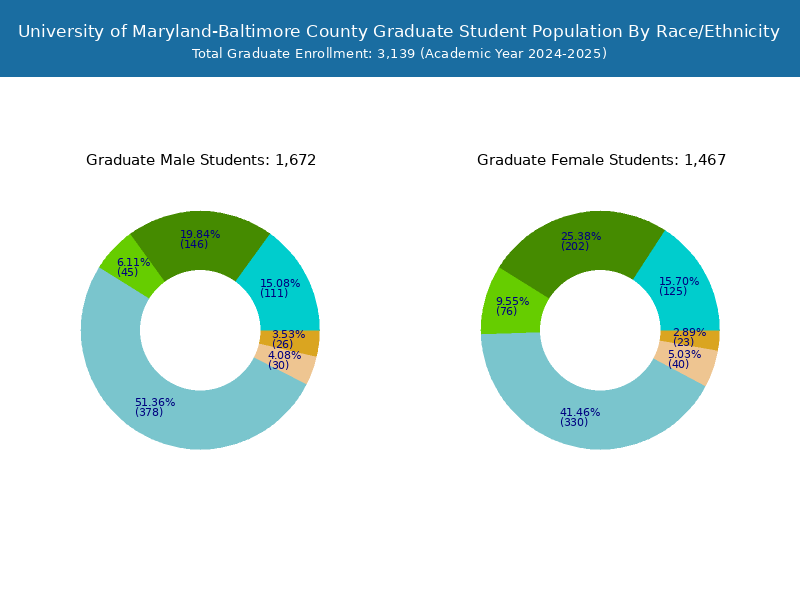
University of Maryland-Baltimore County has a total of 13,991 enrolled students for the academic year 2022-2023. 10,625 students have enrolled in undergraduate programs and 3,366 students joined graduate programs.
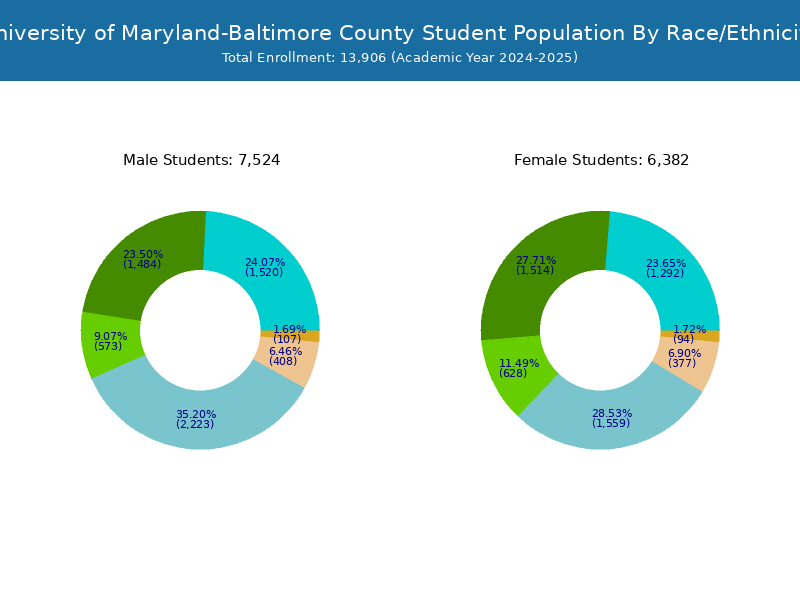
By gender, 7,454 male and 6,537 female students (the male-female ratio is 53:47) are attending the school. The gender distribution is based on the 2022-2023 data.
| Total | Undergraduate | Graduate | |
|---|---|---|---|
| Total | 13,991 | 10,625 | 3,366 |
| Men | 7,454 | 5,684 | 1,770 |
| Women | 6,537 | 4,941 | 1,596 |
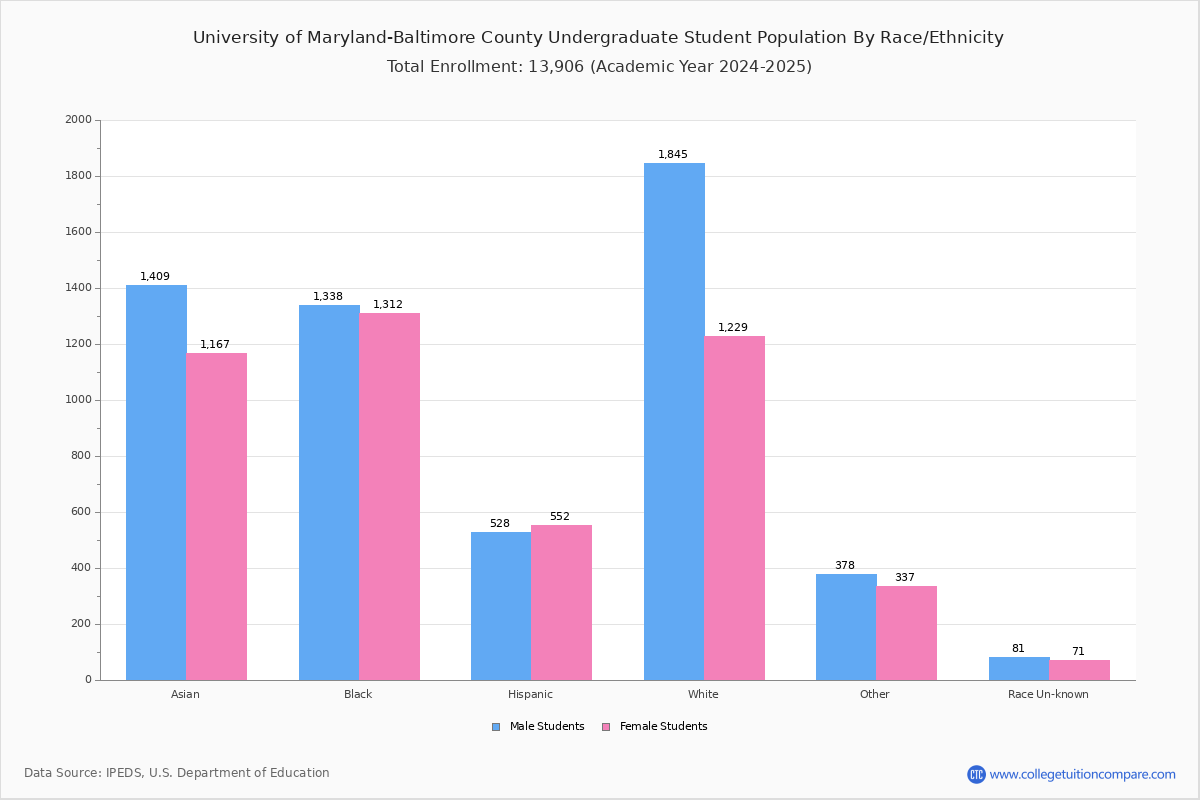
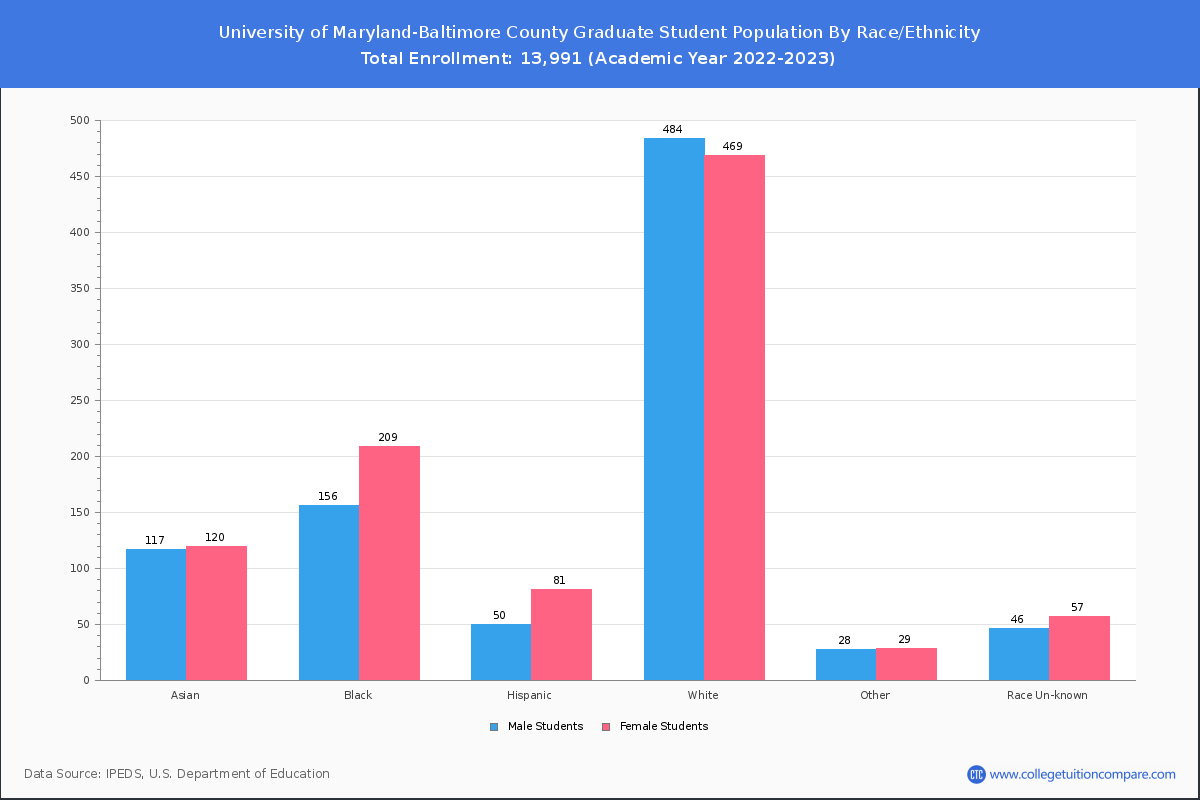
Student Distribution by Race/Ethnicity
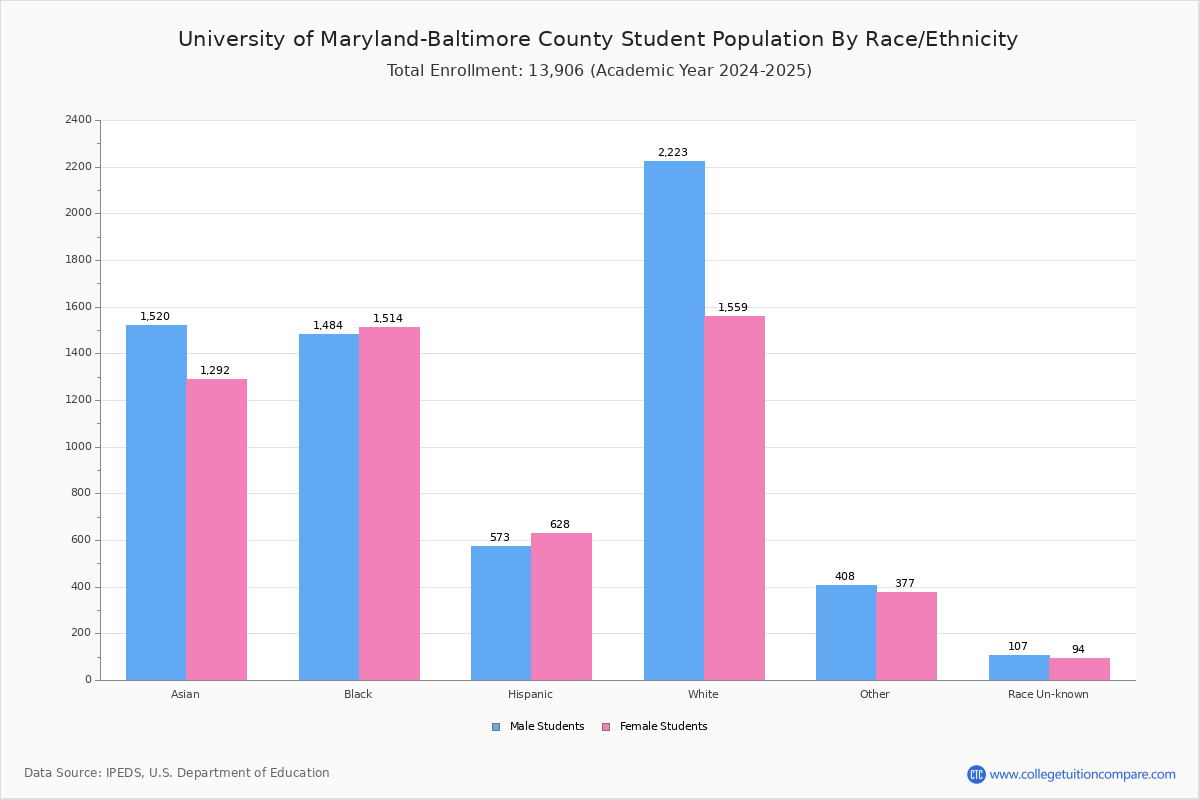
By race/ethnicity, 4,282 White, 2,744 Black, and 2,699 Asian students out of a total of 13,991 are attending at University of Maryland-Baltimore County. Comprehensive enrollment statistic data by race/ethnicity is shown in the next chart (Academic year 2022-2023 data).
| Race | Total | Men | Women |
|---|---|---|---|
| American Indian or Native American | 11 | 5 | 6 |
| Asian | 2,699 | 1,427 | 1,272 |
| Black | 2,744 | 1,292 | 1,452 |
| Hispanic | 1,111 | 492 | 619 |
| Native Hawaiian or Other Pacific Islanders | 8 | 4 | 4 |
| White | 4,282 | 2,522 | 1,760 |
| Two or more races | 678 | 334 | 344 |
| Race Unknown | 227 | 123 | 104 |
| Race | Total | Men | Women |
|---|---|---|---|
| American Indian or Native American | 10 | 4 | 6 |
| Asian | 2,474 | 1,321 | 1,153 |
| Black | 2,427 | 1,169 | 1,258 |
| Hispanic | 989 | 448 | 541 |
| Native Hawaiian or Other Pacific Islanders | 6 | 2 | 4 |
| White | 3,447 | 2,103 | 1,344 |
| Two or more races | 622 | 308 | 314 |
| Race Unknown | 157 | 94 | 63 |
| Race | Total | Men | Women |
|---|---|---|---|
| American Indian or Native American | 2 | 1 | 1 |
| Asian | 122 | 55 | 67 |
| Black | 209 | 87 | 122 |
| Hispanic | 92 | 37 | 55 |
| Native Hawaiian or Other Pacific Islanders | 0 | 0 | 0 |
| White | 290 | 143 | 147 |
| Two or more races | 54 | 22 | 32 |
| Race Unknown | 9 | 4 | 5 |
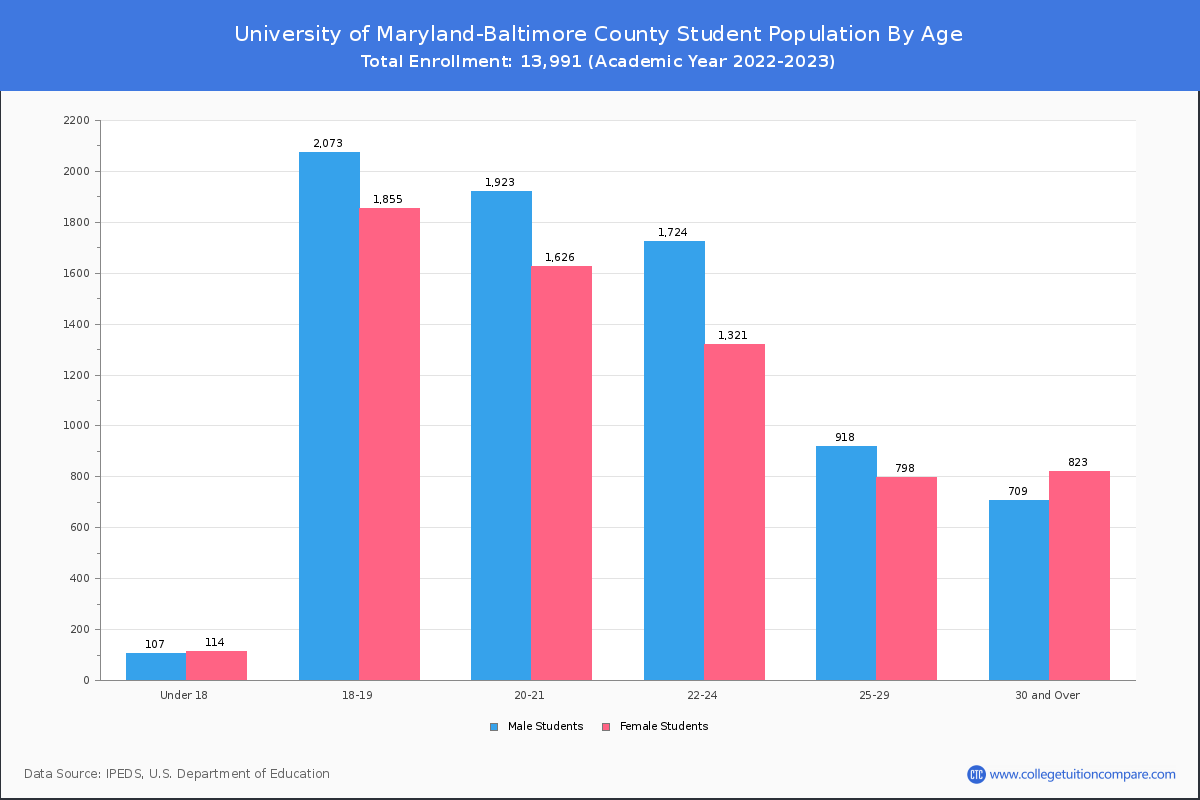
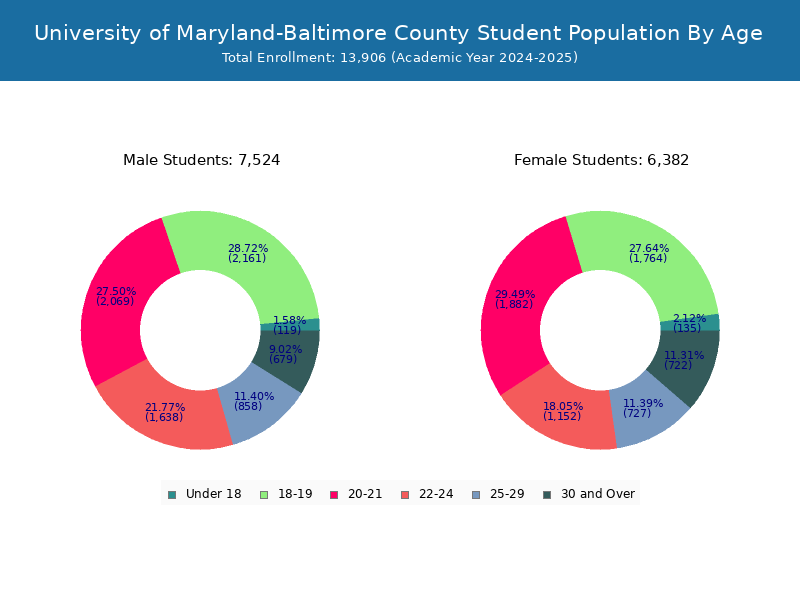
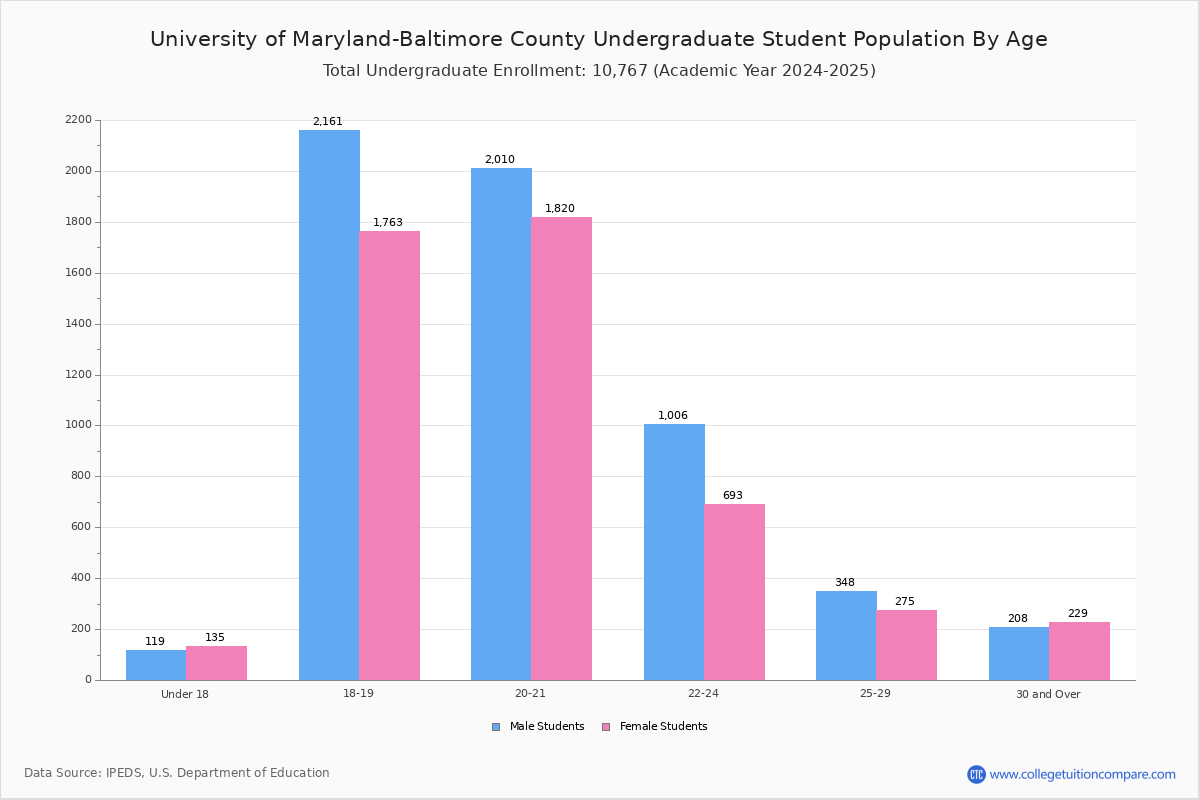
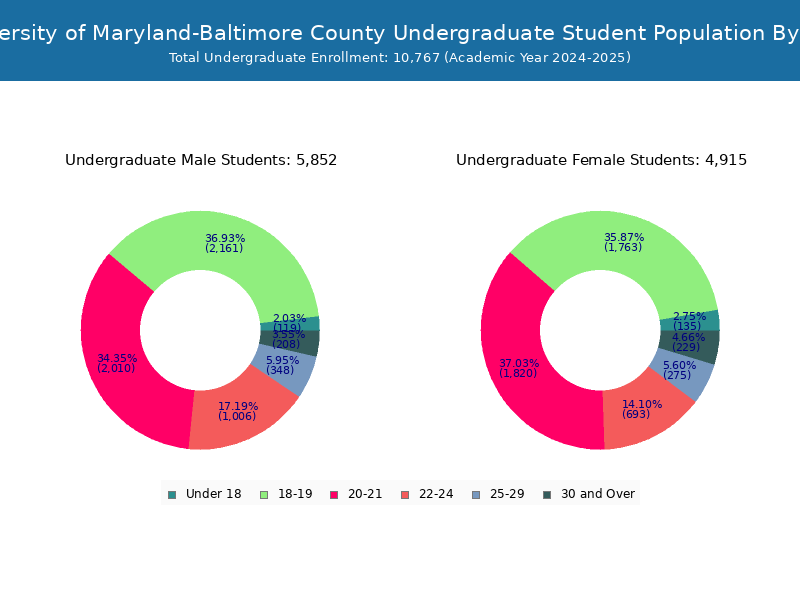
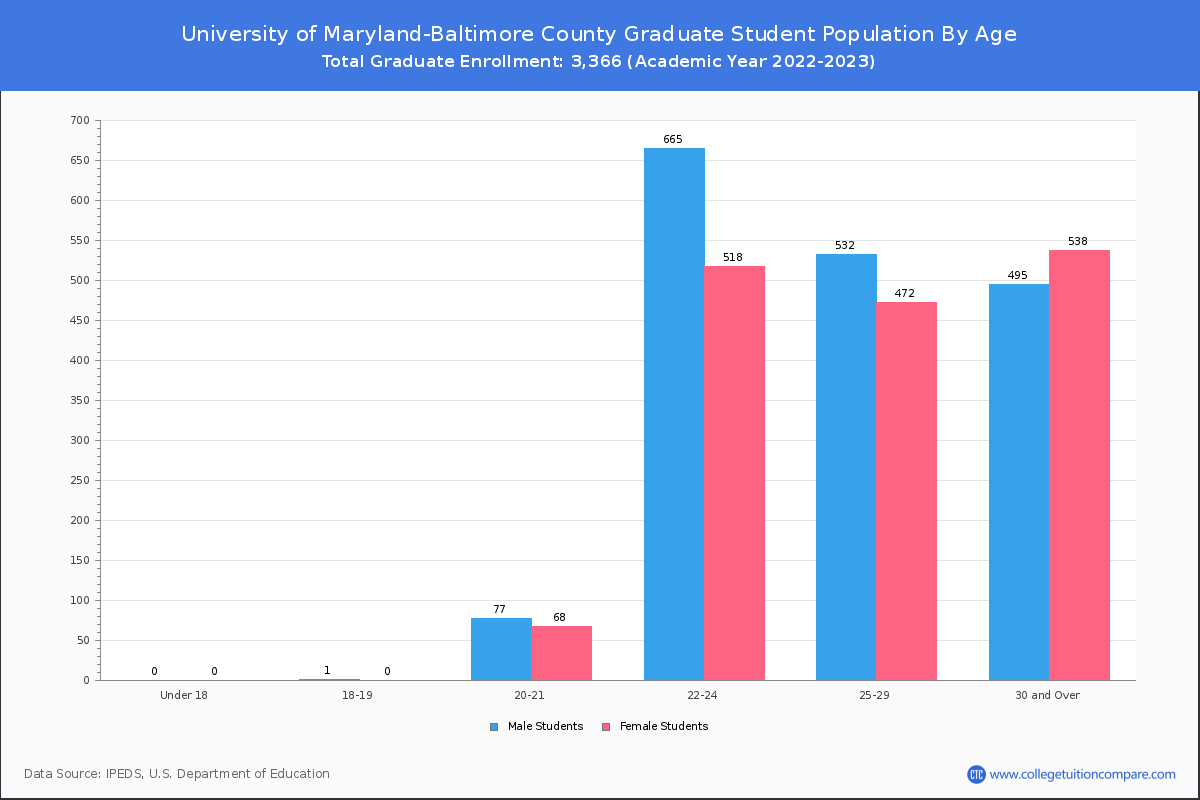
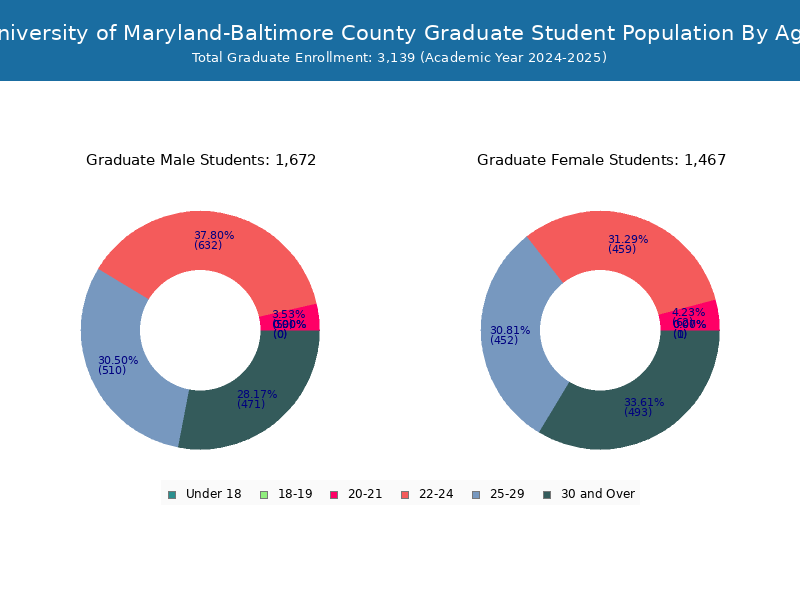
Student Age Distribution
By age, UMBC has 221 students under 18 years old and 50 students over 65 years old. There are 10,743 students under 25 years old, and 3,248 students over 25 years old out of 13,991 total students.
In undergraduate programs, 221 students are younger than 18 and 29 students are older than 65. UMBC has 9,414 undergraduate students aged under 25 and 1,211 students aged 25 and over.
It has 1,329 graduate students aged under 25 and 2,037 students aged 25 and over.
| Age | Total | Men | Women |
|---|---|---|---|
| Under 18 | 221 | 114 | 107 |
| 18-19 | 3,928 | 1,855 | 2,073 |
| 20-21 | 3,549 | 1,626 | 1,923 |
| 22-24 | 3,045 | 1,321 | 1,724 |
| 25-29 | 1,716 | 798 | 918 |
| 30-34 | 614 | 301 | 313 |
| 35-39 | 322 | 172 | 150 |
| 40-49 | 331 | 184 | 147 |
| 50-64 | 215 | 139 | 76 |
| Over 65 | 50 | 27 | 23 |
| Age | Total | Men | Women |
|---|---|---|---|
| Under 18 | 221 | 114 | 107 |
| 18-19 | 3,927 | 1,855 | 2,072 |
| 20-21 | 3,404 | 1,558 | 1,846 |
| 22-24 | 1,862 | 803 | 1,059 |
| 25-29 | 712 | 326 | 386 |
| 30-34 | 223 | 108 | 115 |
| 35-39 | 108 | 68 | 40 |
| 40-49 | 84 | 51 | 33 |
| 50-64 | 55 | 43 | 12 |
| Over 65 | 29 | 15 | 14 |
| Age | Total | Men | Women |
|---|
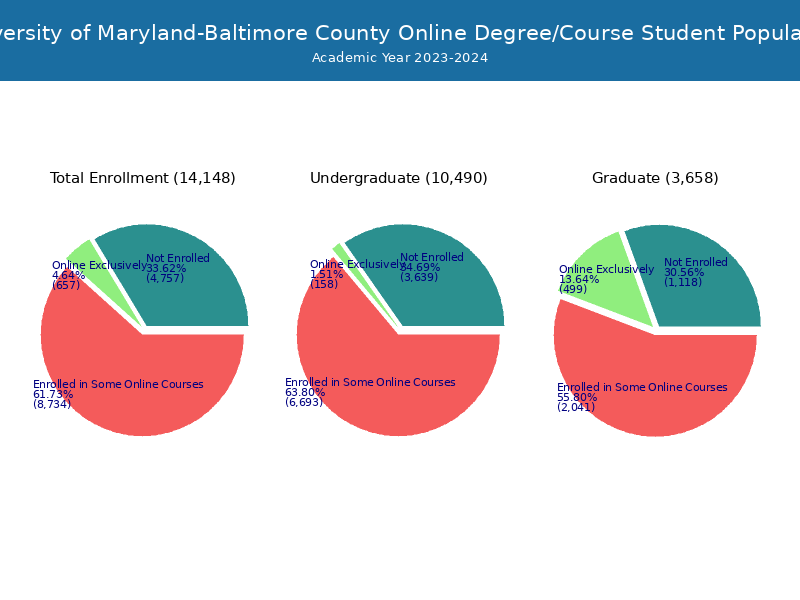
Online Student Enrollment
Distance learning, also called online education, is very attractive to students, especially who want to continue education and work in field. At University of Maryland-Baltimore County, 969 students are enrolled exclusively in online courses and 8,475 students are enrolled in some online courses.
874 students lived in Maryland or jurisdiction in which the school is located are enrolled exclusively in online courses and 95 students live in other State or outside of the United States.
| All Students | Enrolled Exclusively Online Courses | Enrolled in Some Online Courses | |
|---|---|---|---|
| All Students | 13,991 | 969 | 8,475 |
| Undergraduate | 10,625 | 241 | 6,868 |
| Graduate | 3,366 | 728 | 1,607 |
| Maryland Residents | Other States in U.S. | Outside of U.S. | |
|---|---|---|---|
| All Students | 874 | 85 | 10 |
| Undergraduate | 230 | 9 | 2 |
| Graduate | 644 | 76 | 8 |
Transfer-in Students (Undergraduate)
Among 10,625 enrolled in undergraduate programs, 826 students have transferred-in from other institutions. The percentage of transfer-in students is 7.77%.695 students have transferred in as full-time status and 131 students transferred in as part-time status.
| Number of Students | |
|---|---|
| Regular Full-time | 8,374 |
| Transfer-in Full-time | 695 |
| Regular Part-time | 1,425 |
| Transfer-in Part-time | 131 |