Student Population by Gender
University of Maryland Global Campus has a total of 55,838 enrolled students for the academic year 2022-2023. 46,734 students have enrolled in undergraduate programs and 9,104 students joined graduate programs.
By gender, 30,478 male and 25,360 female students (the male-female ratio is 55:45) are attending the school. The gender distribution is based on the 2022-2023 data.
| Total | Undergraduate | Graduate | |
|---|---|---|---|
| Total | 55,838 | 46,734 | 9,104 |
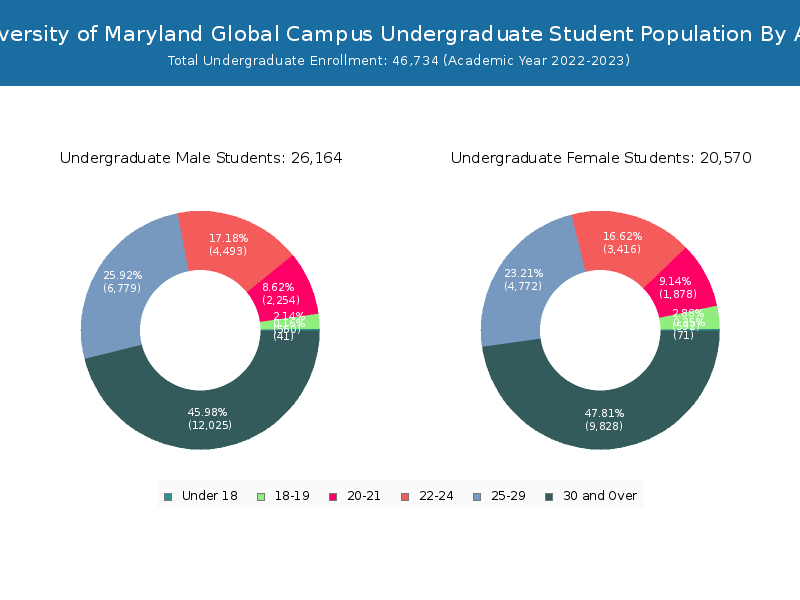
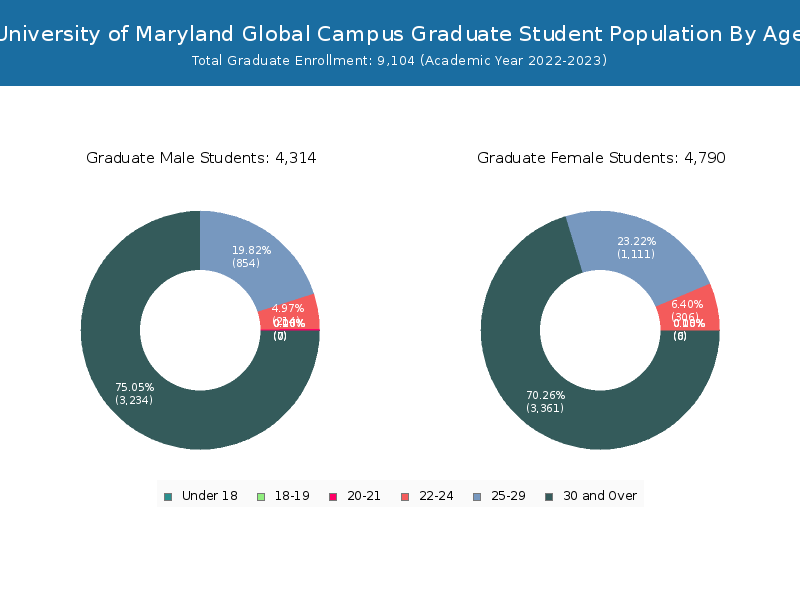
| Men | 30,478 | 26,164 | 4,314 |
| Women | 25,360 | 20,570 | 4,790 |
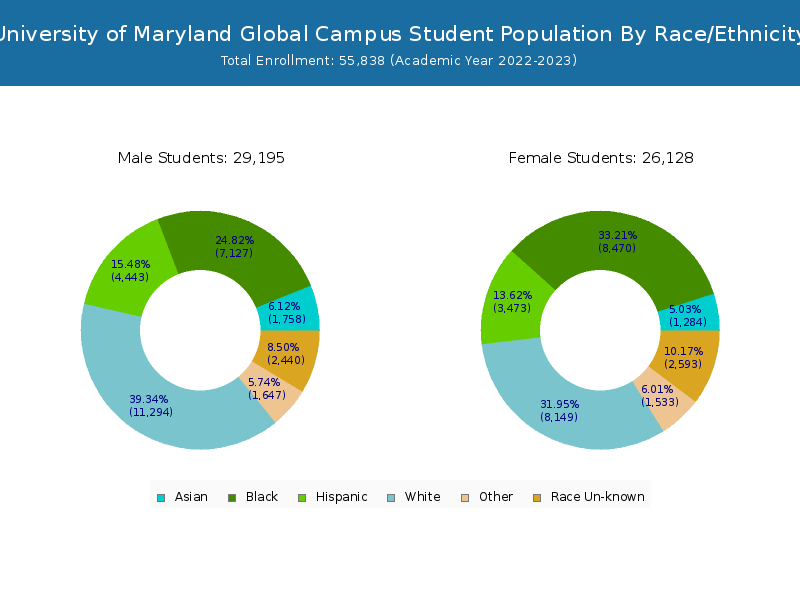
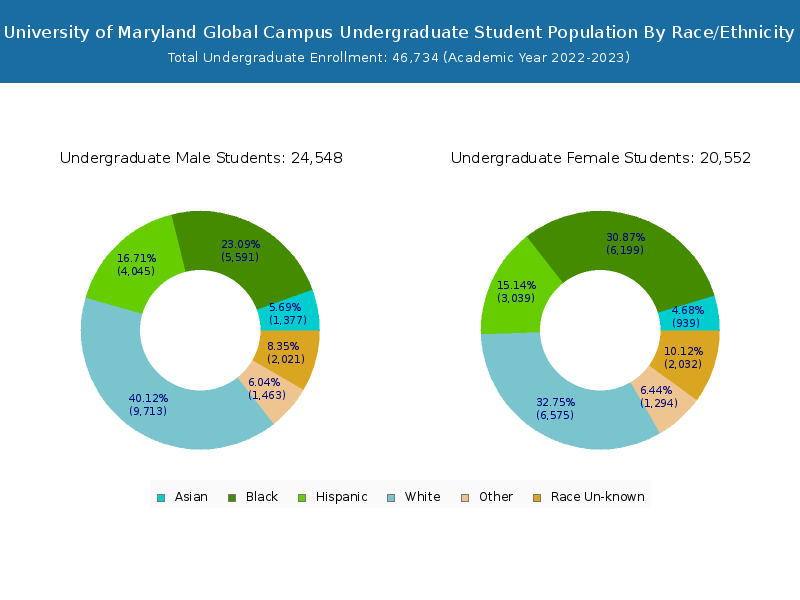
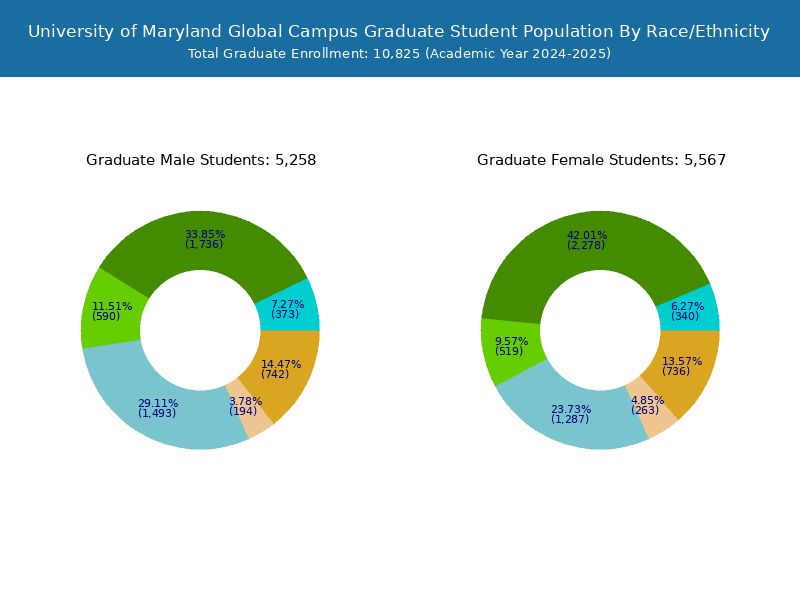
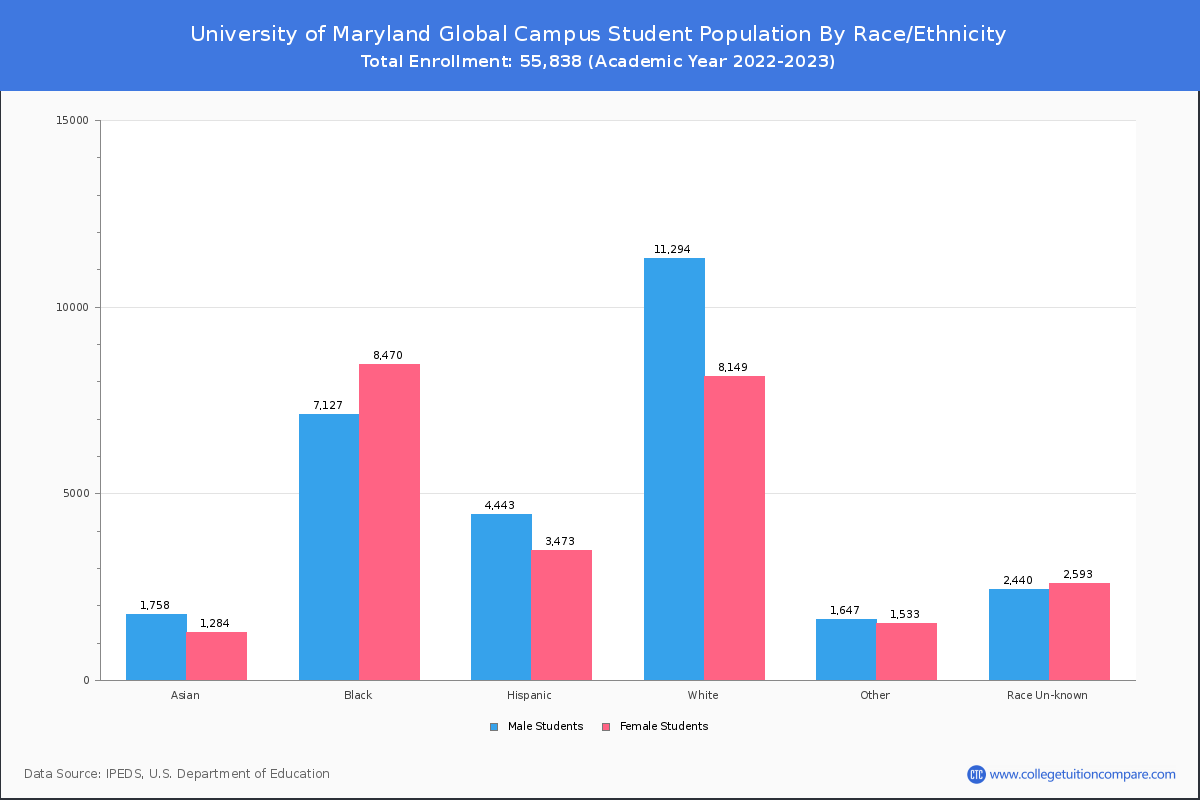
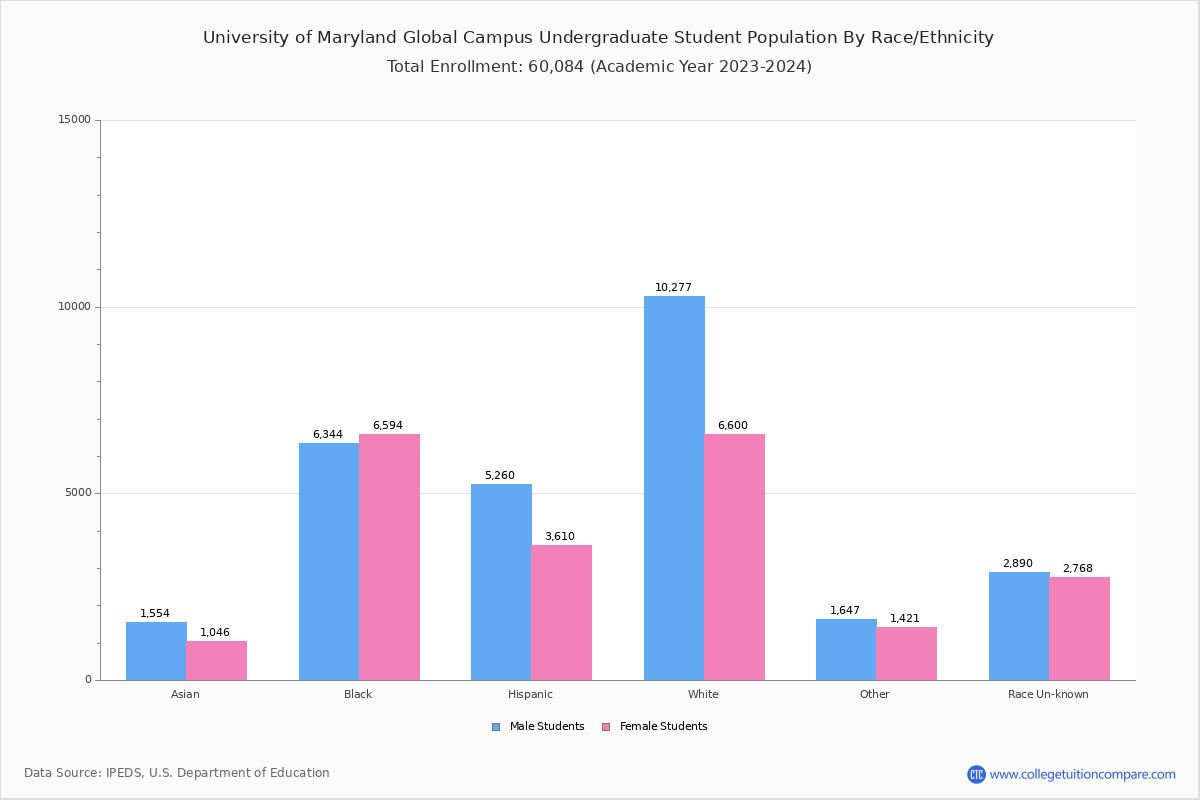
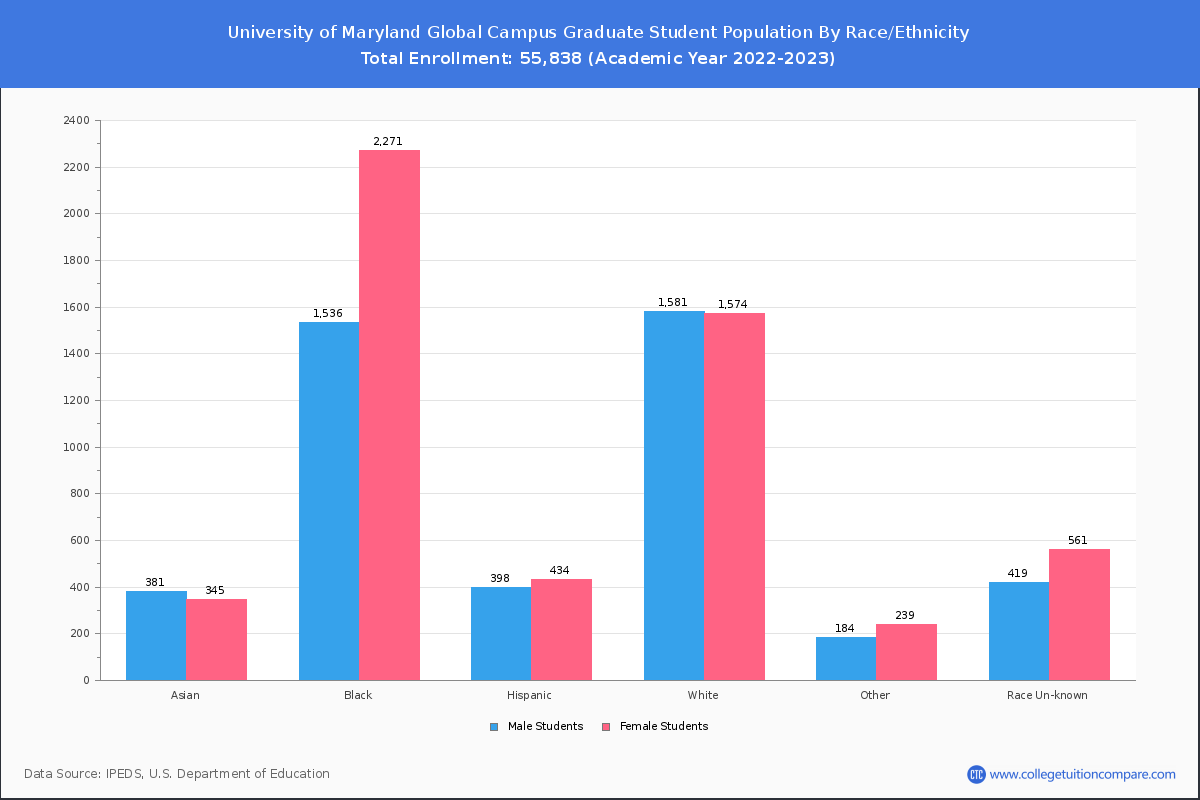
Student Distribution by Race/Ethnicity
By race/ethnicity, 19,330 White, 15,421 Black, and 3,154 Asian students out of a total of 55,838 are attending at University of Maryland Global Campus. Comprehensive enrollment statistic data by race/ethnicity is shown in the next chart (Academic year 2022-2023 data).
| Race | Total | Men | Women |
|---|---|---|---|
| American Indian or Native American | 265 | 147 | 118 |
| Asian | 3,154 | 1,828 | 1,326 |
| Black | 15,421 | 7,415 | 8,006 |
| Hispanic | 8,801 | 5,125 | 3,676 |
| Native Hawaiian or Other Pacific Islanders | 412 | 217 | 195 |
| White | 19,330 | 11,557 | 7,773 |
| Two or more races | 2,561 | 1,321 | 1,240 |
| Race Unknown | 4,862 | 2,391 | 2,471 |
| Race | Total | Men | Women |
|---|---|---|---|
| American Indian or Native American | 222 | 126 | 96 |
| Asian | 2,476 | 1,476 | 1,000 |
| Black | 12,113 | 6,018 | 6,095 |
| Hispanic | 7,996 | 4,711 | 3,285 |
| Native Hawaiian or Other Pacific Islanders | 375 | 204 | 171 |
| White | 16,536 | 10,077 | 6,459 |
| Two or more races | 2,242 | 1,181 | 1,061 |
| Race Unknown | 4,004 | 2,013 | 1,991 |
| Race | Total | Men | Women |
|---|---|---|---|
| American Indian or Native American | 45 | 27 | 18 |
| Asian | 515 | 303 | 212 |
| Black | 2,597 | 1,286 | 1,311 |
| Hispanic | 1,692 | 1,068 | 624 |
| Native Hawaiian or Other Pacific Islanders | 76 | 48 | 28 |
| White | 3,219 | 1,967 | 1,252 |
| Two or more races | 431 | 229 | 202 |
| Race Unknown | 701 | 342 | 359 |
Student Age Distribution
By age, UMUC has 112 students under 18 years old and 254 students over 65 years old. There are 13,838 students under 25 years old, and 41,964 students over 25 years old out of 55,838 total students.
In undergraduate programs, 112 students are younger than 18 and 181 students are older than 65. UMUC has 13,305 undergraduate students aged under 25 and 33,404 students aged 25 and over.
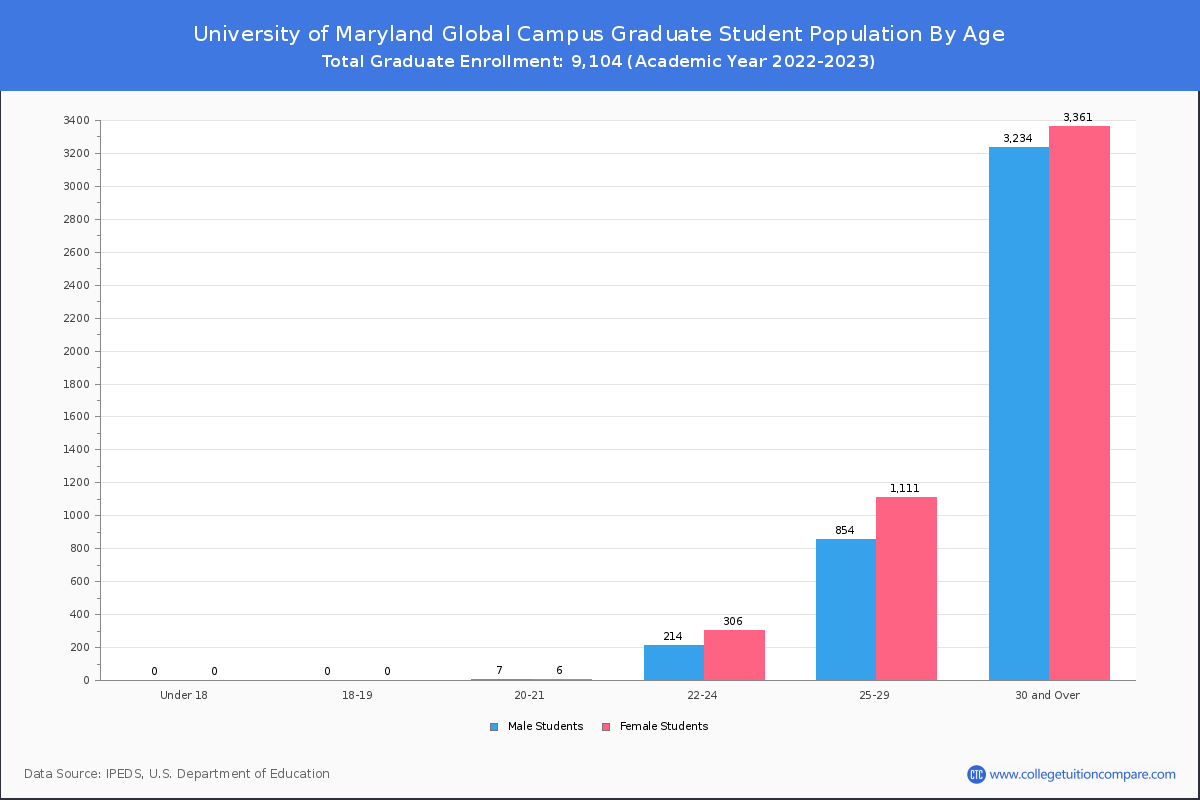
It has 533 graduate students aged under 25 and 8,560 students aged 25 and over.
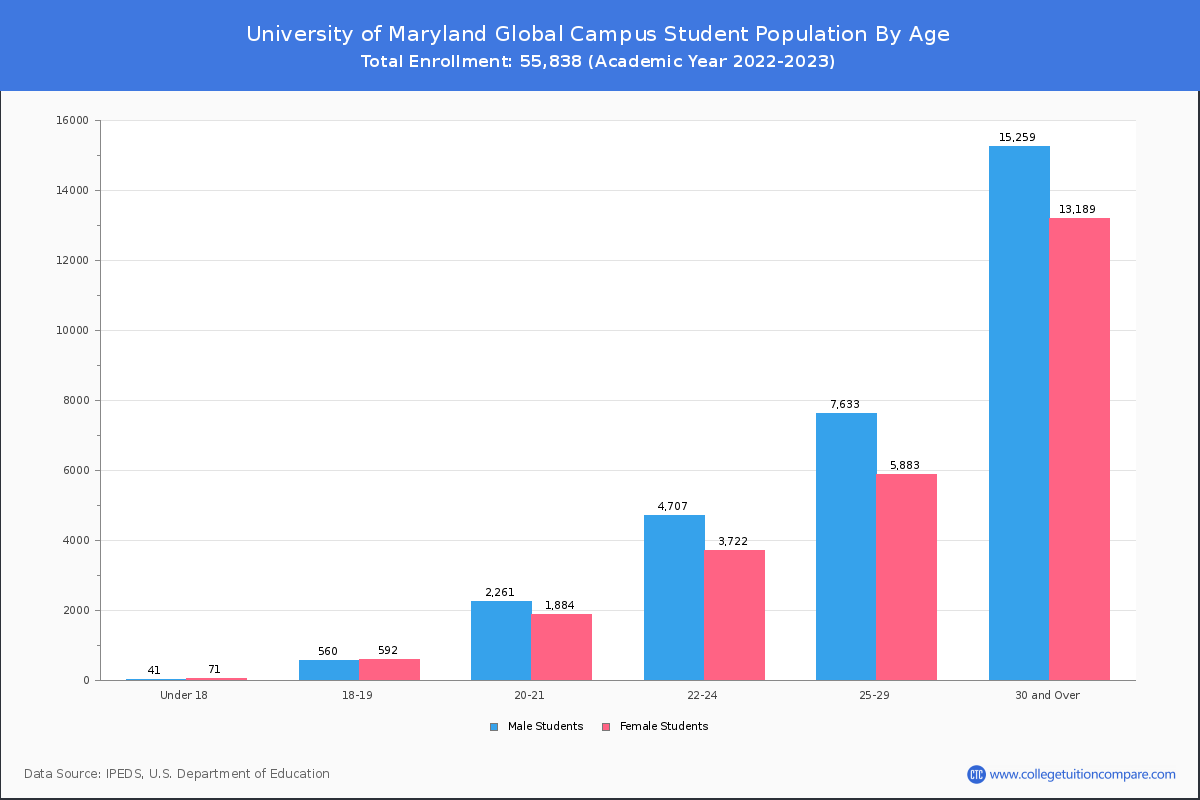
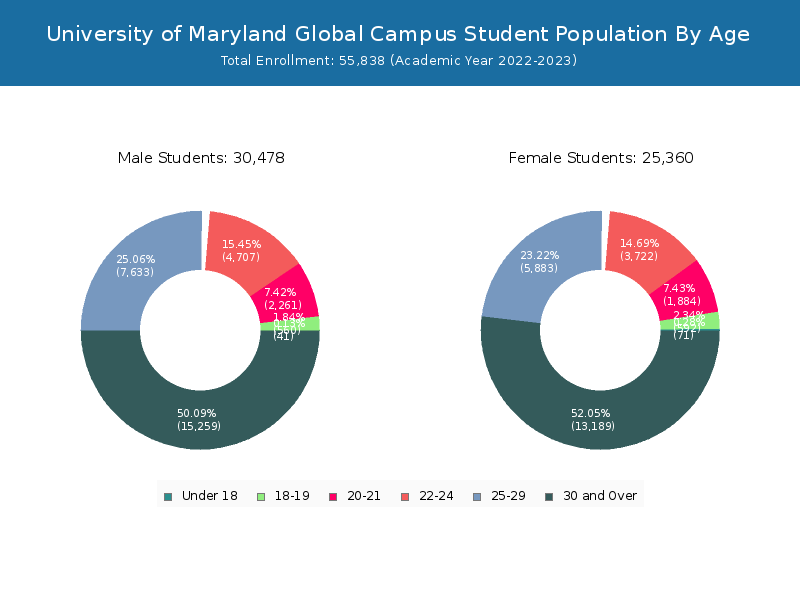
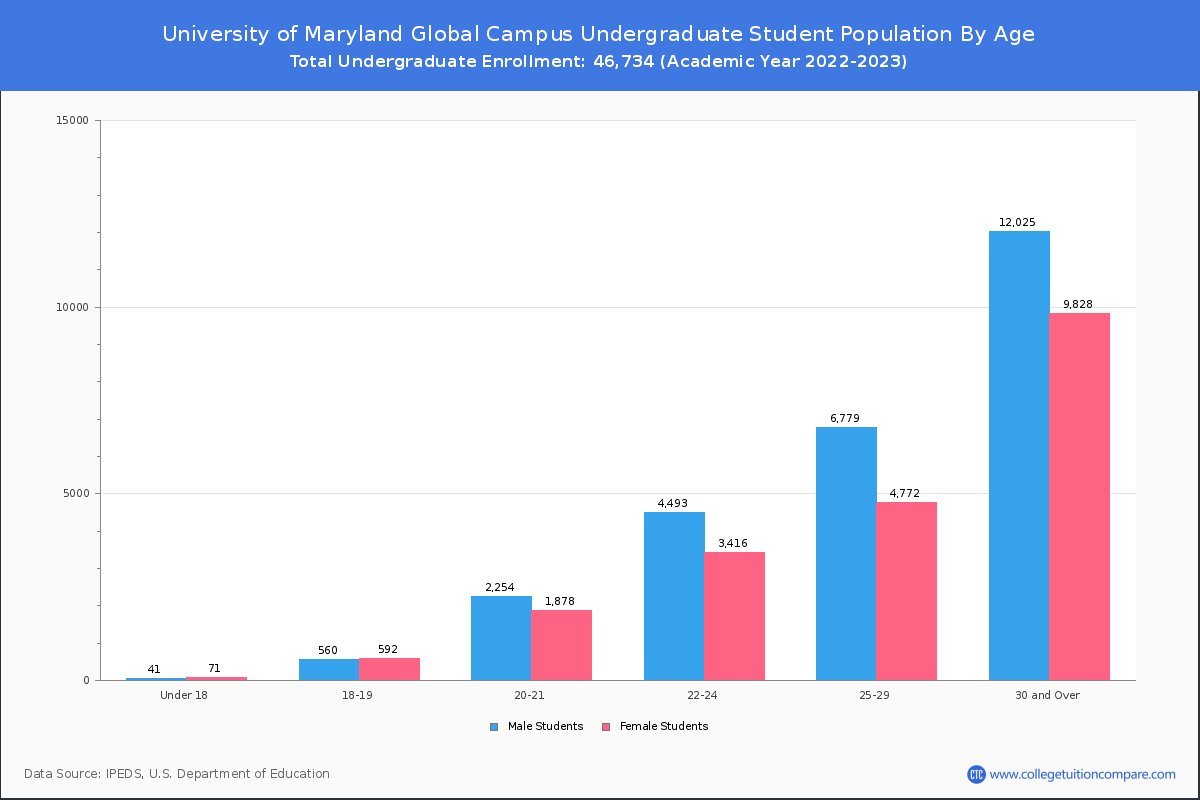
| Age | Total | Men | Women |
|---|---|---|---|
| Under 18 | 112 | 71 | 41 |
| 18-19 | 1,152 | 592 | 560 |
| 20-21 | 4,145 | 1,884 | 2,261 |
| 22-24 | 8,429 | 3,722 | 4,707 |
| 25-29 | 13,516 | 5,883 | 7,633 |
| 30-34 | 10,340 | 4,423 | 5,917 |
| 35-39 | 7,409 | 3,205 | 4,204 |
| 40-49 | 7,292 | 3,554 | 3,738 |
| 50-64 | 3,153 | 1,863 | 1,290 |
| Over 65 | 254 | 144 | 110 |
| Age | Total | Men | Women |
|---|---|---|---|
| Under 18 | 112 | 71 | 41 |
| 18-19 | 1,152 | 592 | 560 |
| 20-21 | 4,132 | 1,878 | 2,254 |
| 22-24 | 7,909 | 3,416 | 4,493 |
| 25-29 | 11,551 | 4,772 | 6,779 |
| 30-34 | 8,436 | 3,452 | 4,984 |
| 35-39 | 5,827 | 2,415 | 3,412 |
| 40-49 | 5,240 | 2,528 | 2,712 |
| 50-64 | 2,169 | 1,325 | 844 |
| Over 65 | 181 | 108 | 73 |
| Age | Total | Men | Women |
|---|
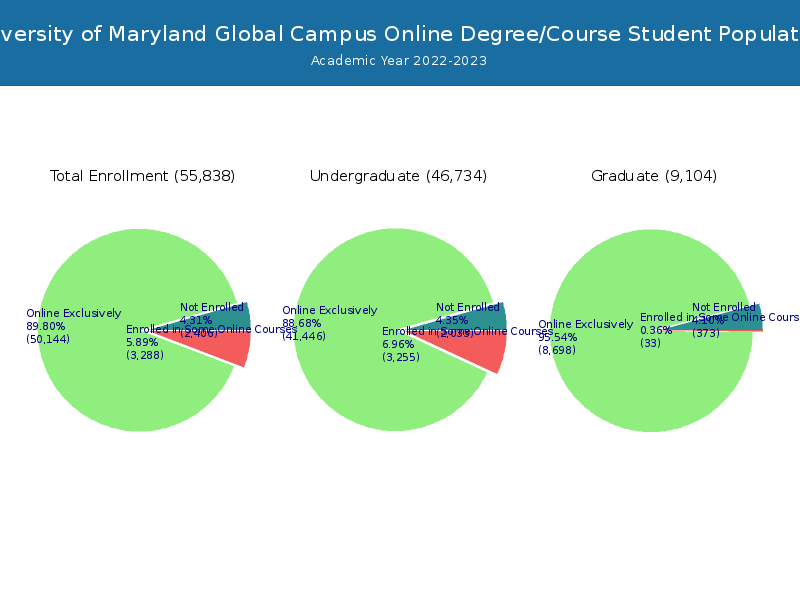
Online Student Enrollment
Distance learning, also called online education, is very attractive to students, especially who want to continue education and work in field. At University of Maryland Global Campus, 50,144 students are enrolled exclusively in online courses and 3,288 students are enrolled in some online courses.
19,047 students lived in Maryland or jurisdiction in which the school is located are enrolled exclusively in online courses and 31,097 students live in other State or outside of the United States.
| All Students | Enrolled Exclusively Online Courses | Enrolled in Some Online Courses | |
|---|---|---|---|
| All Students | 55,838 | 50,144 | 3,288 |
| Undergraduate | 46,734 | 41,446 | 3,255 |
| Graduate | 9,104 | 8,698 | 33 |
| Maryland Residents | Other States in U.S. | Outside of U.S. | |
|---|---|---|---|
| All Students | 19,047 | 30,133 | 964 |
| Undergraduate | 14,504 | 26,095 | 847 |
| Graduate | 4,543 | 4,038 | 117 |
Transfer-in Students (Undergraduate)
Among 46,734 enrolled in undergraduate programs, 9,448 students have transferred-in from other institutions. The percentage of transfer-in students is 20.22%.1,900 students have transferred in as full-time status and 7,548 students transferred in as part-time status.
| Number of Students | |
|---|---|
| Regular Full-time | 8,171 |
| Transfer-in Full-time | 1,900 |
| Regular Part-time | 29,115 |
| Transfer-in Part-time | 7,548 |