Student Population by Gender
Colby College has a total of 2,299 enrolled students for the academic year 2022-2023. All 2,299 students are enrolled into undergraduate programs.
By gender, 1,094 male and 1,205 female students (the male-female ratio is 48:52) are attending the school. The gender distribution is based on the 2022-2023 data.
| Undergraduate | |
|---|---|
| Total | 2,299 |
| Men | 1,094 |
| Women | 1,205 |
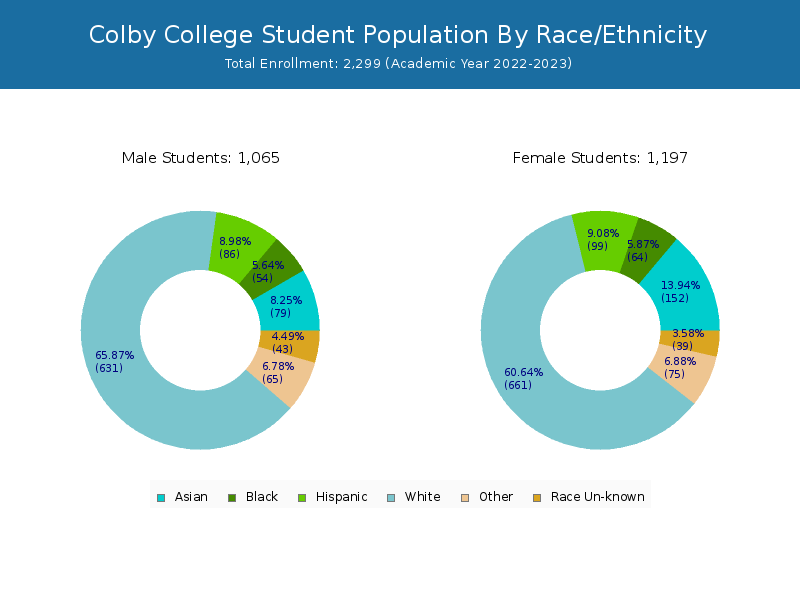
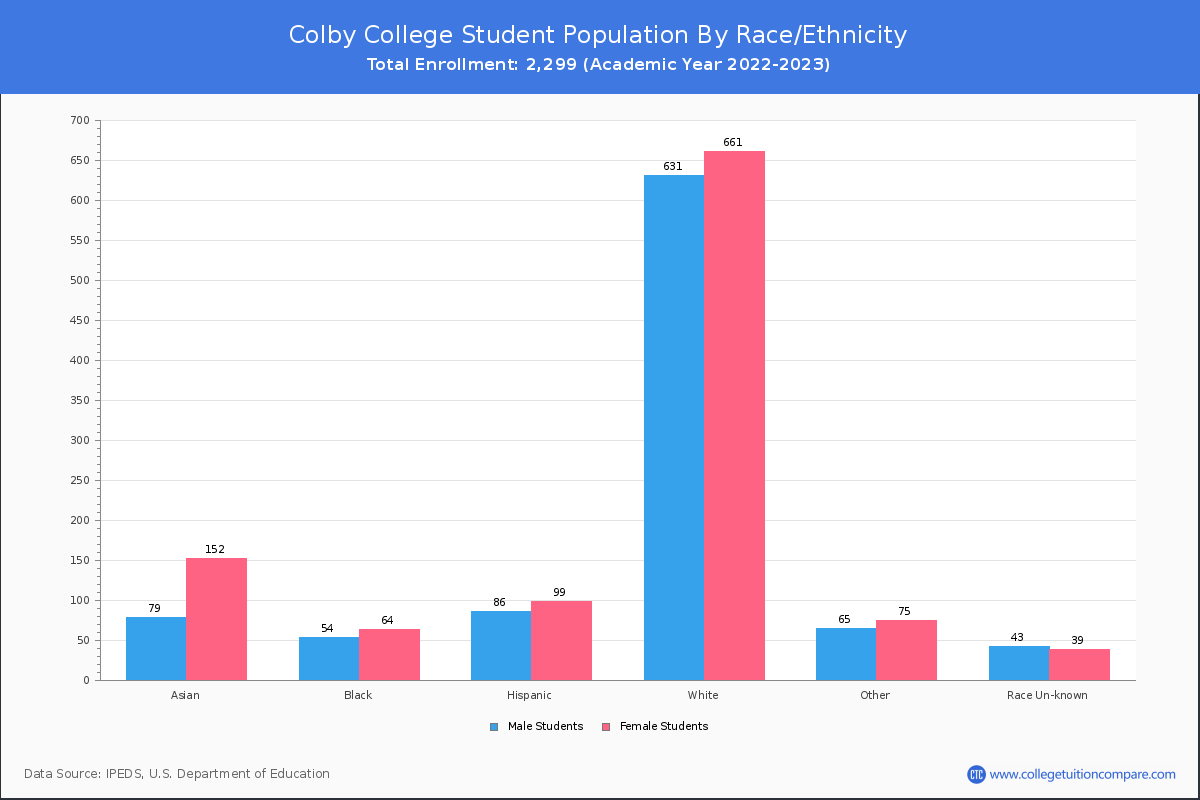
Student Distribution by Race/Ethnicity
By race/ethnicity, 1,289 White, 123 Black, and 226 Asian students out of a total of 2,299 are attending at Colby College. Comprehensive enrollment statistic data by race/ethnicity is shown in the next chart (Academic year 2022-2023 data).
| Race | Total | Men | Women |
|---|---|---|---|
| American Indian or Native American | 4 | 2 | 2 |
| Asian | 226 | 83 | 143 |
| Black | 123 | 58 | 65 |
| Hispanic | 184 | 82 | 102 |
| Native Hawaiian or Other Pacific Islanders | 1 | 0 | 1 |
| White | 1,289 | 620 | 669 |
| Two or more races | 152 | 68 | 84 |
| Race Unknown | 83 | 42 | 41 |
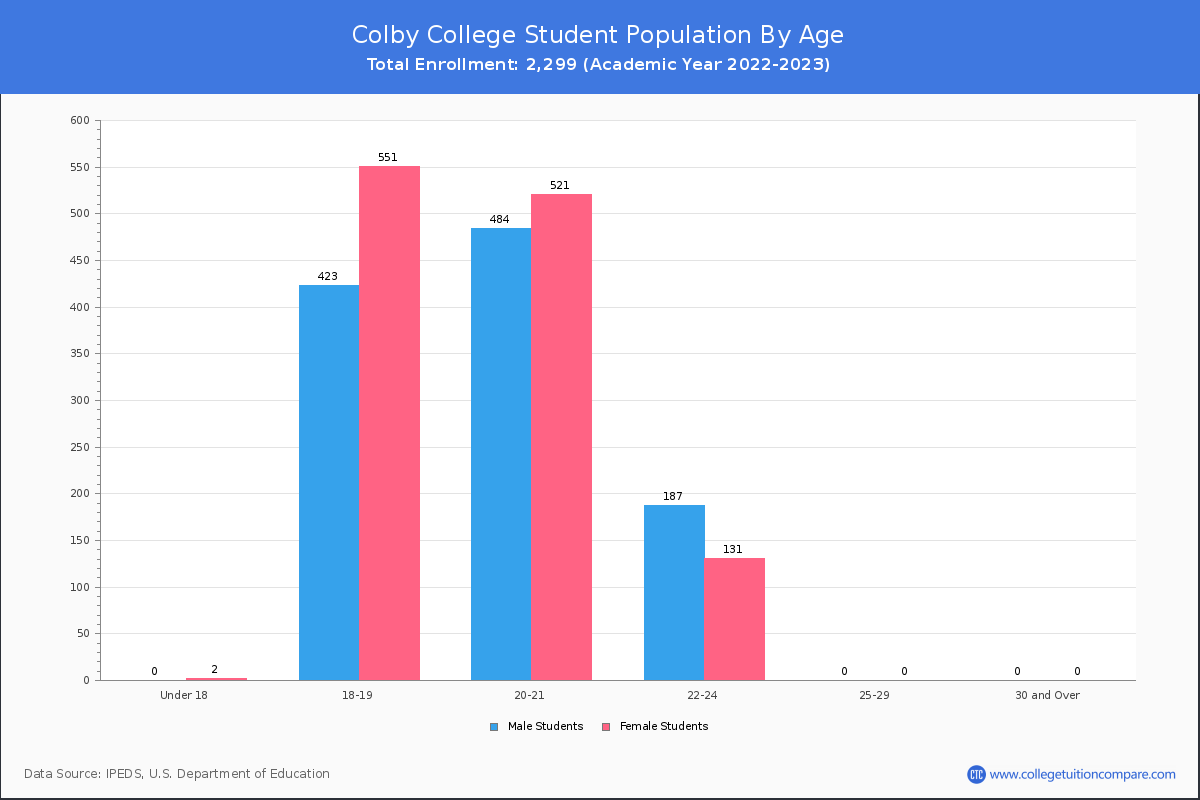
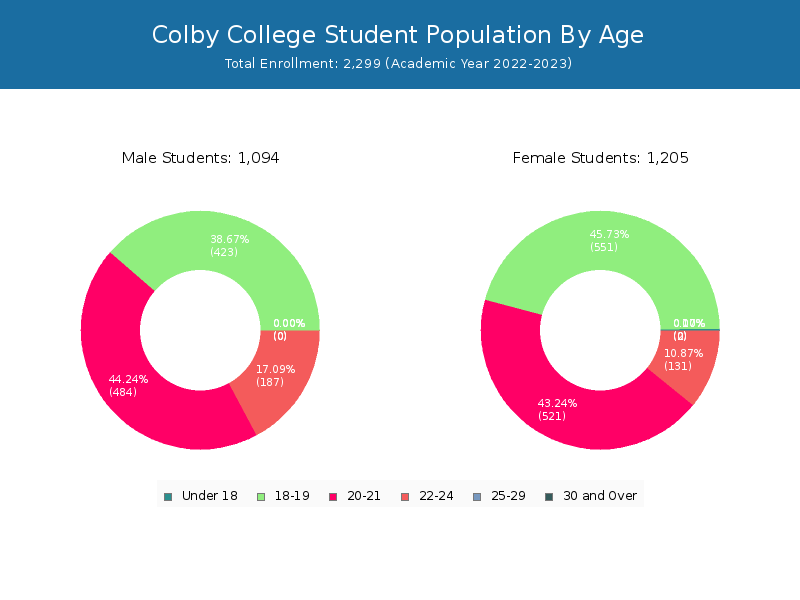
Student Age Distribution
By age, all students enrolled at Colby are under 25 years of age.
| Age | Total | Men | Women |
|---|---|---|---|
| Under 18 | 2 | 2 | 0 |
| 18-19 | 974 | 551 | 423 |
| 20-21 | 1,005 | 521 | 484 |
| 22-24 | 318 | 131 | 187 |
Transfer-in Students (Undergraduate)
Among 2,299 enrolled in undergraduate programs, 6 students have transferred-in from other institutions. The percentage of transfer-in students is 0.26%.
| Number of Students | |
|---|---|
| Regular Full-time | 2,293 |
| Transfer-in Full-time | 6 |