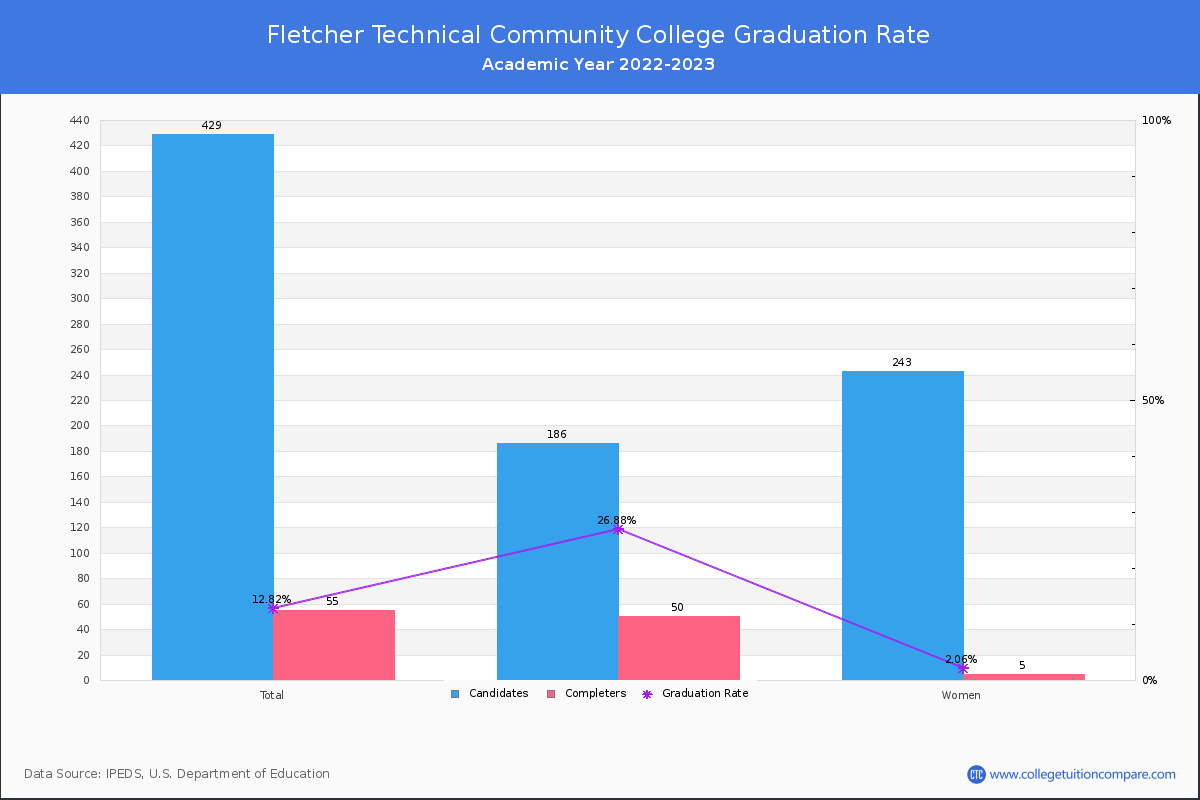
Graduation Rates in Reasonable Completion Time
For the academic year 2022-2023, 55 students out of 429 candidates have completed their courses within 150% normal time (i.e. in 3 years for 2-year Associate degree) at Fletcher Technical Community College.
By gender, 50 male and 5 female students graduated the school last year completing their jobs in the period. Its graduation rate is much lower than the average rate when comparing similar colleges' rate of 27.23% (public suburban-serving Associate's college).
| Candidates | Completers | Graduation Rates | |
|---|---|---|---|
| Total | 429 | 55 | 12.82% |
| Men | 186 | 50 | 26.88% |
| Women | 243 | 5 | 2.06% |
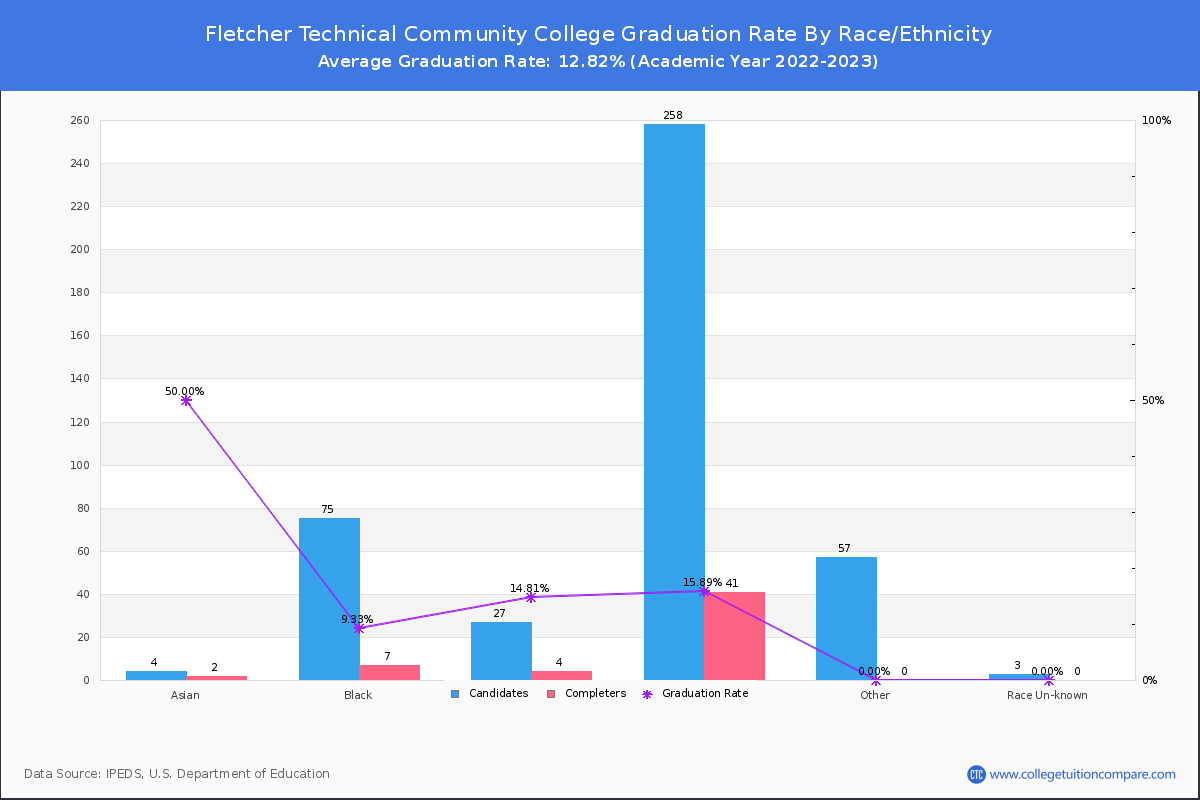
Graduation Rate By Race/Ethnicity
The following table shows graduation rate by race and at Fletcher Technical Community College.
- American Indian or Alaska Native: 0.00%
- Asian: 50.00%
- Black (Non-Hispanic): 9.33%
- Hispanic: 14.81%
- White: 15.89%
- Native Hawaiian or Other Pacific Islander: 0.00%
- Two or More Race: 0.00%
- Unknown: 0.00%
| Total | Male | Female | |
|---|---|---|---|
| American Indian or Alaska Native | 0.00%(-/17) | - | - |
| Asian | 50.00%(2/4) | 50.00%(1/2) | 50.00%(1/2) |
| Black (Non-Hispanic) | 9.33%(7/75) | 21.43%(6/28) | 2.13%(1/47) |
| Hispanic | 14.81%(4/27) | 30.77%(4/13) | - |
| White | 15.89%(41/258) | 32.77%(39/119) | 1.44%(2/139) |
| Native Hawaiian or Other Pacific Islander | 0.00%(-/3) | - | - |
| Two or More Race | 0.00%(-/37) | - | - |
| Unknown | 0.00%(-/3) | - | - |
Non-Resident Alien Graduation Rate
A non-resident alien student is not a US citizen/green card holder and studies with a student visa, such as an F visa, in the United States. At Fletcher Technical Community College, 1 of 5 non-resident alien students completed their studies and the graduation rate was 20.00%.