Student Population by Gender
Nicholls State University has a total of 5,883 enrolled students for the academic year 2022-2023. 5,314 students have enrolled in undergraduate programs and 569 students joined graduate programs.
By gender, 2,036 male and 3,847 female students (the male-female ratio is 35:65) are attending the school. The gender distribution is based on the 2022-2023 data.
| Total | Undergraduate | Graduate | |
|---|---|---|---|
| Total | 5,883 | 5,314 | 569 |
| Men | 2,036 | 1,916 | 120 |
| Women | 3,847 | 3,398 | 449 |
Student Distribution by Race/Ethnicity
| Race | Total | Men | Women |
|---|---|---|---|
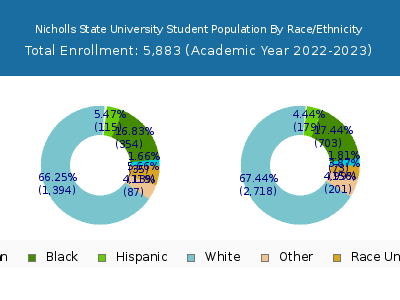
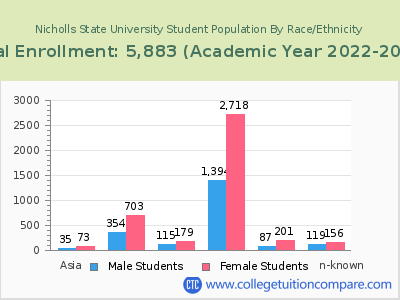
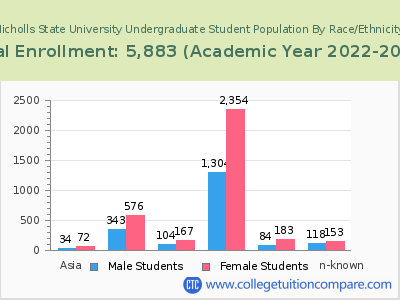
| American Indian or Native American | 140 | 39 | 101 |
| Asian | 92 | 34 | 58 |
| Black | 981 | 325 | 656 |
| Hispanic | 325 | 133 | 192 |
| Native Hawaiian or Other Pacific Islanders | 4 | 2 | 2 |
| White | 3,698 | 1,252 | 2,446 |
| Two or more races | 150 | 47 | 103 |
| Race Unknown | 400 | 154 | 246 |
| Race | Total | Men | Women |
|---|---|---|---|
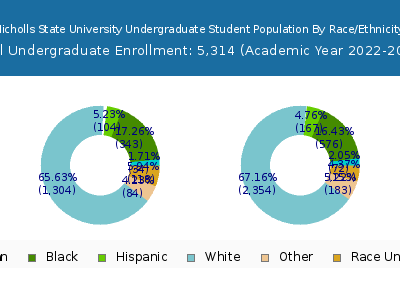
| American Indian or Native American | 130 | 37 | 93 |
| Asian | 89 | 34 | 55 |
| Black | 867 | 310 | 557 |
| Hispanic | 304 | 124 | 180 |
| Native Hawaiian or Other Pacific Islanders | 4 | 2 | 2 |
| White | 3,304 | 1,172 | 2,132 |
| Two or more races | 142 | 44 | 98 |
| Race Unknown | 397 | 153 | 244 |
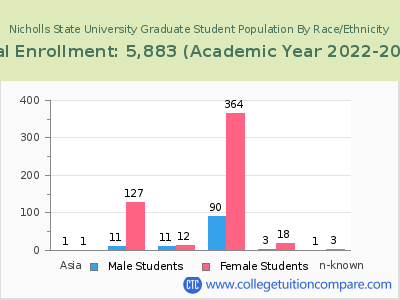
| Race | Total | Men | Women |
|---|---|---|---|
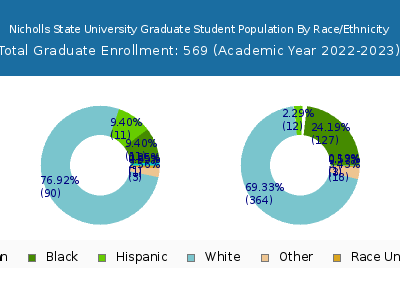
| American Indian or Native American | 6 | 0 | 6 |
| Asian | 5 | 3 | 2 |
| Black | 50 | 21 | 29 |
| Hispanic | 26 | 15 | 11 |
| Native Hawaiian or Other Pacific Islanders | 0 | 0 | 0 |
| White | 130 | 55 | 75 |
| Two or more races | 4 | 3 | 1 |
| Race Unknown | 3 | 1 | 2 |
Student Age Distribution
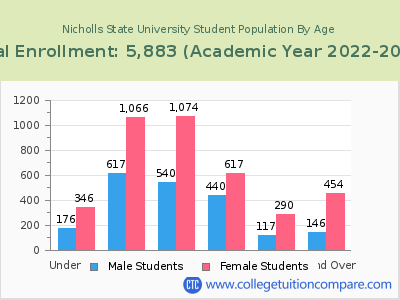
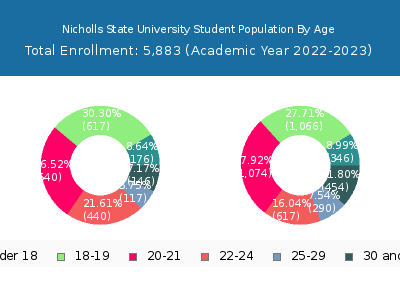
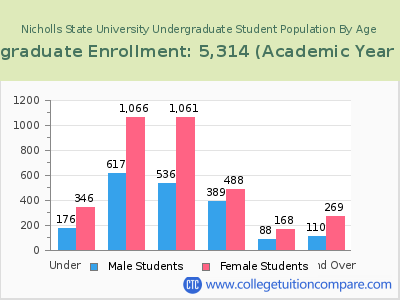
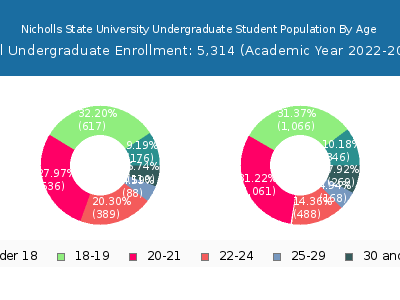
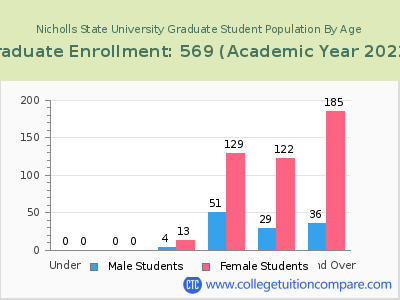
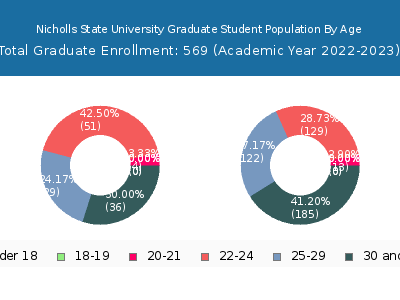
By age, Nicholls State has 522 students under 18 years old and 1 students over 65 years old. There are 4,876 students under 25 years old, and 1,007 students over 25 years old out of 5,883 total students.
Nicholls State has 4,679 undergraduate students aged under 25 and 635 students aged 25 and over.
It has 197 graduate students aged under 25 and 372 students aged 25 and over.
| Age | Total | Men | Women |
|---|---|---|---|
| Under 18 | 522 | 346 | 176 |
| 18-19 | 1,683 | 1,066 | 617 |
| 20-21 | 1,614 | 1,074 | 540 |
| 22-24 | 1,057 | 617 | 440 |
| 25-29 | 407 | 290 | 117 |
| 30-34 | 229 | 174 | 55 |
| 35-39 | 146 | 111 | 35 |
| 40-49 | 167 | 129 | 38 |
| 50-64 | 57 | 39 | 18 |
| Over 65 | 1 | 1 | 0 |
| Age | Total | Men | Women |
|---|---|---|---|
| Under 18 | 522 | 346 | 176 |
| 18-19 | 1,683 | 1,066 | 617 |
| 20-21 | 1,597 | 1,061 | 536 |
| 22-24 | 877 | 488 | 389 |
| 25-29 | 256 | 168 | 88 |
| 30-34 | 149 | 110 | 39 |
| 35-39 | 80 | 53 | 27 |
| 40-49 | 112 | 83 | 29 |
| 50-64 | 38 | 23 | 15 |
| Age | Total | Men | Women |
|---|
Online Student Enrollment
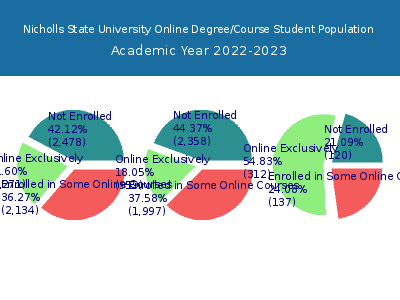
Distance learning, also called online education, is very attractive to students, especially who want to continue education and work in field. At Nicholls State University, 1,271 students are enrolled exclusively in online courses and 2,134 students are enrolled in some online courses.
1,197 students lived in Louisiana or jurisdiction in which the school is located are enrolled exclusively in online courses and 74 students live in other State or outside of the United States.
| All Students | Enrolled Exclusively Online Courses | Enrolled in Some Online Courses | |
|---|---|---|---|
| All Students | 5,883 | 1,271 | 2,134 |
| Undergraduate | 5,314 | 959 | 1,997 |
| Graduate | 569 | 312 | 137 |
| Louisiana Residents | Other States in U.S. | Outside of U.S. | |
|---|---|---|---|
| All Students | 1,197 | 60 | 14 |
| Undergraduate | 903 | 47 | 9 |
| Graduate | 294 | 13 | 5 |
Transfer-in Students (Undergraduate)
Among 5,314 enrolled in undergraduate programs, 231 students have transferred-in from other institutions. The percentage of transfer-in students is 4.35%.197 students have transferred in as full-time status and 34 students transferred in as part-time status.
| Number of Students | |
|---|---|
| Regular Full-time | 4,047 |
| Transfer-in Full-time | 197 |
| Regular Part-time | 1,036 |
| Transfer-in Part-time | 34 |
