Student Population by Gender
Louisiana Tech University has a total of 10,839 enrolled students for the academic year 2022-2023. 9,924 students have enrolled in undergraduate programs and 915 students joined graduate programs.
By gender, 5,644 male and 5,195 female students (the male-female ratio is 52:48) are attending the school. The gender distribution is based on the 2022-2023 data.
| Total | Undergraduate | Graduate | |
|---|---|---|---|
| Total | 10,839 | 9,924 | 915 |
| Men | 5,644 | 5,219 | 425 |
| Women | 5,195 | 4,705 | 490 |
Student Distribution by Race/Ethnicity
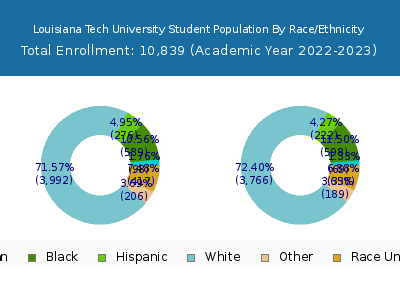
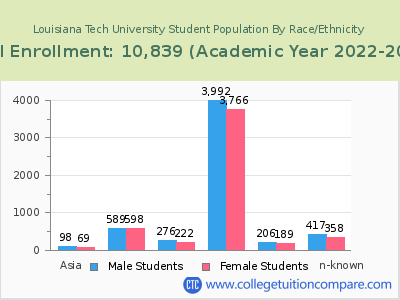
| Race | Total | Men | Women |
|---|---|---|---|
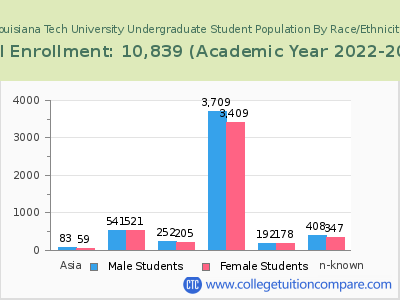
| American Indian or Native American | 39 | 18 | 21 |
| Asian | 148 | 81 | 67 |
| Black | 1,188 | 587 | 601 |
| Hispanic | 521 | 289 | 232 |
| Native Hawaiian or Other Pacific Islanders | 7 | 4 | 3 |
| White | 7,869 | 4,070 | 3,799 |
| Two or more races | 241 | 134 | 107 |
| Race Unknown | 503 | 290 | 213 |
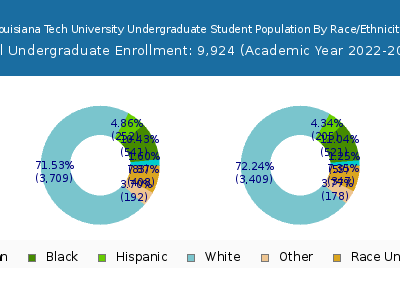
| Race | Total | Men | Women |
|---|---|---|---|
| American Indian or Native American | 39 | 18 | 21 |
| Asian | 134 | 75 | 59 |
| Black | 1,083 | 550 | 533 |
| Hispanic | 492 | 276 | 216 |
| Native Hawaiian or Other Pacific Islanders | 6 | 4 | 2 |
| White | 7,285 | 3,802 | 3,483 |
| Two or more races | 224 | 127 | 97 |
| Race Unknown | 492 | 285 | 207 |
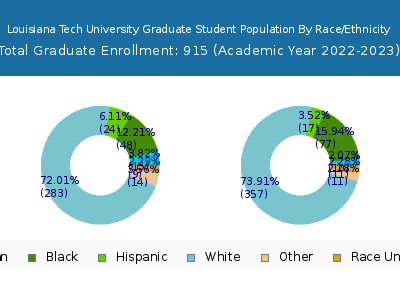
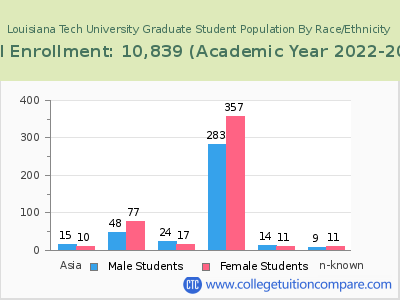
| Race | Total | Men | Women |
|---|---|---|---|
| American Indian or Native American | 0 | 0 | 0 |
| Asian | 1 | 0 | 1 |
| Black | 41 | 21 | 20 |
| Hispanic | 12 | 9 | 3 |
| Native Hawaiian or Other Pacific Islanders | 0 | 0 | 0 |
| White | 111 | 65 | 46 |
| Two or more races | 4 | 2 | 2 |
| Race Unknown | 7 | 5 | 2 |
Student Age Distribution
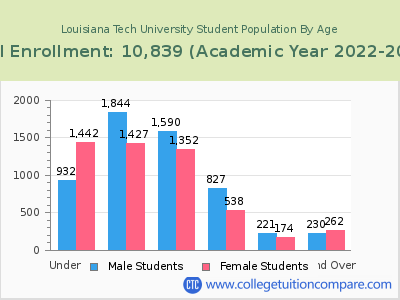
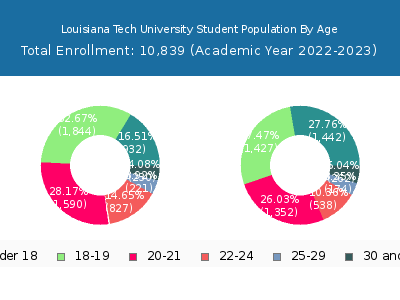
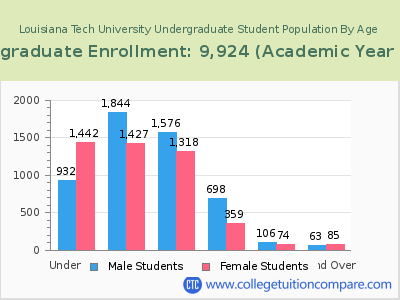
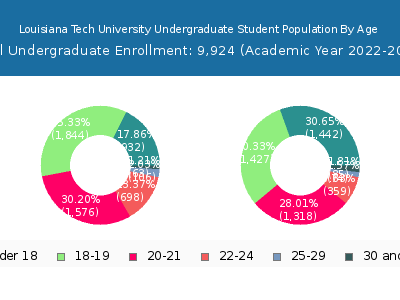
By age, LA Tech has 2,374 students under 18 years old and 9 students over 65 years old. There are 9,952 students under 25 years old, and 887 students over 25 years old out of 10,839 total students.
In undergraduate programs, 2,374 students are younger than 18 and 3 students are older than 65. LA Tech has 9,596 undergraduate students aged under 25 and 328 students aged 25 and over.
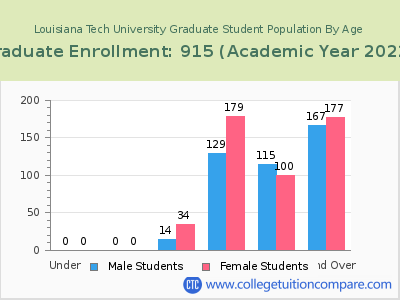
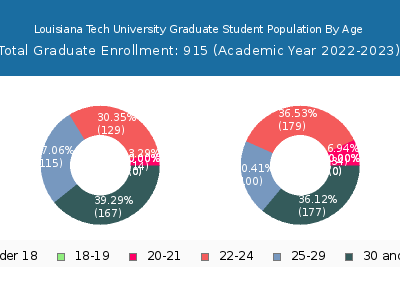
It has 356 graduate students aged under 25 and 559 students aged 25 and over.
| Age | Total | Men | Women |
|---|---|---|---|
| Under 18 | 2,374 | 1,442 | 932 |
| 18-19 | 3,271 | 1,427 | 1,844 |
| 20-21 | 2,942 | 1,352 | 1,590 |
| 22-24 | 1,365 | 538 | 827 |
| 25-29 | 395 | 174 | 221 |
| 30-34 | 180 | 94 | 86 |
| 35-39 | 119 | 61 | 58 |
| 40-49 | 125 | 69 | 56 |
| 50-64 | 59 | 35 | 24 |
| Over 65 | 9 | 3 | 6 |
| Age | Total | Men | Women |
|---|---|---|---|
| Under 18 | 2,374 | 1,442 | 932 |
| 18-19 | 3,271 | 1,427 | 1,844 |
| 20-21 | 2,894 | 1,318 | 1,576 |
| 22-24 | 1,057 | 359 | 698 |
| 25-29 | 180 | 74 | 106 |
| 30-34 | 53 | 28 | 25 |
| 35-39 | 43 | 26 | 17 |
| 40-49 | 35 | 21 | 14 |
| 50-64 | 14 | 9 | 5 |
| Over 65 | 3 | 1 | 2 |
| Age | Total | Men | Women |
|---|
Online Student Enrollment
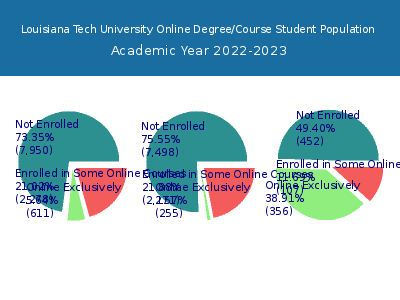
Distance learning, also called online education, is very attractive to students, especially who want to continue education and work in field. At Louisiana Tech University, 611 students are enrolled exclusively in online courses and 2,278 students are enrolled in some online courses.
467 students lived in Louisiana or jurisdiction in which the school is located are enrolled exclusively in online courses and 144 students live in other State or outside of the United States.
| All Students | Enrolled Exclusively Online Courses | Enrolled in Some Online Courses | |
|---|---|---|---|
| All Students | 10,839 | 611 | 2,278 |
| Undergraduate | 9,924 | 255 | 2,171 |
| Graduate | 915 | 356 | 107 |
| Louisiana Residents | Other States in U.S. | Outside of U.S. | |
|---|---|---|---|
| All Students | 467 | 144 | 0 |
| Undergraduate | 240 | 15 | 0 |
| Graduate | 227 | 129 | 0 |
Transfer-in Students (Undergraduate)
Among 9,924 enrolled in undergraduate programs, 188 students have transferred-in from other institutions. The percentage of transfer-in students is 1.89%.175 students have transferred in as full-time status and 13 students transferred in as part-time status.
| Number of Students | |
|---|---|
| Regular Full-time | 7,150 |
| Transfer-in Full-time | 175 |
| Regular Part-time | 2,586 |
| Transfer-in Part-time | 13 |
