Student Population by Gender
Spalding University has a total of 1,532 enrolled students for the academic year 2022-2023. 767 students have enrolled in undergraduate programs and 765 students joined graduate programs.
By gender, 441 male and 1,091 female students (the male-female ratio is 29:71) are attending the school. The gender distribution is based on the 2022-2023 data.
| Total | Undergraduate | Graduate | |
|---|---|---|---|
| Total | 1,532 | 767 | 765 |
| Men | 441 | 281 | 160 |
| Women | 1,091 | 486 | 605 |
Student Distribution by Race/Ethnicity
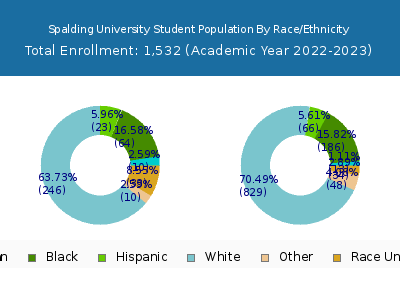
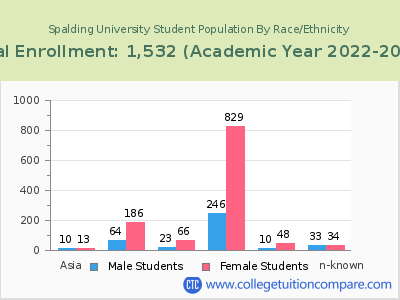
| Race | Total | Men | Women |
|---|---|---|---|
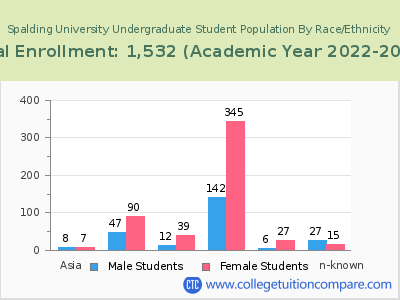
| American Indian or Native American | 1 | 0 | 1 |
| Asian | 19 | 5 | 14 |
| Black | 274 | 75 | 199 |
| Hispanic | 90 | 31 | 59 |
| Native Hawaiian or Other Pacific Islanders | 0 | 0 | 0 |
| White | 944 | 241 | 703 |
| Two or more races | 42 | 9 | 33 |
| Race Unknown | 157 | 76 | 81 |
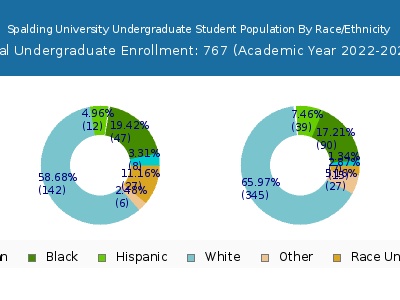
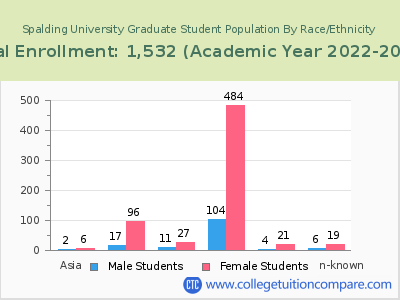
| Race | Total | Men | Women |
|---|---|---|---|
| American Indian or Native American | 0 | 0 | 0 |
| Asian | 12 | 2 | 10 |
| Black | 135 | 47 | 88 |
| Hispanic | 51 | 17 | 34 |
| Native Hawaiian or Other Pacific Islanders | 0 | 0 | 0 |
| White | 405 | 136 | 269 |
| Two or more races | 24 | 6 | 18 |
| Race Unknown | 137 | 71 | 66 |
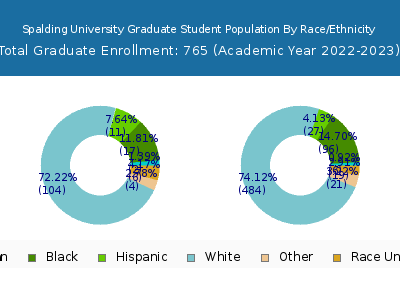
| Race | Total | Men | Women |
|---|---|---|---|
| American Indian or Native American | 0 | 0 | 0 |
| Asian | 3 | 1 | 2 |
| Black | 21 | 8 | 13 |
| Hispanic | 5 | 2 | 3 |
| Native Hawaiian or Other Pacific Islanders | 0 | 0 | 0 |
| White | 46 | 9 | 37 |
| Two or more races | 4 | 2 | 2 |
| Race Unknown | 0 | 0 | 0 |
Student Age Distribution
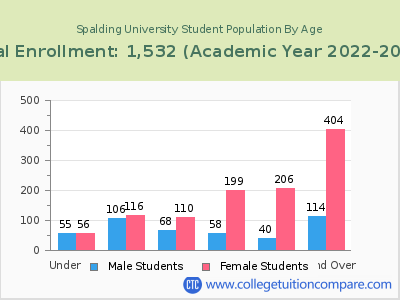
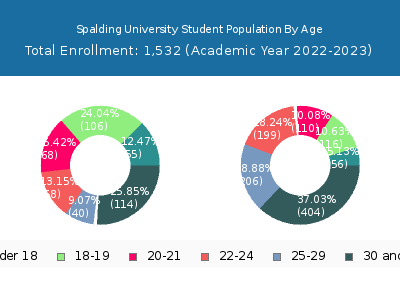
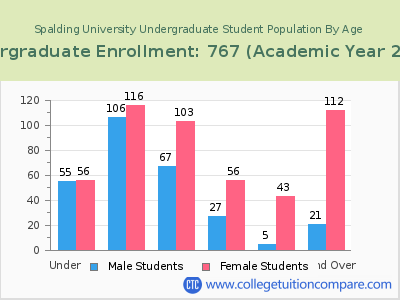
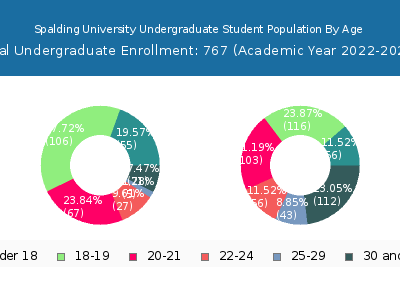
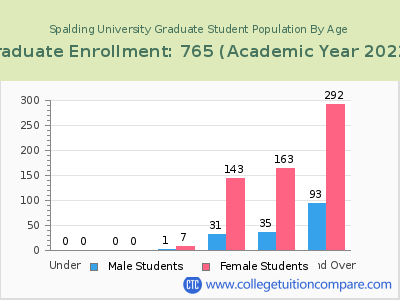
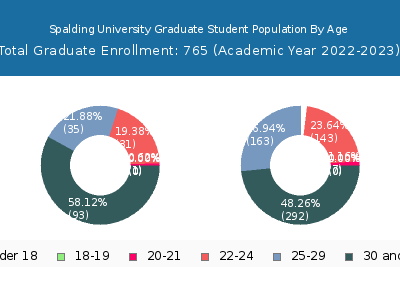
By age, Spalding has 111 students under 18 years old and 9 students over 65 years old. There are 768 students under 25 years old, and 764 students over 25 years old out of 1,532 total students.
In undergraduate programs, 111 students are younger than 18 and 1 students are older than 65. Spalding has 586 undergraduate students aged under 25 and 181 students aged 25 and over.
It has 182 graduate students aged under 25 and 583 students aged 25 and over.
| Age | Total | Men | Women |
|---|---|---|---|
| Under 18 | 111 | 56 | 55 |
| 18-19 | 222 | 116 | 106 |
| 20-21 | 178 | 110 | 68 |
| 22-24 | 257 | 199 | 58 |
| 25-29 | 246 | 206 | 40 |
| 30-34 | 133 | 103 | 30 |
| 35-39 | 108 | 83 | 25 |
| 40-49 | 175 | 141 | 34 |
| 50-64 | 93 | 73 | 20 |
| Over 65 | 9 | 4 | 5 |
| Age | Total | Men | Women |
|---|---|---|---|
| Under 18 | 111 | 56 | 55 |
| 18-19 | 222 | 116 | 106 |
| 20-21 | 170 | 103 | 67 |
| 22-24 | 83 | 56 | 27 |
| 25-29 | 48 | 43 | 5 |
| 30-34 | 36 | 27 | 9 |
| 35-39 | 29 | 26 | 3 |
| 40-49 | 45 | 38 | 7 |
| 50-64 | 22 | 20 | 2 |
| Over 65 | 1 | 1 | 0 |
| Age | Total | Men | Women |
|---|
Online Student Enrollment
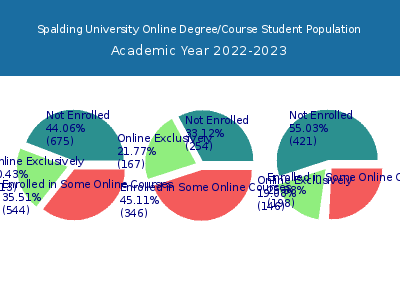
Distance learning, also called online education, is very attractive to students, especially who want to continue education and work in field. At Spalding University, 313 students are enrolled exclusively in online courses and 544 students are enrolled in some online courses.
199 students lived in Kentucky or jurisdiction in which the school is located are enrolled exclusively in online courses and 114 students live in other State or outside of the United States.
| All Students | Enrolled Exclusively Online Courses | Enrolled in Some Online Courses | |
|---|---|---|---|
| All Students | 1,532 | 313 | 544 |
| Undergraduate | 767 | 167 | 346 |
| Graduate | 765 | 146 | 198 |
| Kentucky Residents | Other States in U.S. | Outside of U.S. | |
|---|---|---|---|
| All Students | 199 | 111 | 3 |
| Undergraduate | 118 | 47 | 2 |
| Graduate | 81 | 64 | 1 |
Transfer-in Students (Undergraduate)
Among 767 enrolled in undergraduate programs, 80 students have transferred-in from other institutions. The percentage of transfer-in students is 10.43%.69 students have transferred in as full-time status and 11 students transferred in as part-time status.
| Number of Students | |
|---|---|
| Regular Full-time | 482 |
| Transfer-in Full-time | 69 |
| Regular Part-time | 205 |
| Transfer-in Part-time | 11 |
