Student Population by Gender
University of Pikeville has a total of 2,434 enrolled students for the academic year 2022-2023. 1,491 students have enrolled in undergraduate programs and 943 students joined graduate programs.
By gender, 1,069 male and 1,365 female students (the male-female ratio is 44:56) are attending the school. The gender distribution is based on the 2022-2023 data.
| Total | Undergraduate | Graduate | |
|---|---|---|---|
| Total | 2,434 | 1,491 | 943 |
| Men | 1,069 | 656 | 413 |
| Women | 1,365 | 835 | 530 |
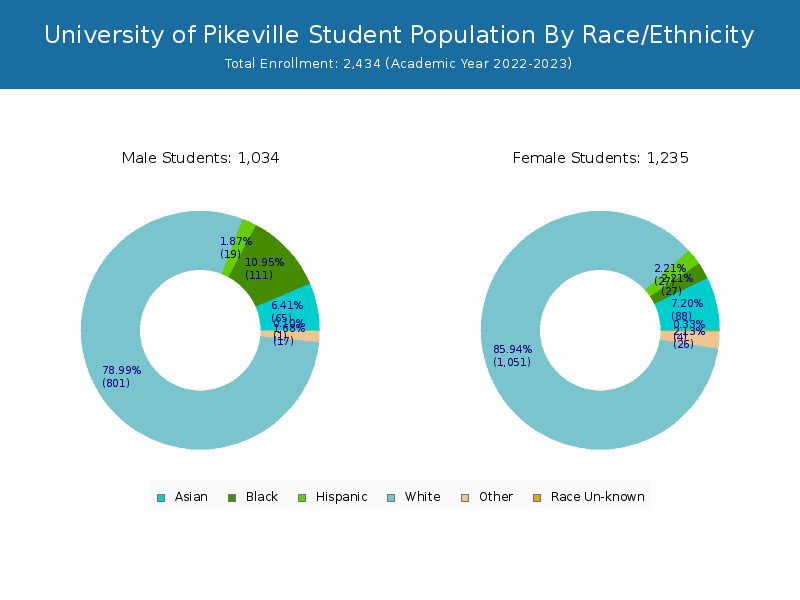
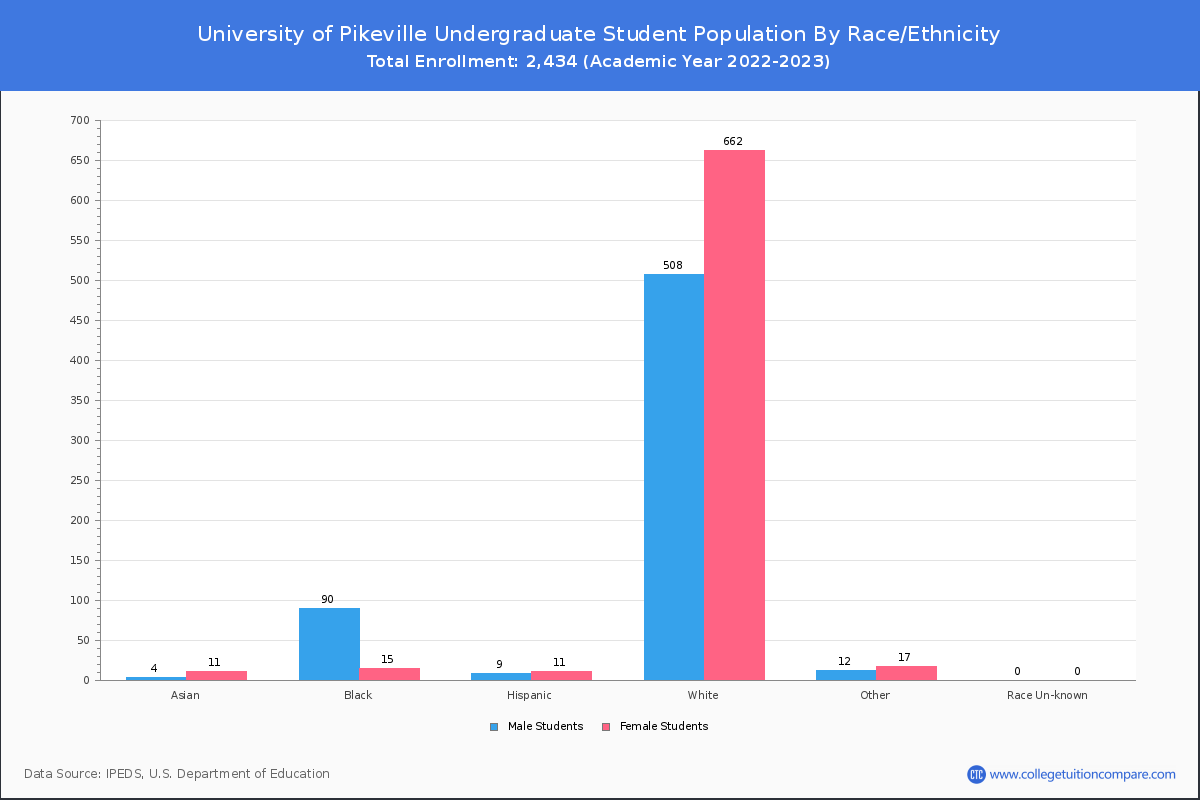
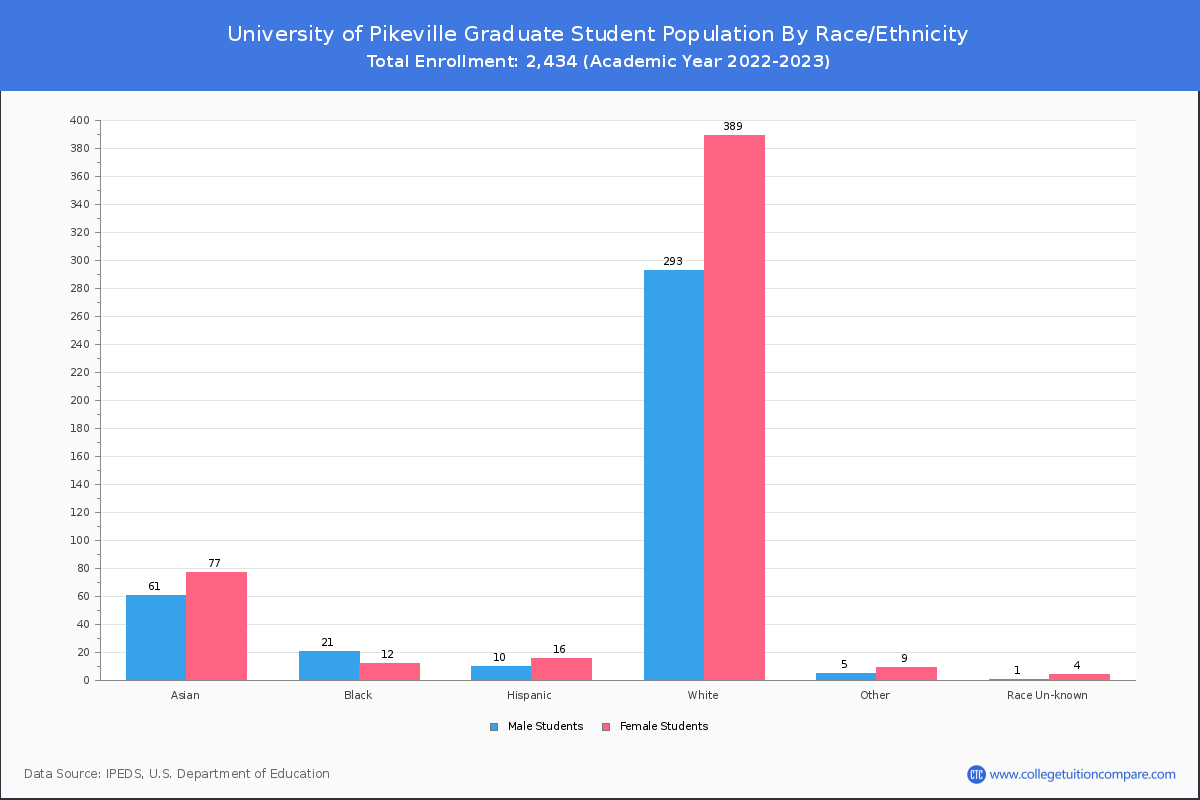
Student Distribution by Race/Ethnicity
By race/ethnicity, 1,965 White, 137 Black, and 173 Asian students out of a total of 2,434 are attending at University of Pikeville. Comprehensive enrollment statistic data by race/ethnicity is shown in the next chart (Academic year 2022-2023 data).
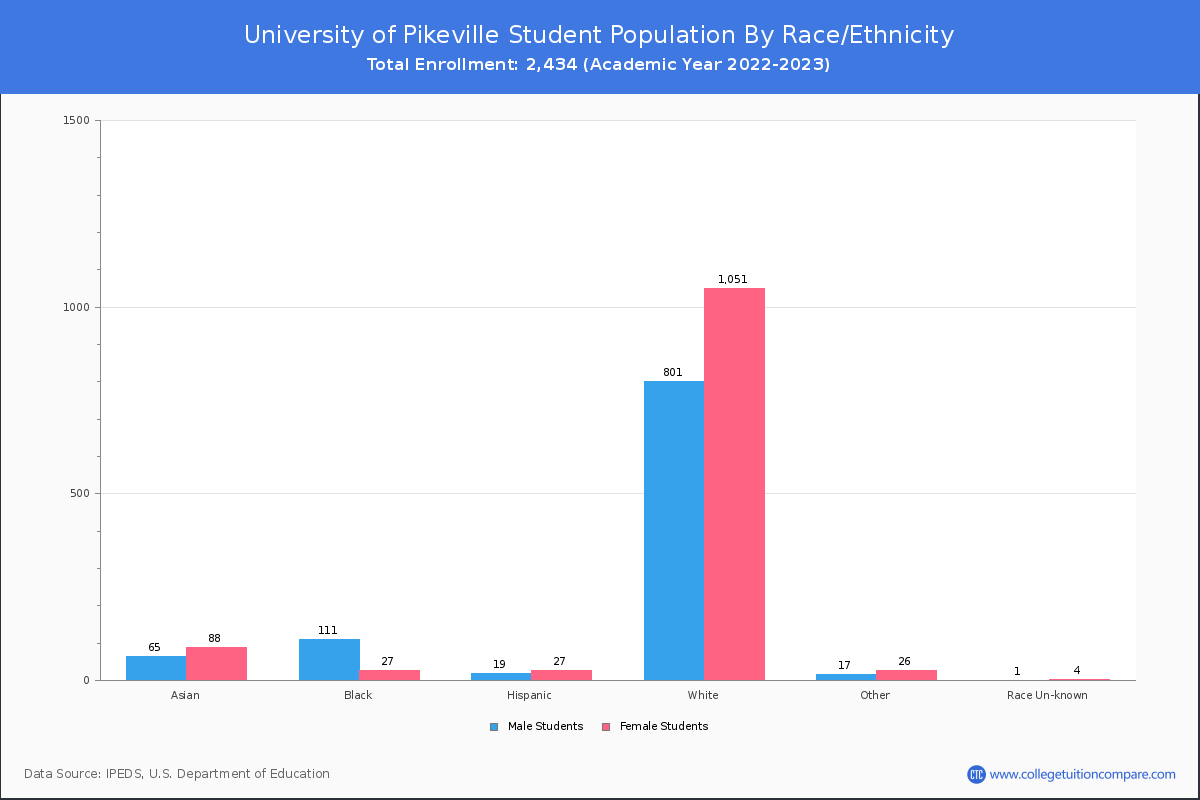
| Race | Total | Men | Women |
|---|---|---|---|
| American Indian or Native American | 18 | 5 | 13 |
| Asian | 173 | 78 | 95 |
| Black | 137 | 106 | 31 |
| Hispanic | 48 | 22 | 26 |
| Native Hawaiian or Other Pacific Islanders | 8 | 2 | 6 |
| White | 1,965 | 805 | 1,160 |
| Two or more races | 32 | 18 | 14 |
| Race Unknown | 11 | 4 | 7 |
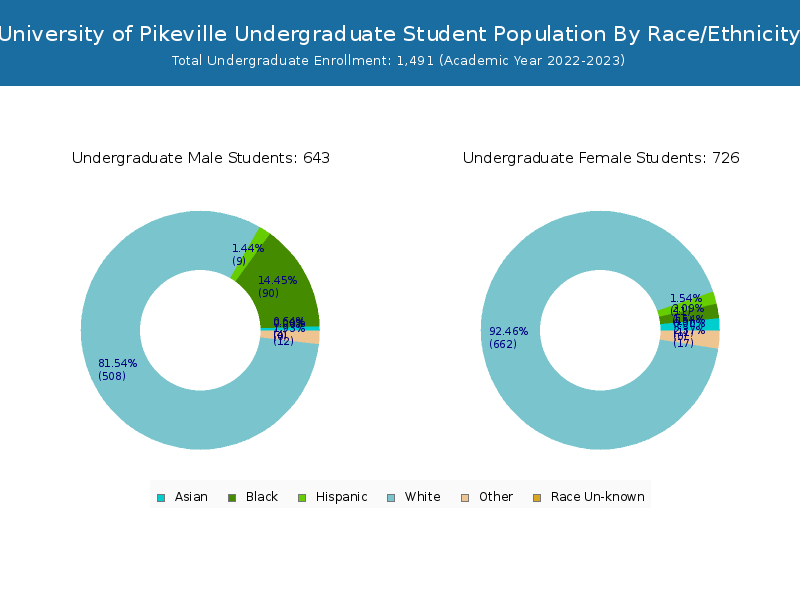
| Race | Total | Men | Women |
|---|---|---|---|
| American Indian or Native American | 12 | 3 | 9 |
| Asian | 22 | 8 | 14 |
| Black | 105 | 90 | 15 |
| Hispanic | 18 | 8 | 10 |
| Native Hawaiian or Other Pacific Islanders | 1 | 0 | 1 |
| White | 1,265 | 503 | 762 |
| Two or more races | 28 | 15 | 13 |
| Race Unknown | 0 | 0 | 0 |
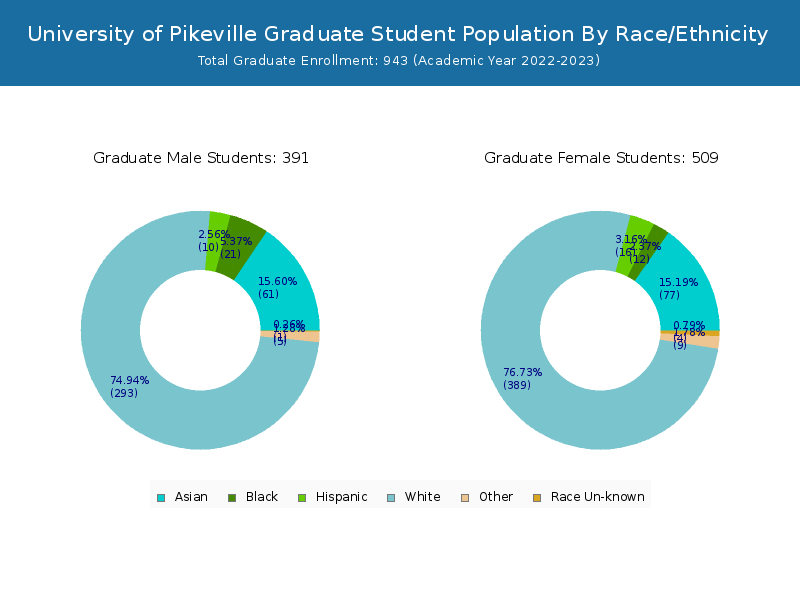
| Race | Total | Men | Women |
|---|---|---|---|
| American Indian or Native American | 0 | 0 | 0 |
| Asian | 2 | 2 | 0 |
| Black | 19 | 17 | 2 |
| Hispanic | 1 | 0 | 1 |
| Native Hawaiian or Other Pacific Islanders | 0 | 0 | 0 |
| White | 84 | 29 | 55 |
| Two or more races | 6 | 5 | 1 |
| Race Unknown | 0 | 0 | 0 |
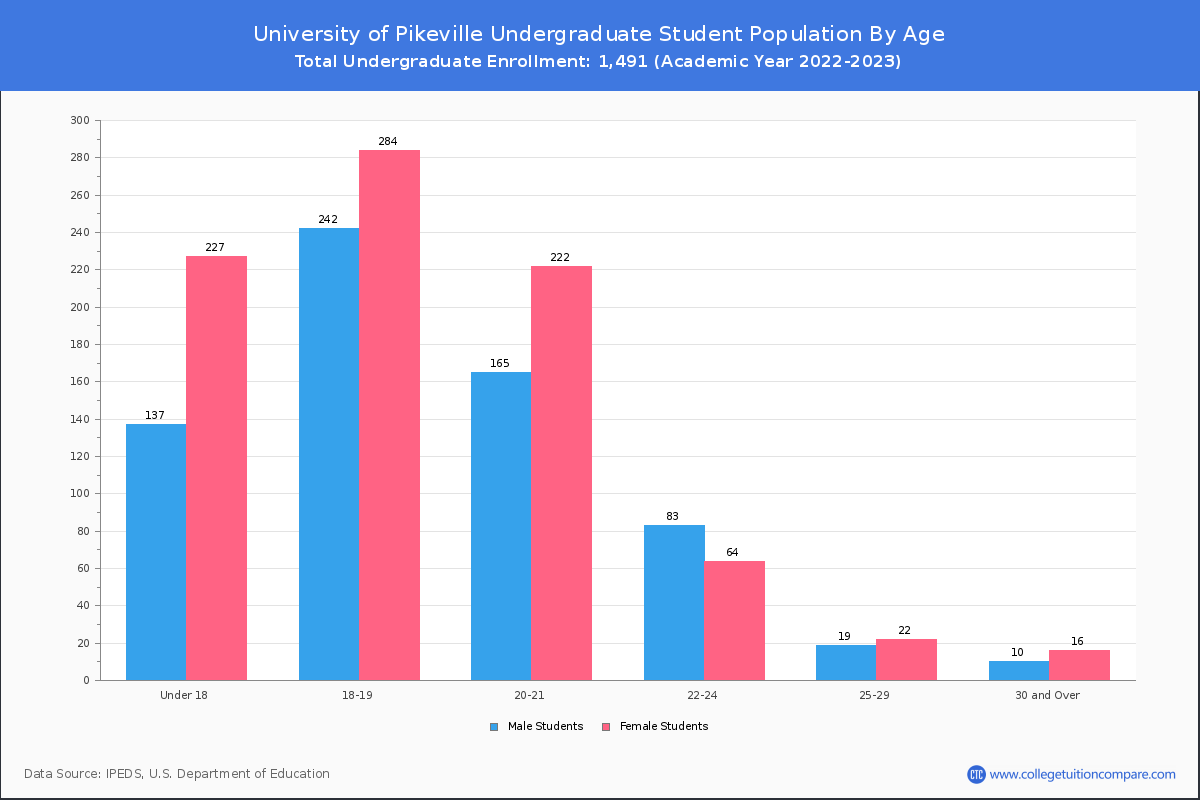
Student Age Distribution
There are 1,795 students under 25 years old, and 639 students over 25 years old out of 2,434 total students.
UPIKE has 1,424 undergraduate students aged under 25 and 67 students aged 25 and over.
It has 371 graduate students aged under 25 and 572 students aged 25 and over.
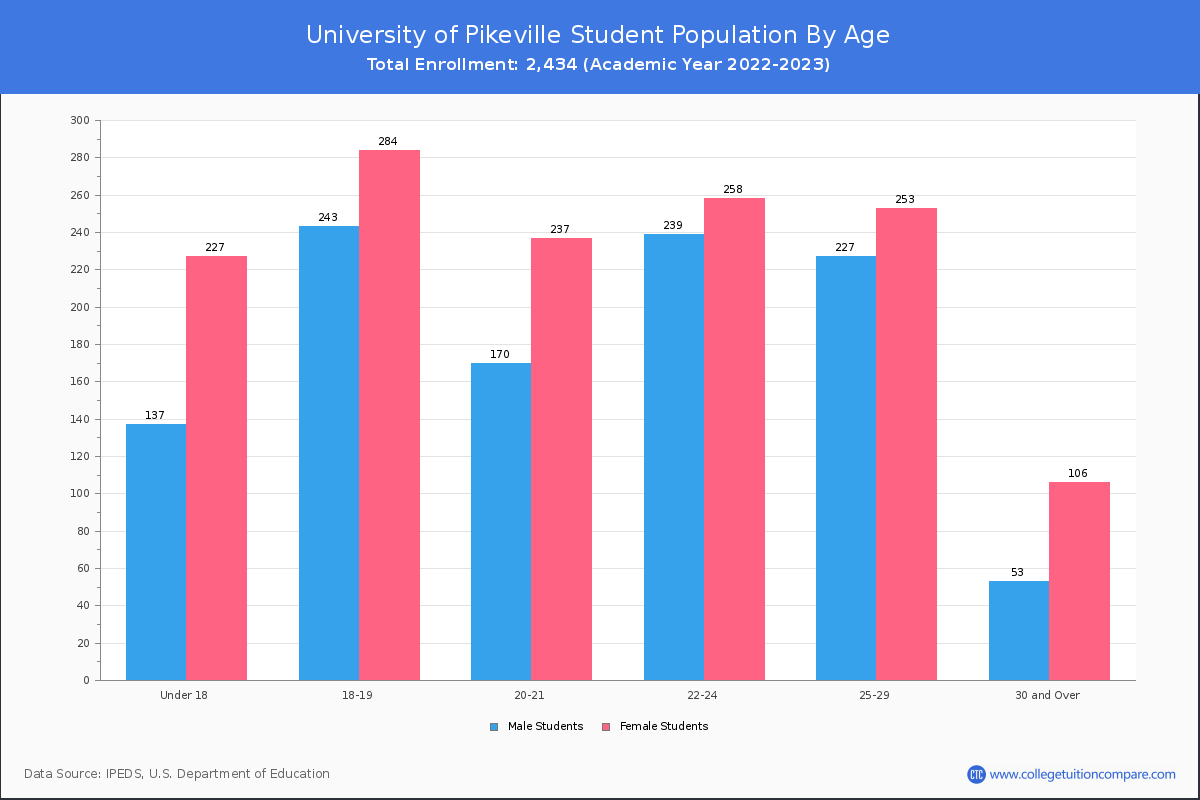
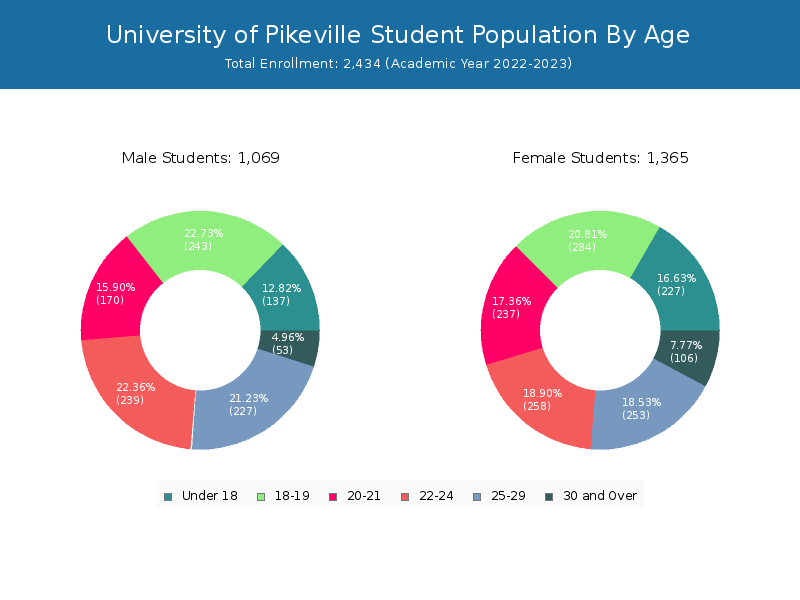


| Age | Total | Men | Women |
|---|---|---|---|
| Under 18 | 364 | 227 | 137 |
| 18-19 | 527 | 284 | 243 |
| 20-21 | 407 | 237 | 170 |
| 22-24 | 497 | 258 | 239 |
| 25-29 | 480 | 253 | 227 |
| 30-34 | 80 | 48 | 32 |
| 35-39 | 29 | 18 | 11 |
| 40-49 | 37 | 30 | 7 |
| 50-64 | 13 | 10 | 3 |
| Age | Total | Men | Women |
|---|---|---|---|
| Under 18 | 364 | 227 | 137 |
| 18-19 | 526 | 284 | 242 |
| 20-21 | 387 | 222 | 165 |
| 22-24 | 147 | 64 | 83 |
| 25-29 | 41 | 22 | 19 |
| 30-34 | 11 | 5 | 6 |
| 35-39 | 2 | 1 | 1 |
| 40-49 | 10 | 7 | 3 |
| 50-64 | 3 | 3 | 0 |
| Age | Total | Men | Women |
|---|
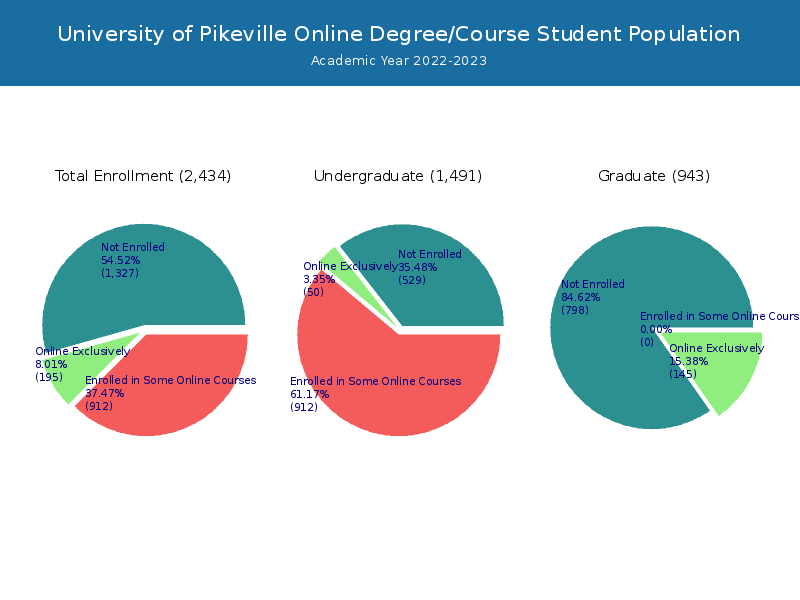
Online Student Enrollment
Distance learning, also called online education, is very attractive to students, especially who want to continue education and work in field. At University of Pikeville, 195 students are enrolled exclusively in online courses and 912 students are enrolled in some online courses.
140 students lived in Kentucky or jurisdiction in which the school is located are enrolled exclusively in online courses and 55 students live in other State or outside of the United States.
| All Students | Enrolled Exclusively Online Courses | Enrolled in Some Online Courses | |
|---|---|---|---|
| All Students | 2,434 | 195 | 912 |
| Undergraduate | 1,491 | 50 | 912 |
| Graduate | 943 | 145 | 0 |
| Kentucky Residents | Other States in U.S. | Outside of U.S. | |
|---|---|---|---|
| All Students | 140 | 55 | 0 |
| Undergraduate | 47 | 3 | 0 |
| Graduate | 93 | 52 | 0 |
Transfer-in Students (Undergraduate)
Among 1,491 enrolled in undergraduate programs, 121 students have transferred-in from other institutions. The percentage of transfer-in students is 8.12%.117 students have transferred in as full-time status and 4 students transferred in as part-time status.
| Number of Students | |
|---|---|
| Regular Full-time | 963 |
| Transfer-in Full-time | 117 |
| Regular Part-time | 407 |
| Transfer-in Part-time | 4 |