Student Population by Gender
Northern Kentucky University has a total of 15,801 enrolled students for the academic year 2022-2023. 10,776 students have enrolled in undergraduate programs and 5,025 students joined graduate programs.
By gender, 5,729 male and 10,072 female students (the male-female ratio is 36:64) are attending the school. The gender distribution is based on the 2022-2023 data.
| Total | Undergraduate | Graduate | |
|---|---|---|---|
| Total | 15,801 | 10,776 | 5,025 |
| Men | 5,729 | 4,361 | 1,368 |
| Women | 10,072 | 6,415 | 3,657 |
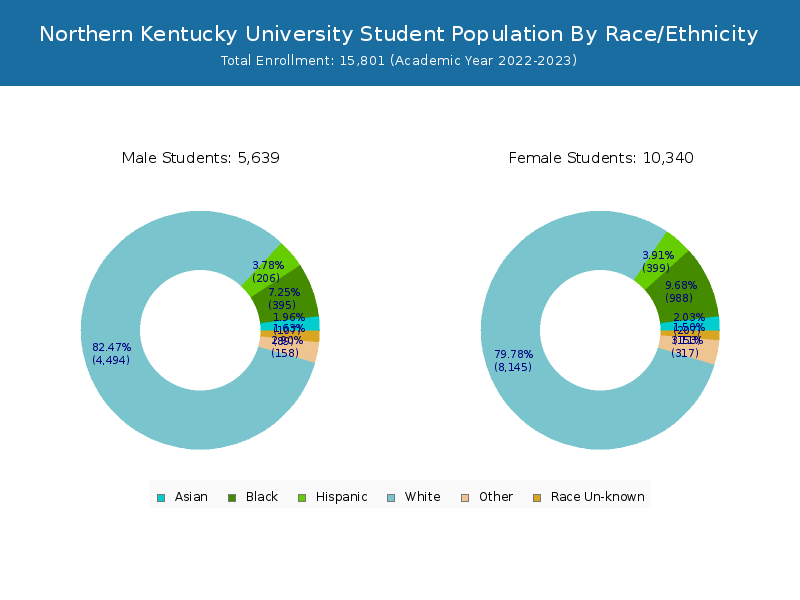
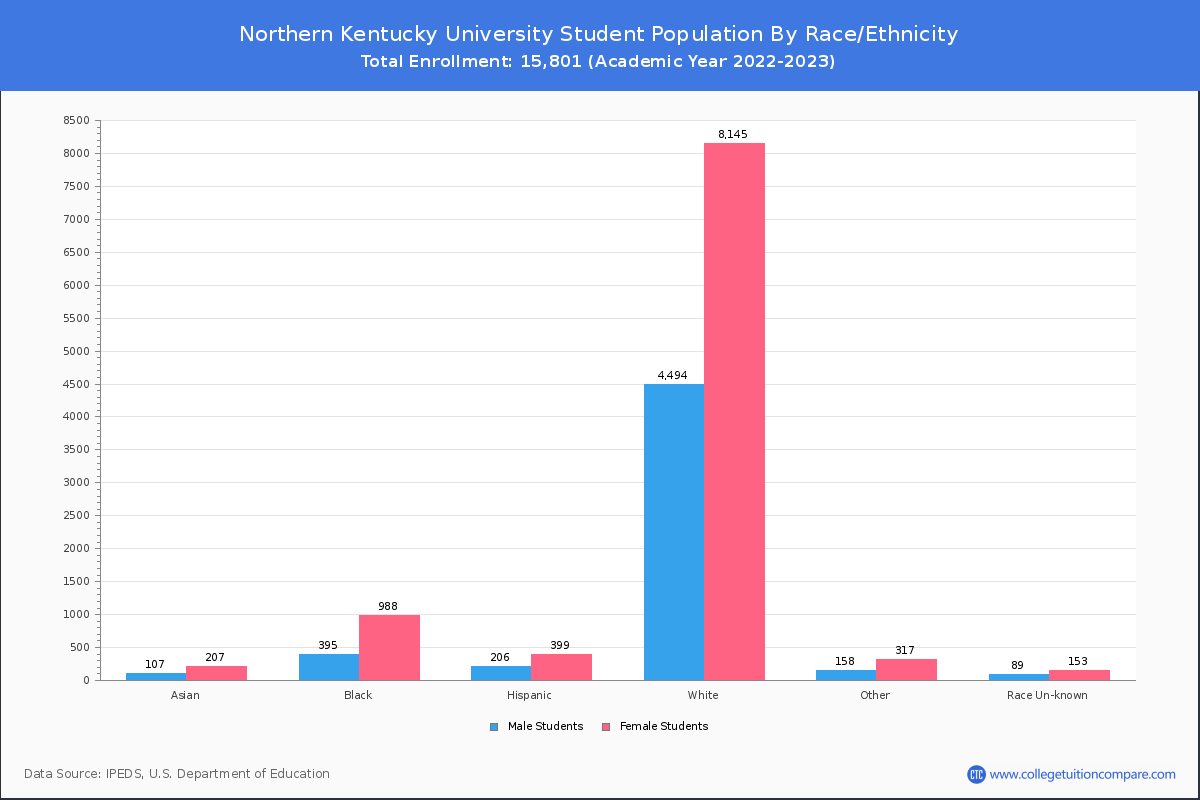
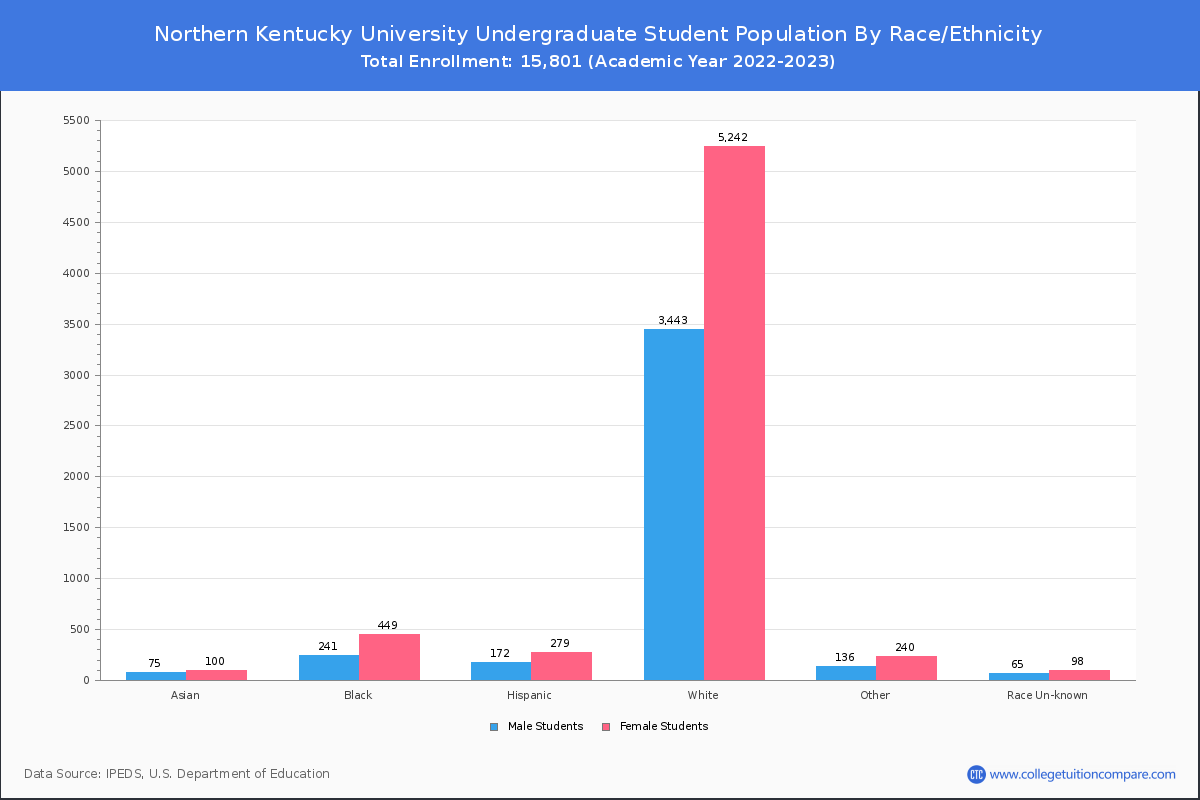
Student Distribution by Race/Ethnicity
By race/ethnicity, 12,124 White, 1,378 Black, and 326 Asian students out of a total of 15,801 are attending at Northern Kentucky University. Comprehensive enrollment statistic data by race/ethnicity is shown in the next chart (Academic year 2022-2023 data).
| Race | Total | Men | Women |
|---|---|---|---|
| American Indian or Native American | 20 | 8 | 12 |
| Asian | 326 | 128 | 198 |
| Black | 1,378 | 394 | 984 |
| Hispanic | 663 | 229 | 434 |
| Native Hawaiian or Other Pacific Islanders | 17 | 8 | 9 |
| White | 12,124 | 4,401 | 7,723 |
| Two or more races | 440 | 139 | 301 |
| Race Unknown | 346 | 145 | 201 |
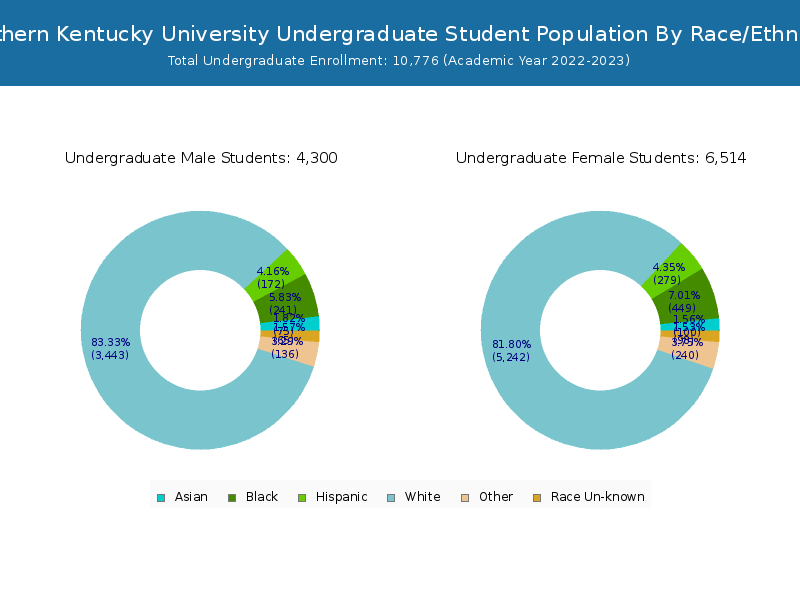
| Race | Total | Men | Women |
|---|---|---|---|
| American Indian or Native American | 14 | 6 | 8 |
| Asian | 179 | 83 | 96 |
| Black | 668 | 224 | 444 |
| Hispanic | 477 | 180 | 297 |
| Native Hawaiian or Other Pacific Islanders | 13 | 7 | 6 |
| White | 8,387 | 3,382 | 5,005 |
| Two or more races | 346 | 119 | 227 |
| Race Unknown | 260 | 109 | 151 |
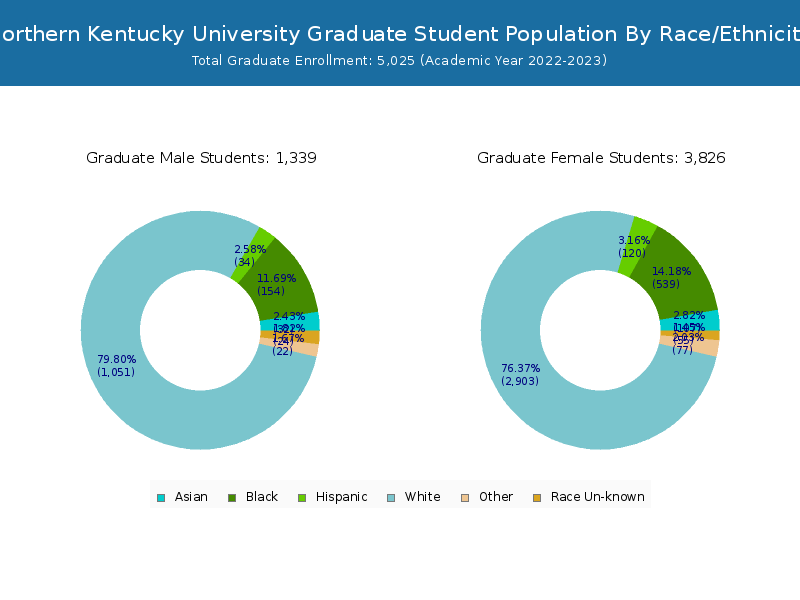
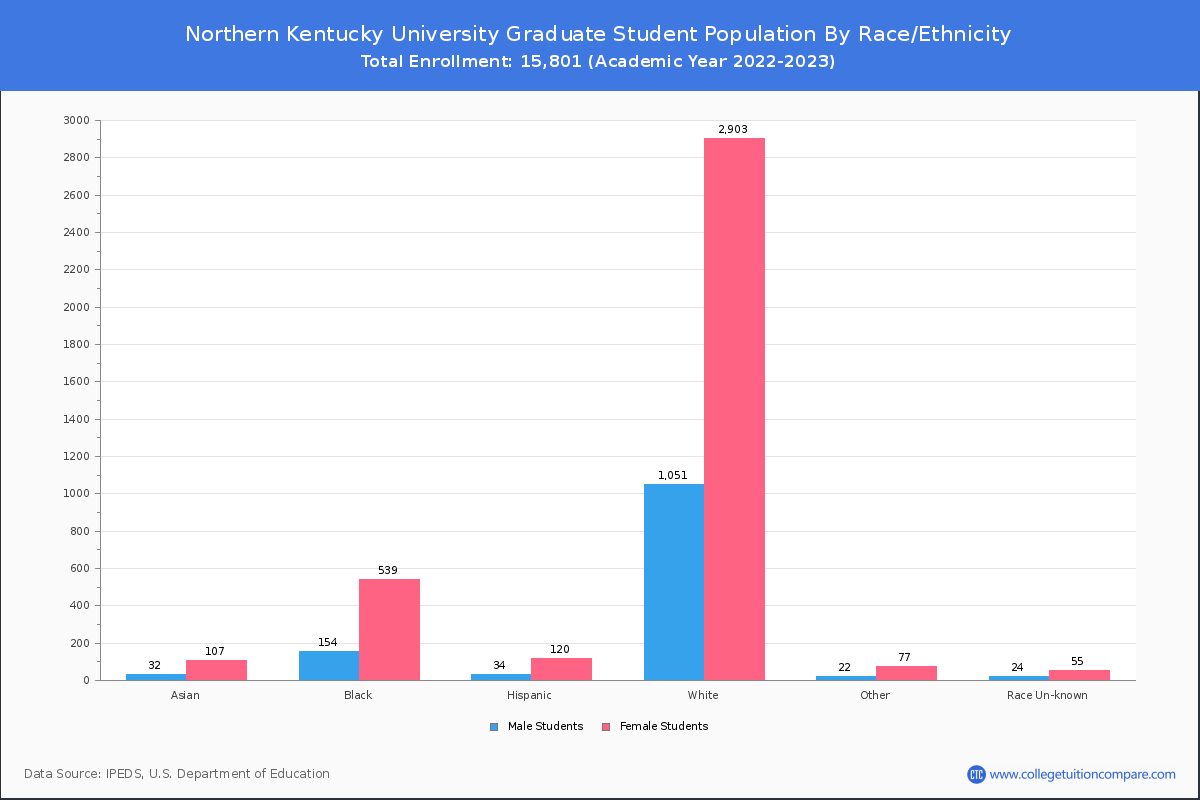
| Race | Total | Men | Women |
|---|---|---|---|
| American Indian or Native American | 2 | 2 | 0 |
| Asian | 10 | 3 | 7 |
| Black | 55 | 19 | 36 |
| Hispanic | 27 | 10 | 17 |
| Native Hawaiian or Other Pacific Islanders | 0 | 0 | 0 |
| White | 512 | 190 | 322 |
| Two or more races | 28 | 9 | 19 |
| Race Unknown | 7 | 2 | 5 |
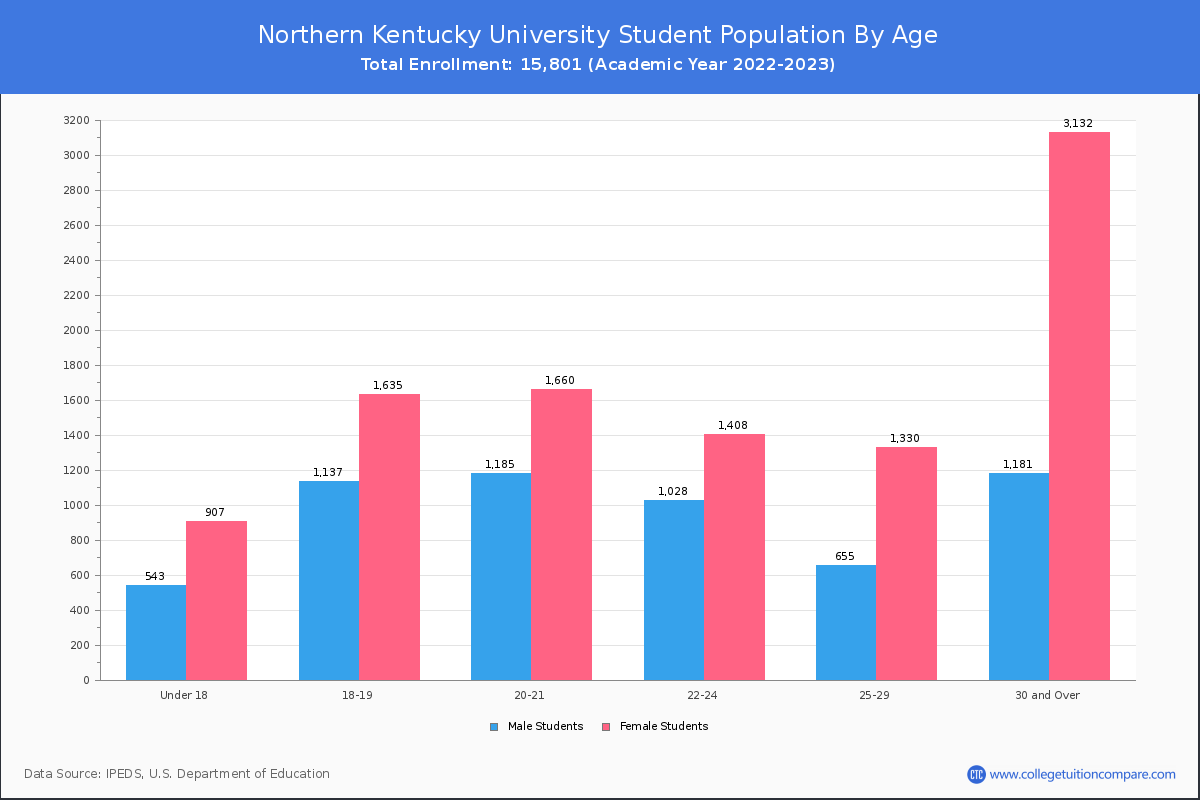
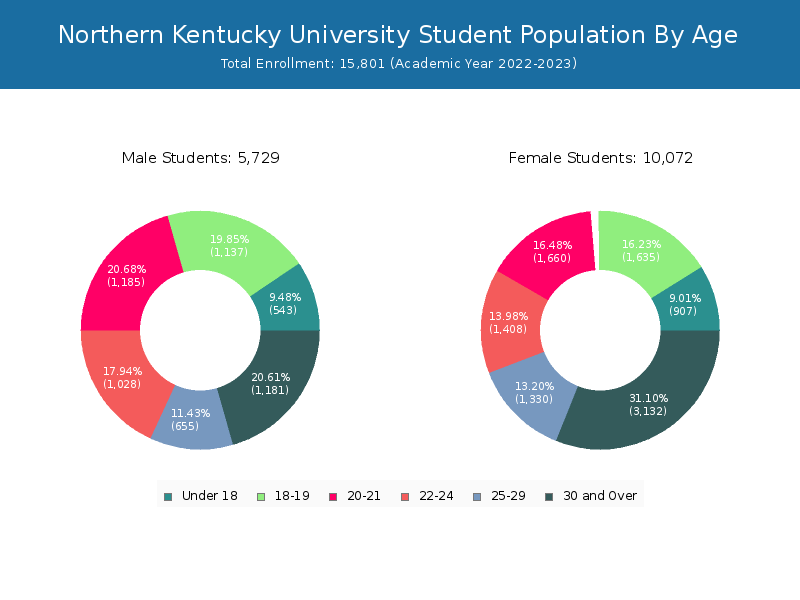
Student Age Distribution
By age, NKU has 1,450 students under 18 years old and 63 students over 65 years old. There are 9,503 students under 25 years old, and 6,298 students over 25 years old out of 15,801 total students.
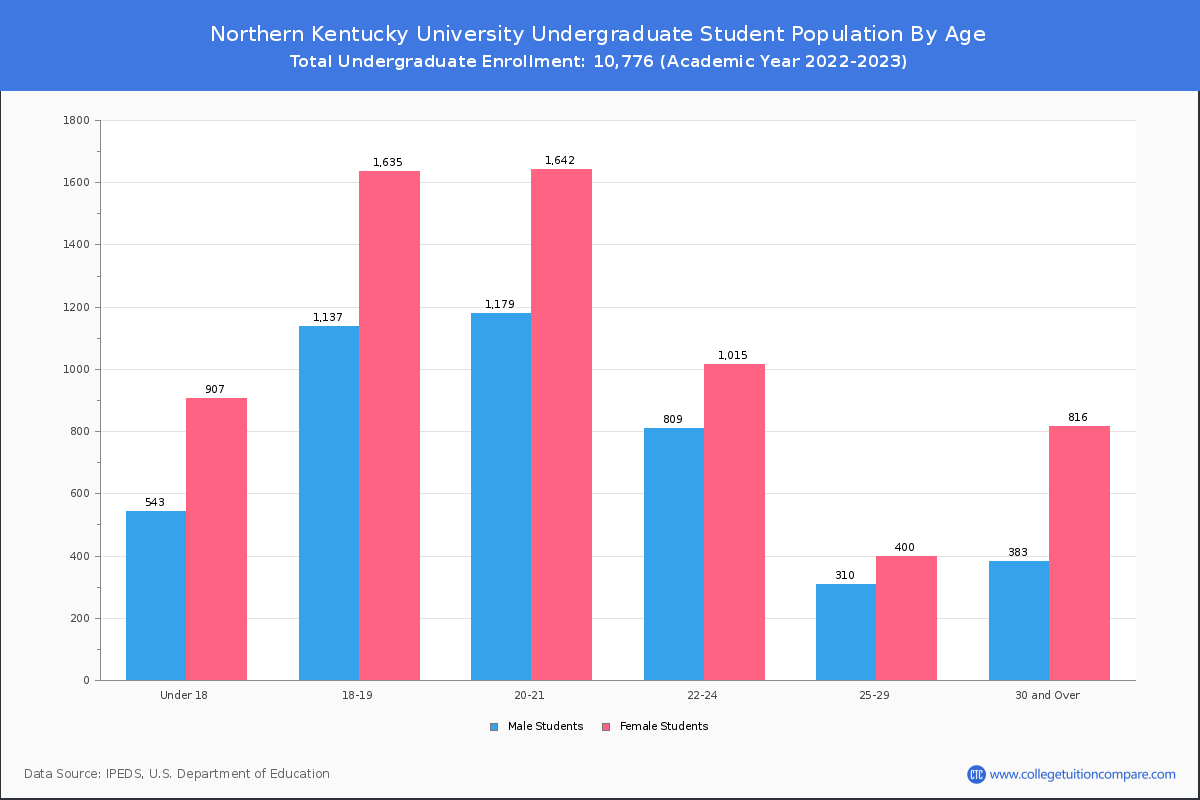
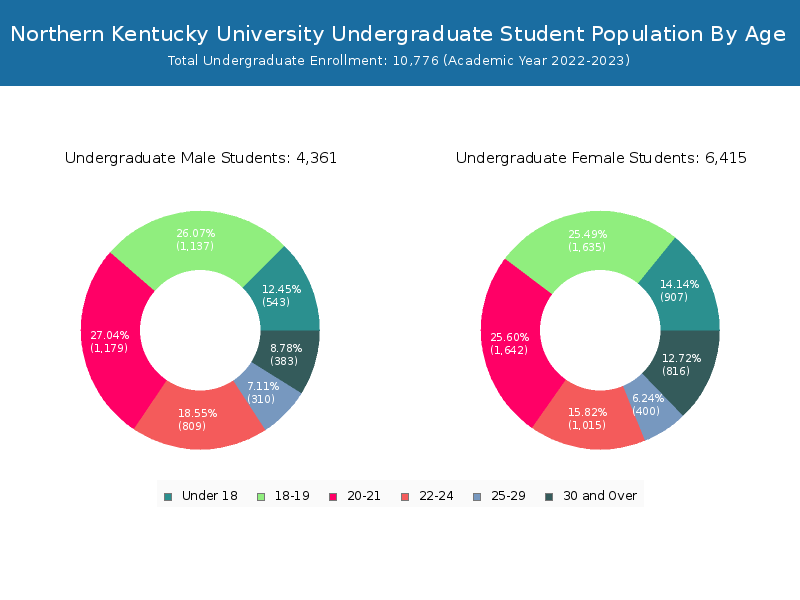
In undergraduate programs, 1,450 students are younger than 18 and 35 students are older than 65. NKU has 8,867 undergraduate students aged under 25 and 1,909 students aged 25 and over.
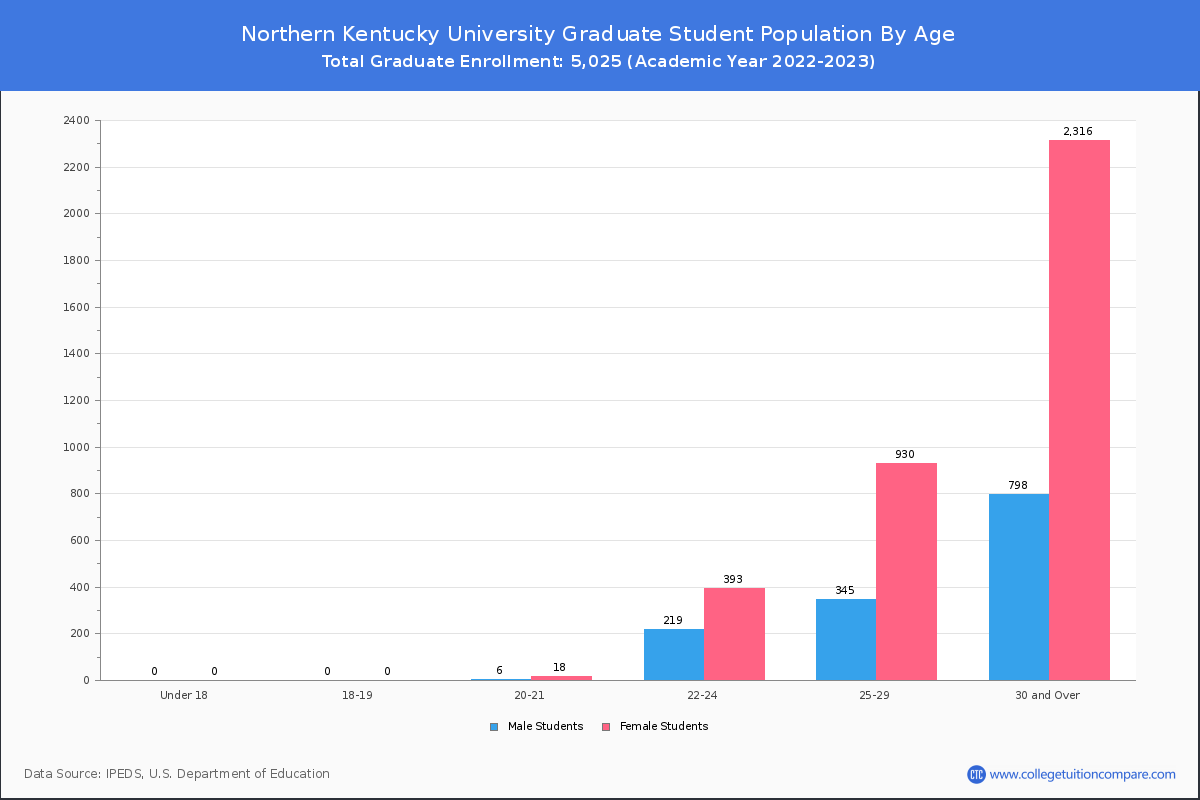
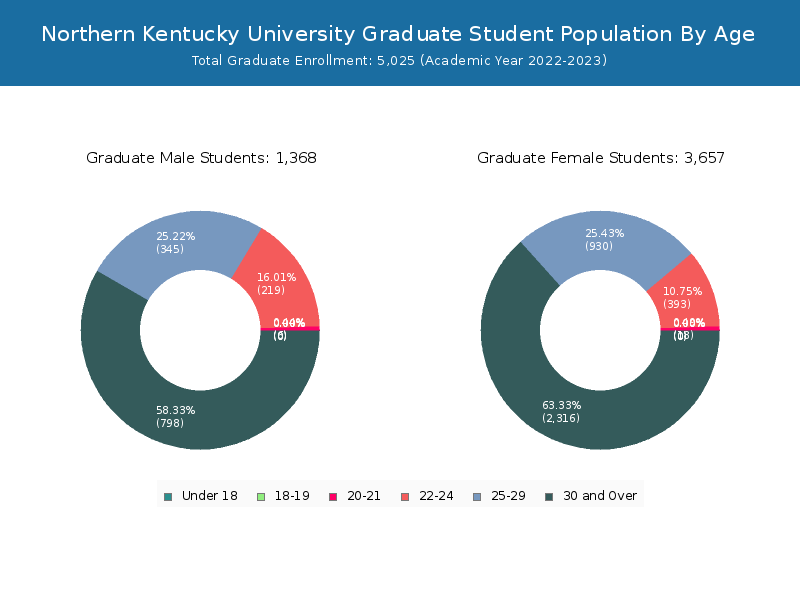
It has 636 graduate students aged under 25 and 4,389 students aged 25 and over.
| Age | Total | Men | Women |
|---|---|---|---|
| Under 18 | 1,450 | 907 | 543 |
| 18-19 | 2,772 | 1,635 | 1,137 |
| 20-21 | 2,845 | 1,660 | 1,185 |
| 22-24 | 2,436 | 1,408 | 1,028 |
| 25-29 | 1,985 | 1,330 | 655 |
| 30-34 | 1,321 | 913 | 408 |
| 35-39 | 1,018 | 736 | 282 |
| 40-49 | 1,338 | 1,017 | 321 |
| 50-64 | 573 | 432 | 141 |
| Over 65 | 63 | 34 | 29 |
| Age | Total | Men | Women |
|---|---|---|---|
| Under 18 | 1,450 | 907 | 543 |
| 18-19 | 2,772 | 1,635 | 1,137 |
| 20-21 | 2,821 | 1,642 | 1,179 |
| 22-24 | 1,824 | 1,015 | 809 |
| 25-29 | 710 | 400 | 310 |
| 30-34 | 402 | 251 | 151 |
| 35-39 | 287 | 204 | 83 |
| 40-49 | 342 | 247 | 95 |
| 50-64 | 133 | 99 | 34 |
| Over 65 | 35 | 15 | 20 |
| Age | Total | Men | Women |
|---|
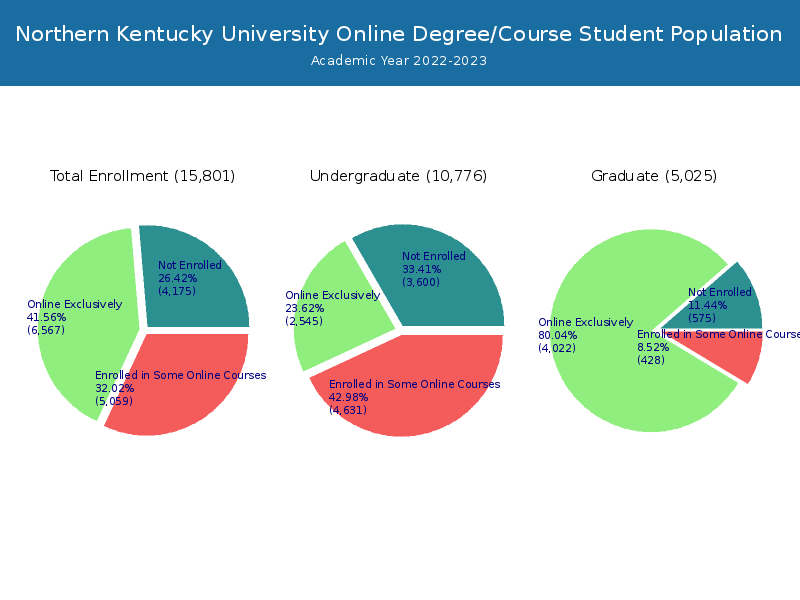
Online Student Enrollment
Distance learning, also called online education, is very attractive to students, especially who want to continue education and work in field. At Northern Kentucky University, 6,567 students are enrolled exclusively in online courses and 5,059 students are enrolled in some online courses.
3,747 students lived in Kentucky or jurisdiction in which the school is located are enrolled exclusively in online courses and 2,820 students live in other State or outside of the United States.
| All Students | Enrolled Exclusively Online Courses | Enrolled in Some Online Courses | |
|---|---|---|---|
| All Students | 15,801 | 6,567 | 5,059 |
| Undergraduate | 10,776 | 2,545 | 4,631 |
| Graduate | 5,025 | 4,022 | 428 |
| Kentucky Residents | Other States in U.S. | Outside of U.S. | |
|---|---|---|---|
| All Students | 3,747 | 2,809 | 11 |
| Undergraduate | 1,975 | 564 | 6 |
| Graduate | 1,772 | 2,245 | 5 |
Transfer-in Students (Undergraduate)
Among 10,776 enrolled in undergraduate programs, 650 students have transferred-in from other institutions. The percentage of transfer-in students is 6.03%.432 students have transferred in as full-time status and 218 students transferred in as part-time status.
| Number of Students | |
|---|---|
| Regular Full-time | 6,980 |
| Transfer-in Full-time | 432 |
| Regular Part-time | 3,146 |
| Transfer-in Part-time | 218 |