Student Population by Gender
Morehead State University has a total of 8,807 enrolled students for the academic year 2022-2023. 8,215 students have enrolled in undergraduate programs and 592 students joined graduate programs.
By gender, 3,409 male and 5,398 female students (the male-female ratio is 39:61) are attending the school. The gender distribution is based on the 2022-2023 data.
| Total | Undergraduate | Graduate | |
|---|---|---|---|
| Total | 8,807 | 8,215 | 592 |
| Men | 3,409 | 3,170 | 239 |
| Women | 5,398 | 5,045 | 353 |
Student Distribution by Race/Ethnicity
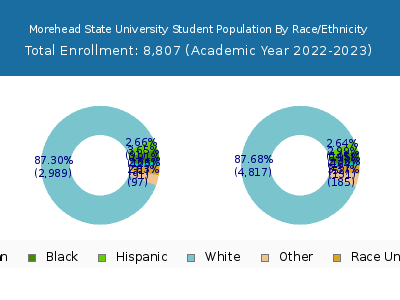
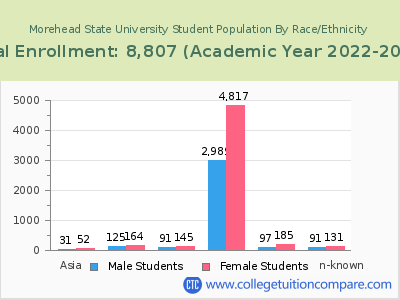
| Race | Total | Men | Women |
|---|---|---|---|
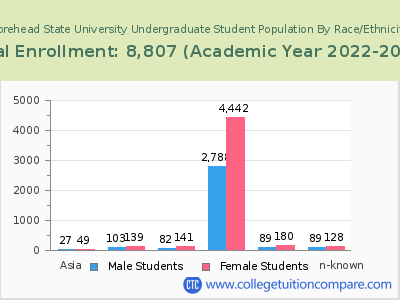
| American Indian or Native American | 10 | 7 | 3 |
| Asian | 103 | 42 | 61 |
| Black | 269 | 120 | 149 |
| Hispanic | 252 | 94 | 158 |
| Native Hawaiian or Other Pacific Islanders | 6 | 3 | 3 |
| White | 7,335 | 2,807 | 4,528 |
| Two or more races | 286 | 111 | 175 |
| Race Unknown | 494 | 198 | 296 |
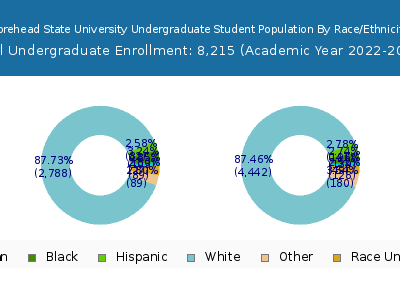
| Race | Total | Men | Women |
|---|---|---|---|
| American Indian or Native American | 10 | 7 | 3 |
| Asian | 95 | 38 | 57 |
| Black | 228 | 102 | 126 |
| Hispanic | 243 | 88 | 155 |
| Native Hawaiian or Other Pacific Islanders | 4 | 2 | 2 |
| White | 6,824 | 2,608 | 4,216 |
| Two or more races | 273 | 104 | 169 |
| Race Unknown | 490 | 197 | 293 |
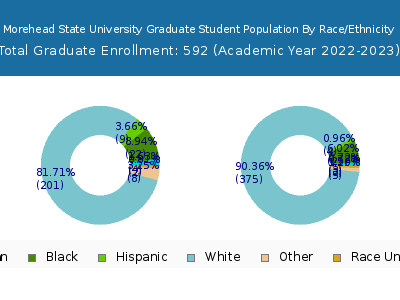
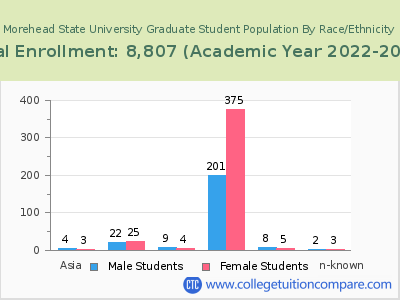
| Race | Total | Men | Women |
|---|---|---|---|
| American Indian or Native American | 0 | 0 | 0 |
| Asian | 2 | 2 | 0 |
| Black | 12 | 8 | 4 |
| Hispanic | 8 | 6 | 2 |
| Native Hawaiian or Other Pacific Islanders | 0 | 0 | 0 |
| White | 223 | 81 | 142 |
| Two or more races | 5 | 3 | 2 |
| Race Unknown | 4 | 2 | 2 |
Student Age Distribution
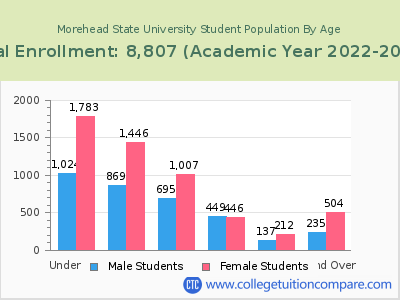
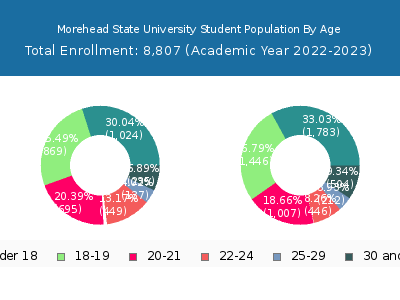
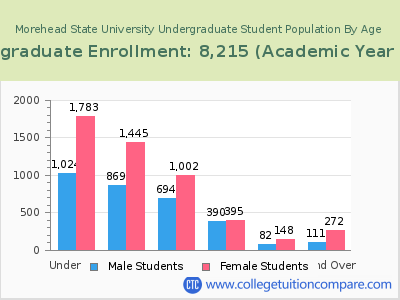
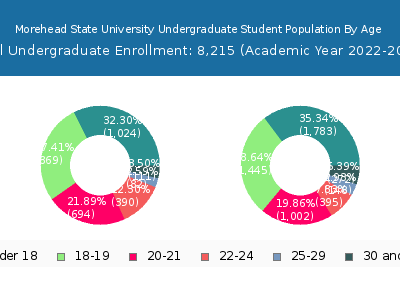
By age, Morehead State has 2,807 students under 18 years old and 28 students over 65 years old. There are 7,719 students under 25 years old, and 1,088 students over 25 years old out of 8,807 total students.
In undergraduate programs, 2,807 students are younger than 18 and 20 students are older than 65. Morehead State has 7,602 undergraduate students aged under 25 and 613 students aged 25 and over.
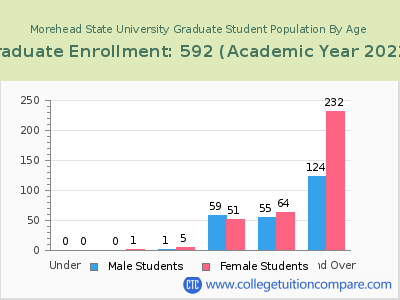
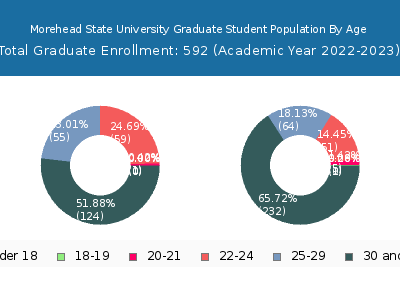
It has 117 graduate students aged under 25 and 475 students aged 25 and over.
| Age | Total | Men | Women |
|---|---|---|---|
| Under 18 | 2,807 | 1,783 | 1,024 |
| 18-19 | 2,315 | 1,446 | 869 |
| 20-21 | 1,702 | 1,007 | 695 |
| 22-24 | 895 | 446 | 449 |
| 25-29 | 349 | 212 | 137 |
| 30-34 | 225 | 160 | 65 |
| 35-39 | 162 | 116 | 46 |
| 40-49 | 235 | 165 | 70 |
| 50-64 | 89 | 53 | 36 |
| Over 65 | 28 | 10 | 18 |
| Age | Total | Men | Women |
|---|---|---|---|
| Under 18 | 2,807 | 1,783 | 1,024 |
| 18-19 | 2,314 | 1,445 | 869 |
| 20-21 | 1,696 | 1,002 | 694 |
| 22-24 | 785 | 395 | 390 |
| 25-29 | 230 | 148 | 82 |
| 30-34 | 139 | 106 | 33 |
| 35-39 | 96 | 70 | 26 |
| 40-49 | 91 | 67 | 24 |
| 50-64 | 37 | 23 | 14 |
| Over 65 | 20 | 6 | 14 |
| Age | Total | Men | Women |
|---|
Online Student Enrollment
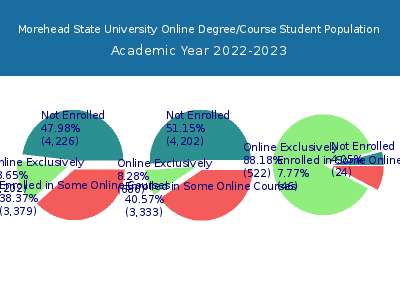
Distance learning, also called online education, is very attractive to students, especially who want to continue education and work in field. At Morehead State University, 1,202 students are enrolled exclusively in online courses and 3,379 students are enrolled in some online courses.
1,077 students lived in Kentucky or jurisdiction in which the school is located are enrolled exclusively in online courses and 125 students live in other State or outside of the United States.
| All Students | Enrolled Exclusively Online Courses | Enrolled in Some Online Courses | |
|---|---|---|---|
| All Students | 8,807 | 1,202 | 3,379 |
| Undergraduate | 8,215 | 680 | 3,333 |
| Graduate | 592 | 522 | 46 |
| Kentucky Residents | Other States in U.S. | Outside of U.S. | |
|---|---|---|---|
| All Students | 1,077 | 124 | 1 |
| Undergraduate | 621 | 58 | 1 |
| Graduate | 456 | 66 | 0 |
Transfer-in Students (Undergraduate)
Among 8,215 enrolled in undergraduate programs, 257 students have transferred-in from other institutions. The percentage of transfer-in students is 3.13%.196 students have transferred in as full-time status and 61 students transferred in as part-time status.
| Number of Students | |
|---|---|
| Regular Full-time | 4,307 |
| Transfer-in Full-time | 196 |
| Regular Part-time | 3,651 |
| Transfer-in Part-time | 61 |
