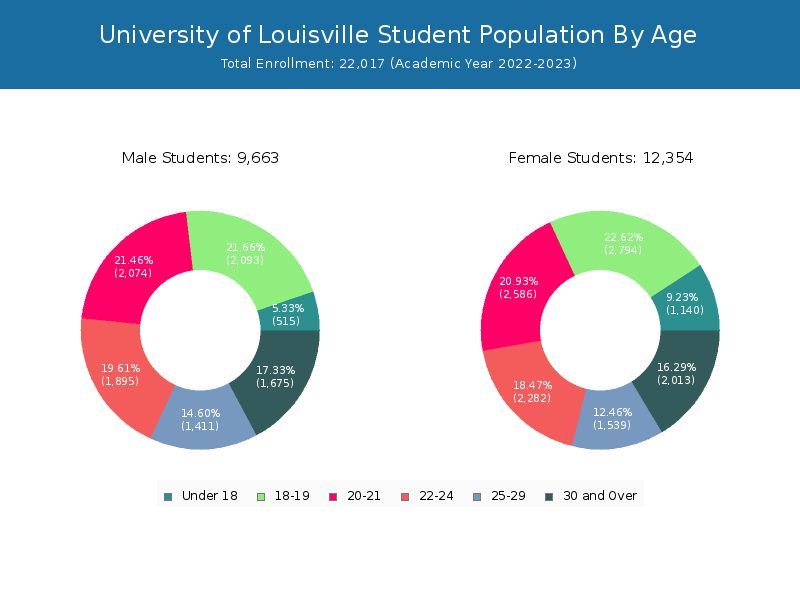
Student Population by Gender
University of Louisville has a total of 22,017 enrolled students for the academic year 2022-2023. 15,921 students have enrolled in undergraduate programs and 6,096 students joined graduate programs.
By gender, 9,663 male and 12,354 female students (the male-female ratio is 44:56) are attending the school. The gender distribution is based on the 2022-2023 data.
| Total | Undergraduate | Graduate | |
|---|---|---|---|
| Total | 22,017 | 15,921 | 6,096 |
| Men | 9,663 | 6,907 | 2,756 |
| Women | 12,354 | 9,014 | 3,340 |
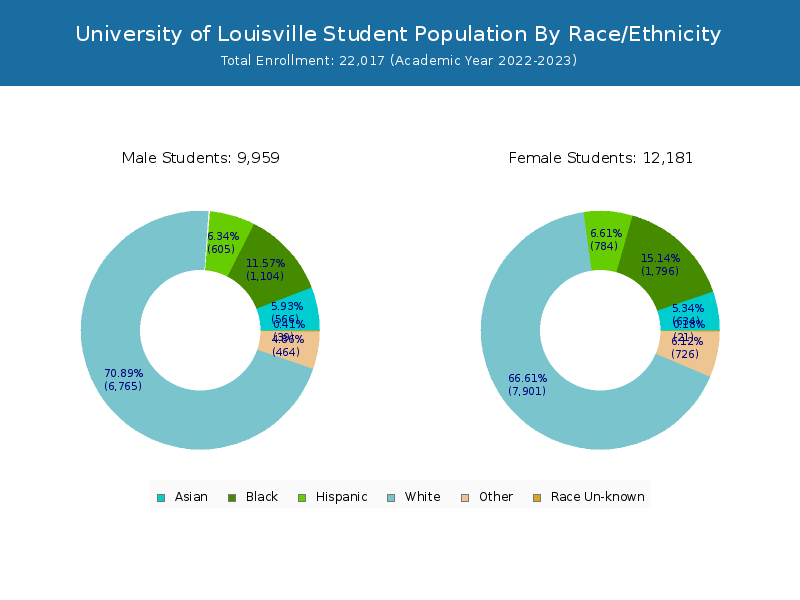
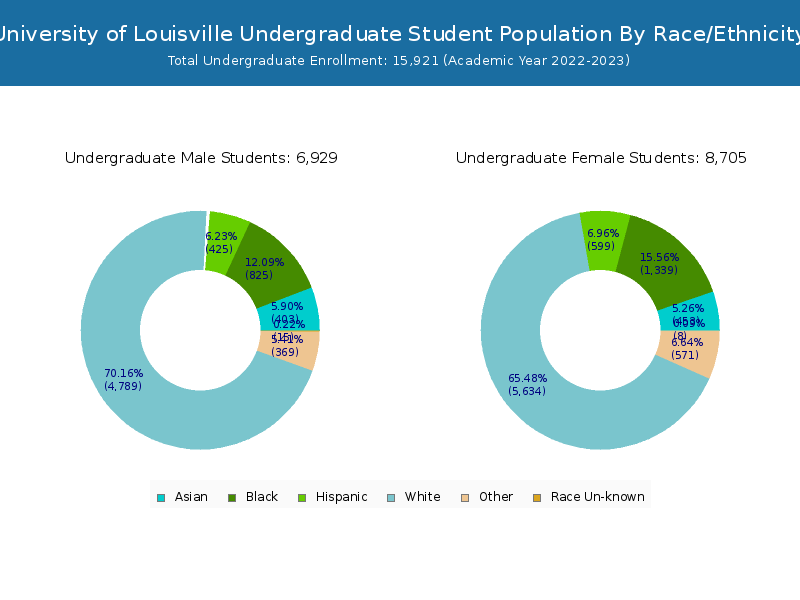
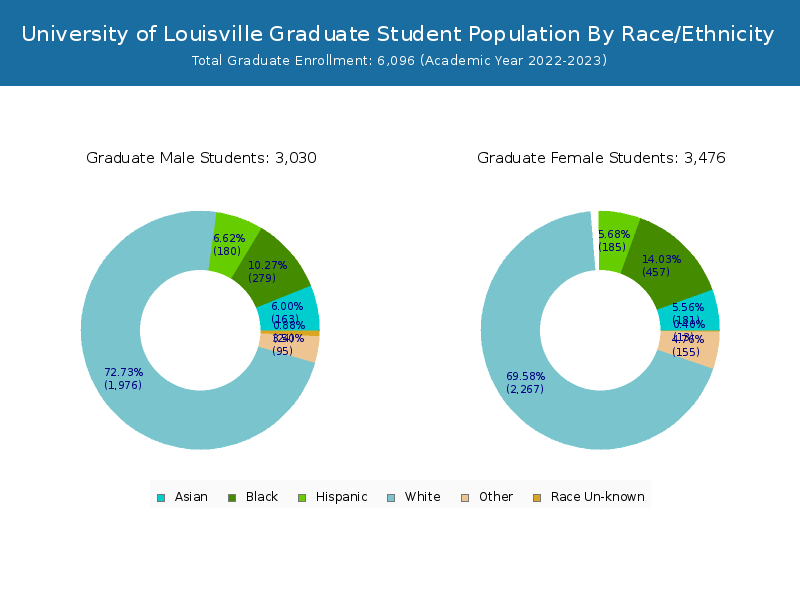
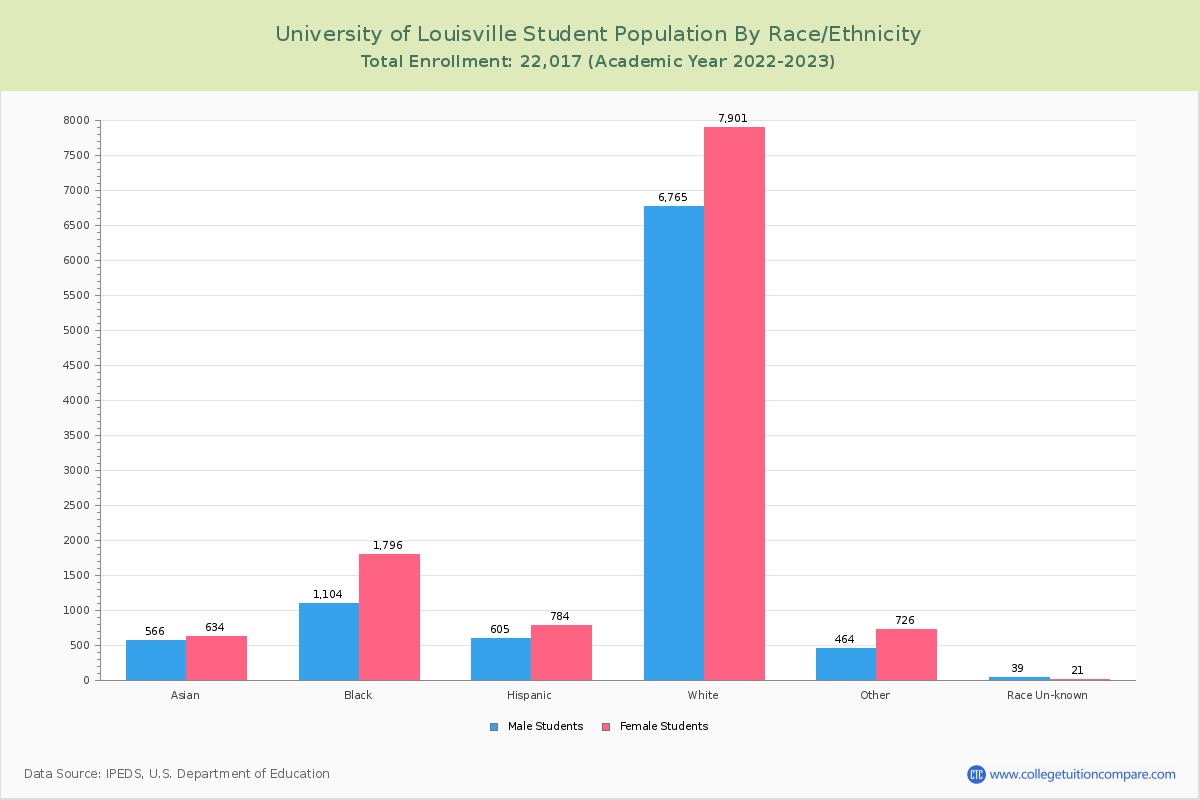
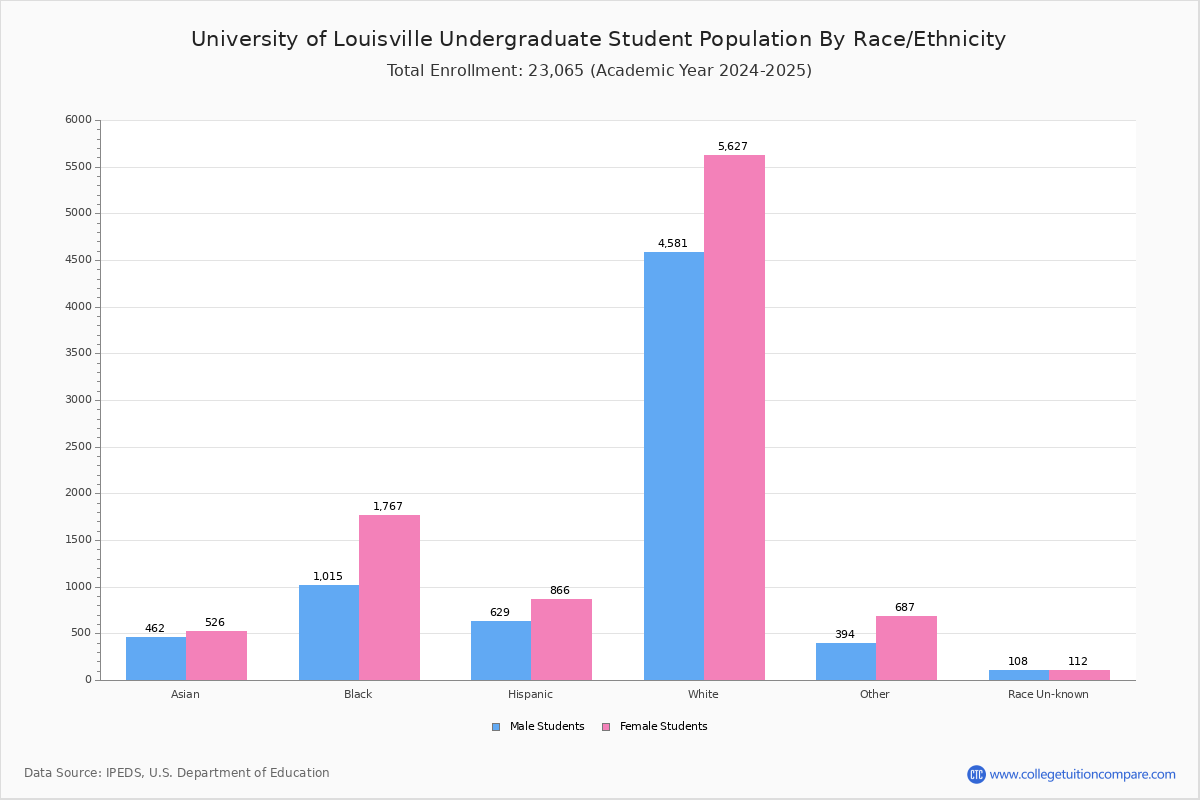
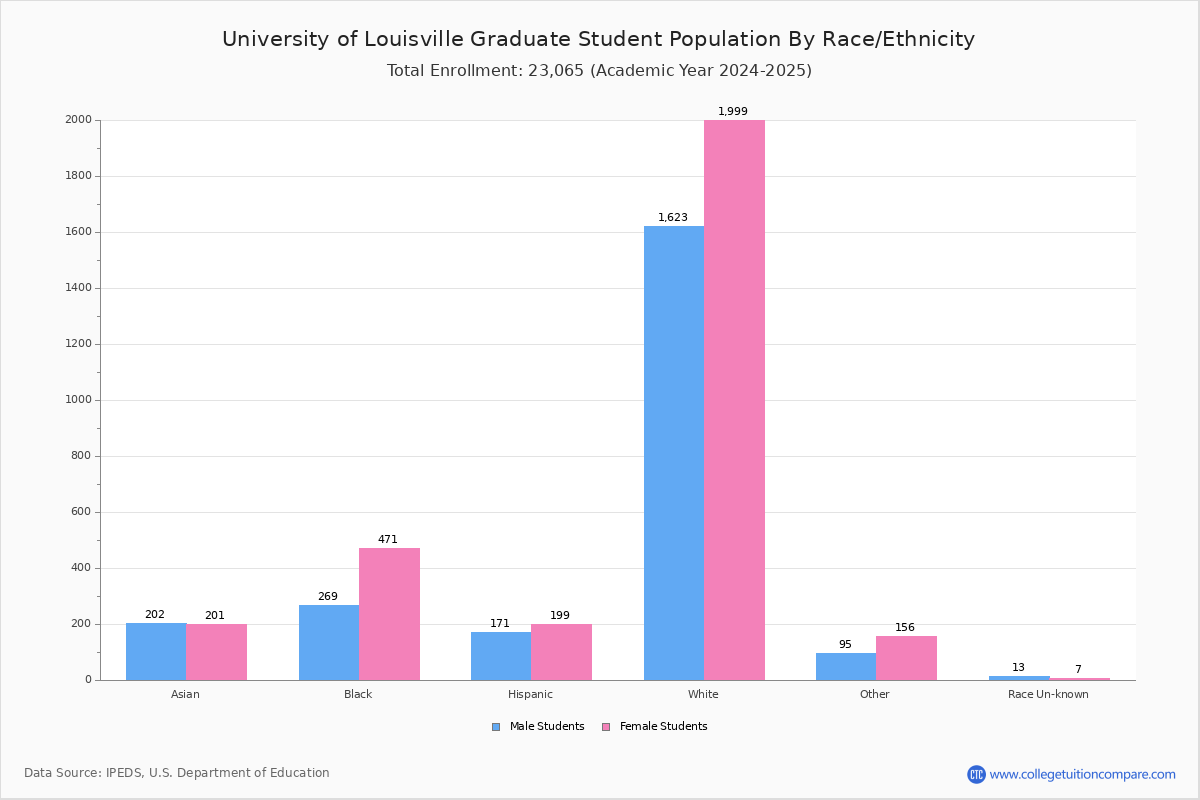
Student Distribution by Race/Ethnicity
By race/ethnicity, 14,067 White, 3,138 Black, and 1,237 Asian students out of a total of 22,017 are attending at University of Louisville. Comprehensive enrollment statistic data by race/ethnicity is shown in the next chart (Academic year 2022-2023 data).
| Race | Total | Men | Women |
|---|---|---|---|
| American Indian or Native American | 35 | 14 | 21 |
| Asian | 1,237 | 576 | 661 |
| Black | 3,138 | 1,159 | 1,979 |
| Hispanic | 1,520 | 643 | 877 |
| Native Hawaiian or Other Pacific Islanders | 11 | 5 | 6 |
| White | 14,067 | 6,367 | 7,700 |
| Two or more races | 1,171 | 430 | 741 |
| Race Unknown | 85 | 44 | 41 |
| Race | Total | Men | Women |
|---|---|---|---|
| American Indian or Native American | 23 | 8 | 15 |
| Asian | 900 | 429 | 471 |
| Black | 2,438 | 897 | 1,541 |
| Hispanic | 1,163 | 468 | 695 |
| Native Hawaiian or Other Pacific Islanders | 8 | 3 | 5 |
| White | 10,182 | 4,629 | 5,553 |
| Two or more races | 946 | 341 | 605 |
| Race Unknown | 46 | 21 | 25 |
| Race | Total | Men | Women |
|---|---|---|---|
| American Indian or Native American | 2 | 0 | 2 |
| Asian | 21 | 10 | 11 |
| Black | 180 | 66 | 114 |
| Hispanic | 99 | 46 | 53 |
| Native Hawaiian or Other Pacific Islanders | 0 | 0 | 0 |
| White | 600 | 236 | 364 |
| Two or more races | 61 | 22 | 39 |
| Race Unknown | 3 | 0 | 3 |
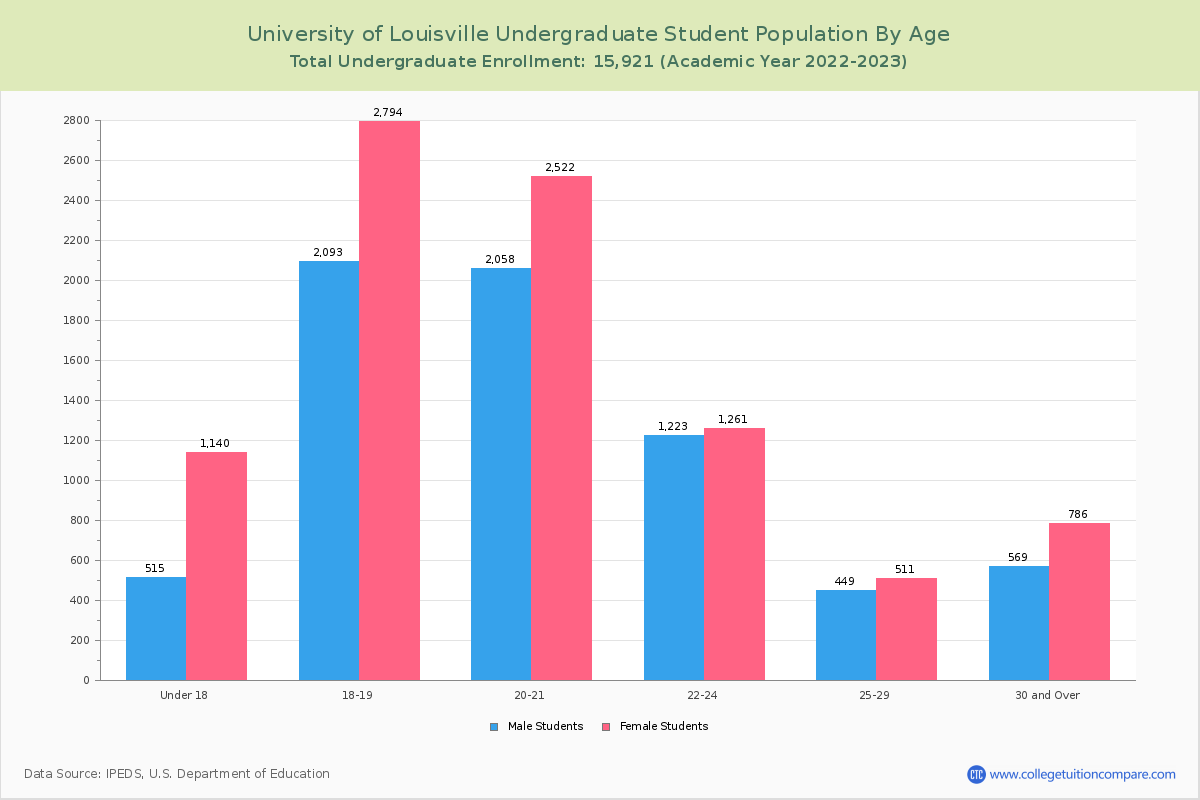
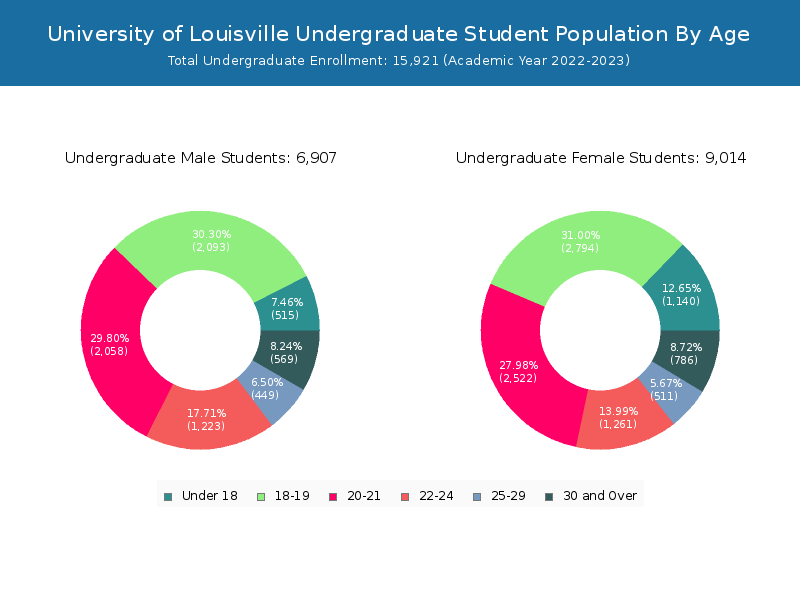
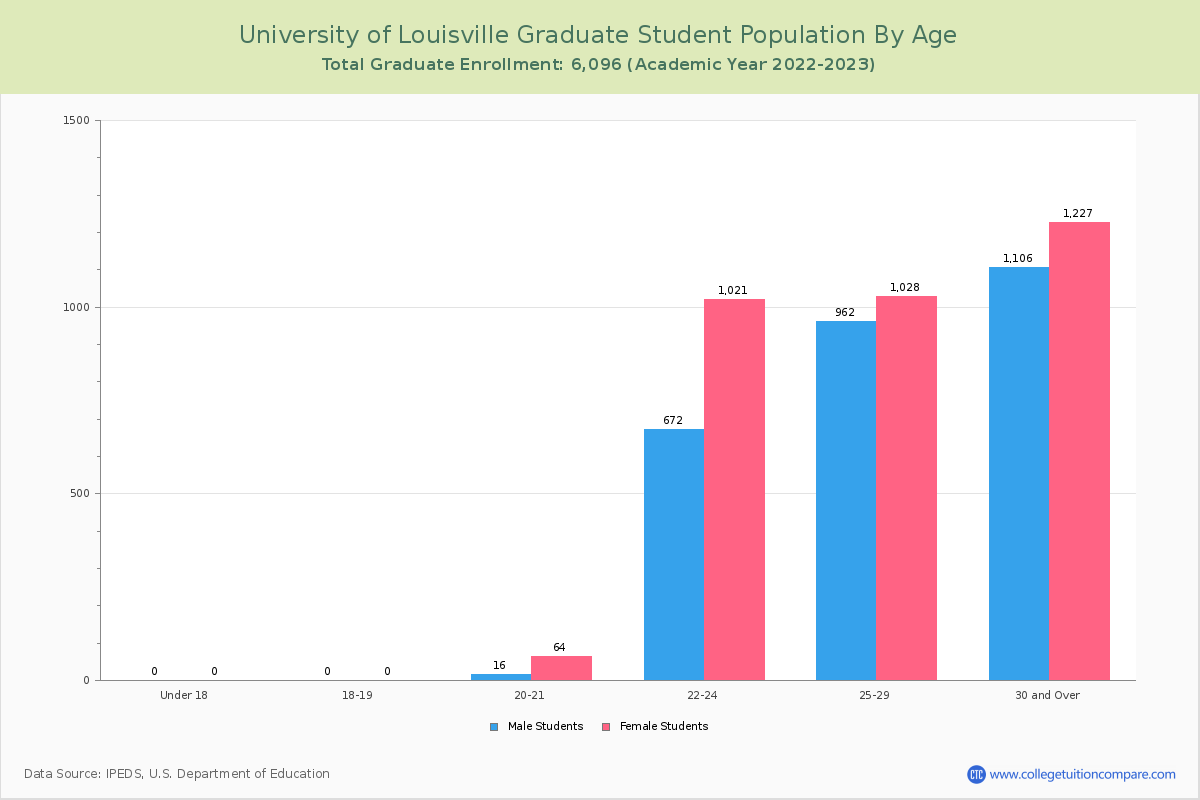
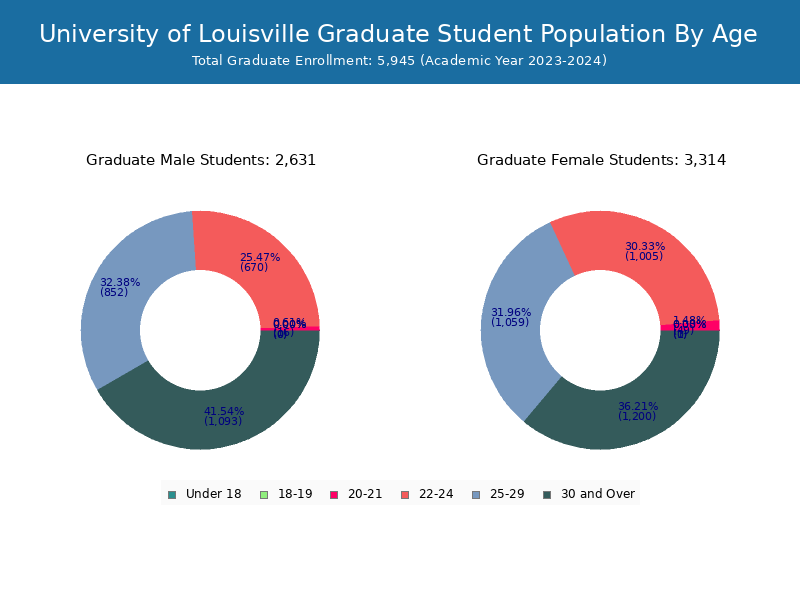
Student Age Distribution
By age, U of Louisville has 1,655 students under 18 years old and 126 students over 65 years old. There are 15,379 students under 25 years old, and 6,638 students over 25 years old out of 22,017 total students.
In undergraduate programs, 1,655 students are younger than 18 and 101 students are older than 65. U of Louisville has 13,606 undergraduate students aged under 25 and 2,315 students aged 25 and over.
It has 1,773 graduate students aged under 25 and 4,323 students aged 25 and over.
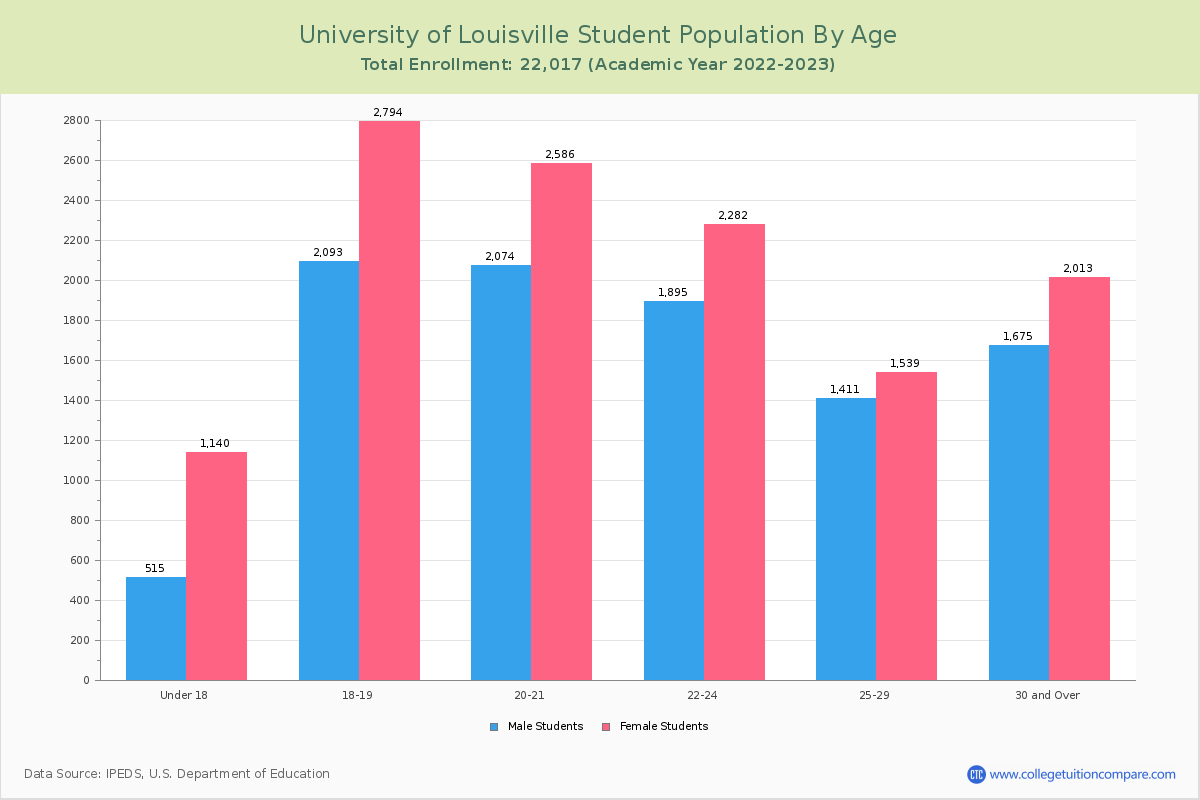
| Age | Total | Men | Women |
|---|---|---|---|
| Under 18 | 1,655 | 1,140 | 515 |
| 18-19 | 4,887 | 2,794 | 2,093 |
| 20-21 | 4,660 | 2,586 | 2,074 |
| 22-24 | 4,177 | 2,282 | 1,895 |
| 25-29 | 2,950 | 1,539 | 1,411 |
| 30-34 | 1,399 | 722 | 677 |
| 35-39 | 886 | 477 | 409 |
| 40-49 | 920 | 533 | 387 |
| 50-64 | 357 | 224 | 133 |
| Over 65 | 126 | 57 | 69 |
| Age | Total | Men | Women |
|---|---|---|---|
| Under 18 | 1,655 | 1,140 | 515 |
| 18-19 | 4,887 | 2,794 | 2,093 |
| 20-21 | 4,580 | 2,522 | 2,058 |
| 22-24 | 2,484 | 1,261 | 1,223 |
| 25-29 | 960 | 511 | 449 |
| 30-34 | 474 | 262 | 212 |
| 35-39 | 302 | 189 | 113 |
| 40-49 | 318 | 189 | 129 |
| 50-64 | 160 | 104 | 56 |
| Over 65 | 101 | 42 | 59 |
| Age | Total | Men | Women |
|---|
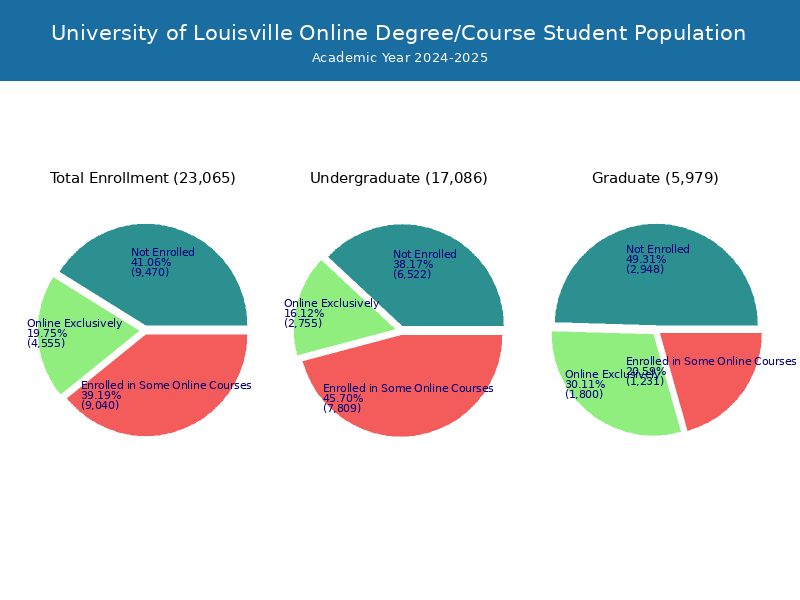
Online Student Enrollment
Distance learning, also called online education, is very attractive to students, especially who want to continue education and work in field. At University of Louisville, 4,193 students are enrolled exclusively in online courses and 7,872 students are enrolled in some online courses.
2,821 students lived in Kentucky or jurisdiction in which the school is located are enrolled exclusively in online courses and 1,372 students live in other State or outside of the United States.
| All Students | Enrolled Exclusively Online Courses | Enrolled in Some Online Courses | |
|---|---|---|---|
| All Students | 22,017 | 4,193 | 7,872 |
| Undergraduate | 15,921 | 2,434 | 6,757 |
| Graduate | 6,096 | 1,759 | 1,115 |
| Kentucky Residents | Other States in U.S. | Outside of U.S. | |
|---|---|---|---|
| All Students | 2,821 | 1,332 | 40 |
| Undergraduate | 1,954 | 471 | 9 |
| Graduate | 867 | 861 | 31 |
Transfer-in Students (Undergraduate)
Among 15,921 enrolled in undergraduate programs, 976 students have transferred-in from other institutions. The percentage of transfer-in students is 6.13%.673 students have transferred in as full-time status and 303 students transferred in as part-time status.
| Number of Students | |
|---|---|
| Regular Full-time | 10,663 |
| Transfer-in Full-time | 673 |
| Regular Part-time | 4,282 |
| Transfer-in Part-time | 303 |