Graduation Rates in Reasonable Completion Time
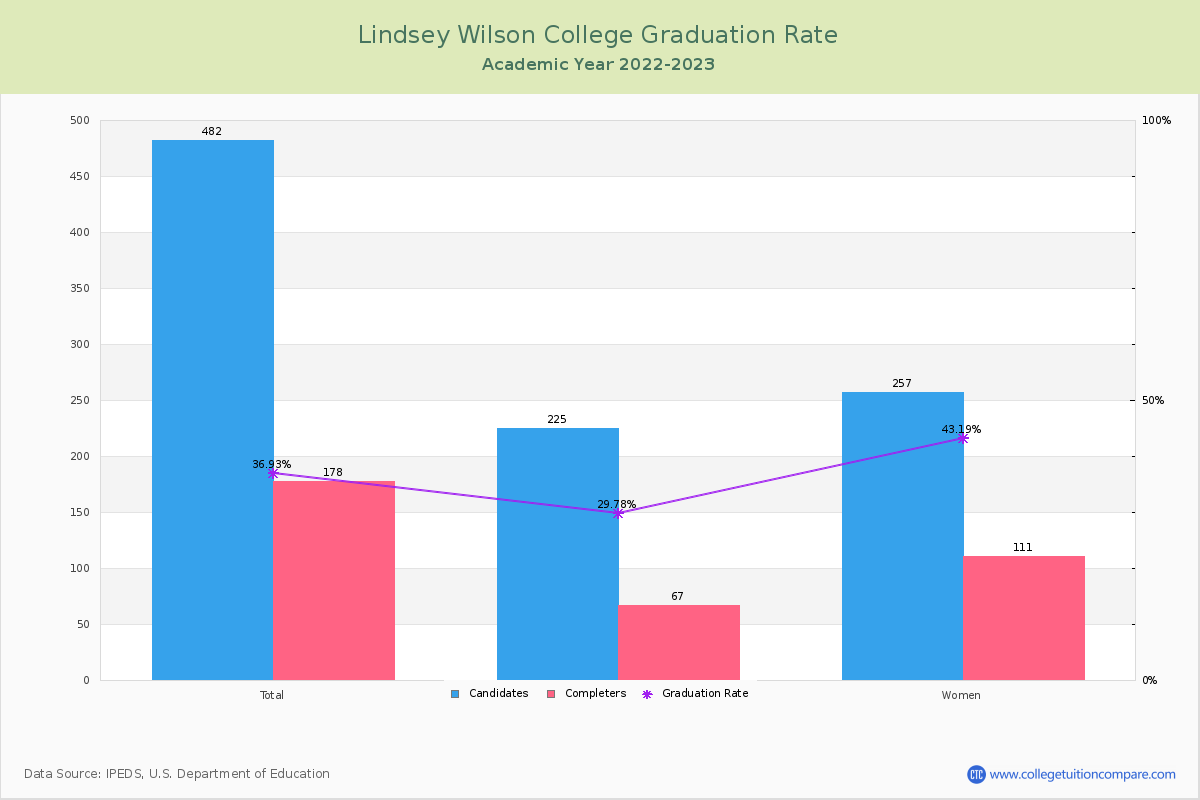
For the academic year 2022-2023, 178 students out of 482 candidates have completed their courses within 150% normal time (i.e. in 6 years for 4-year BS degree) at Lindsey Wilson College.
By gender, 67 male and 111 female students graduated the school last year completing their jobs in the period. Its graduation rate is lower than the average rate when comparing similar colleges' rate of 57.32% (private (not-for-profit) Master's College and University with larger programs).
| Candidates | Completers | Graduation Rates | |
|---|---|---|---|
| Total | 482 | 178 | 36.93% |
| Men | 225 | 67 | 29.78% |
| Women | 257 | 111 | 43.19% |
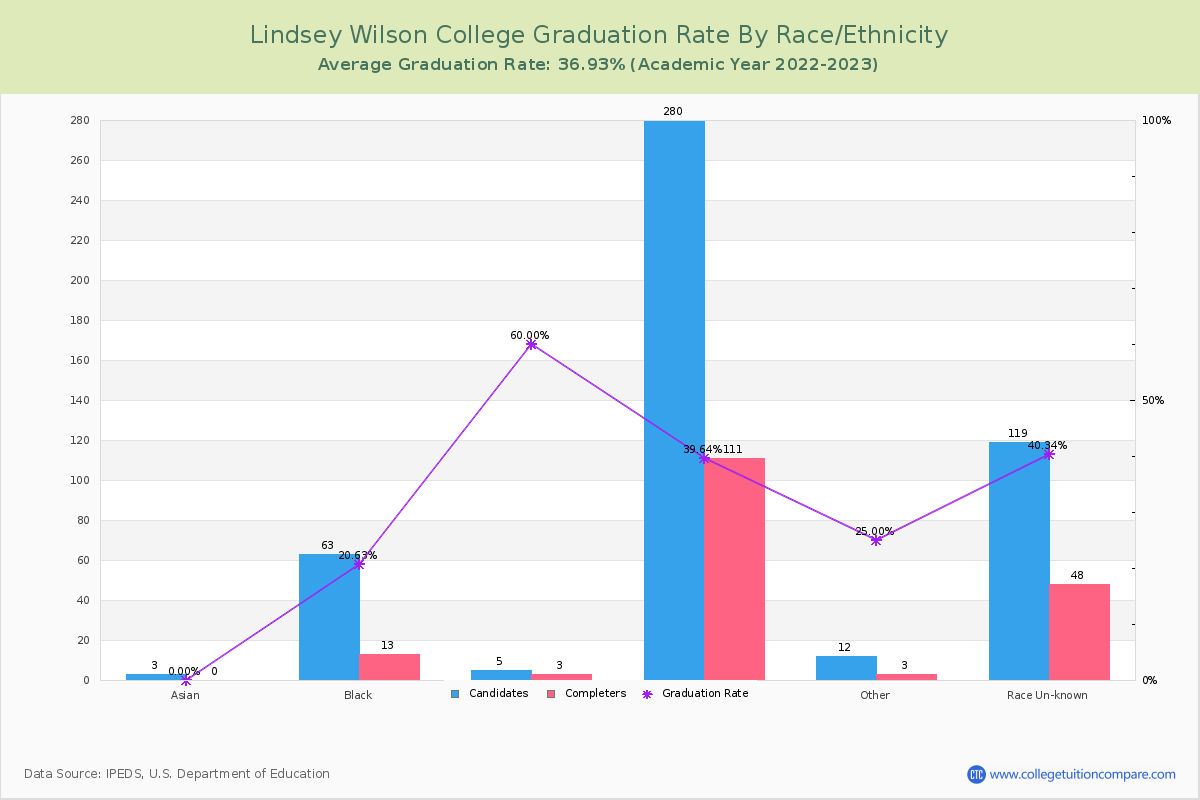
Graduation Rate By Race/Ethnicity
The following table shows graduation rate by race and at Lindsey Wilson College.
- American Indian or Alaska Native: 0.00%
- Asian: 0.00%
- Black (Non-Hispanic): 20.63%
- Hispanic: 60.00%
- White: 39.64%
- Two or More Race: 33.33%
- Unknown: 40.34%
| Total | Male | Female | |
|---|---|---|---|
| American Indian or Alaska Native | 0.00%(-/3) | - | - |
| Asian | 0.00%(-/3) | - | - |
| Black (Non-Hispanic) | 20.63%(13/63) | 17.02%(8/47) | 31.25%(5/16) |
| Hispanic | 60.00%(3/5) | 66.67%(2/3) | 50.00%(1/2) |
| White | 39.64%(111/280) | 33.33%(40/120) | 44.38%(71/160) |
| Two or More Race | 33.33%(3/9) | - | 75.00%(3/4) |
| Unknown | 40.34%(48/119) | 36.96%(17/46) | 42.47%(31/73) |