Student Population by Gender
Centre College has a total of 1,357 enrolled students for the academic year 2022-2023. All 1,357 students are enrolled into undergraduate programs.
By gender, 655 male and 702 female students (the male-female ratio is 48:52) are attending the school. The gender distribution is based on the 2022-2023 data.
| Undergraduate | |
|---|---|
| Total | 1,357 |
| Men | 655 |
| Women | 702 |
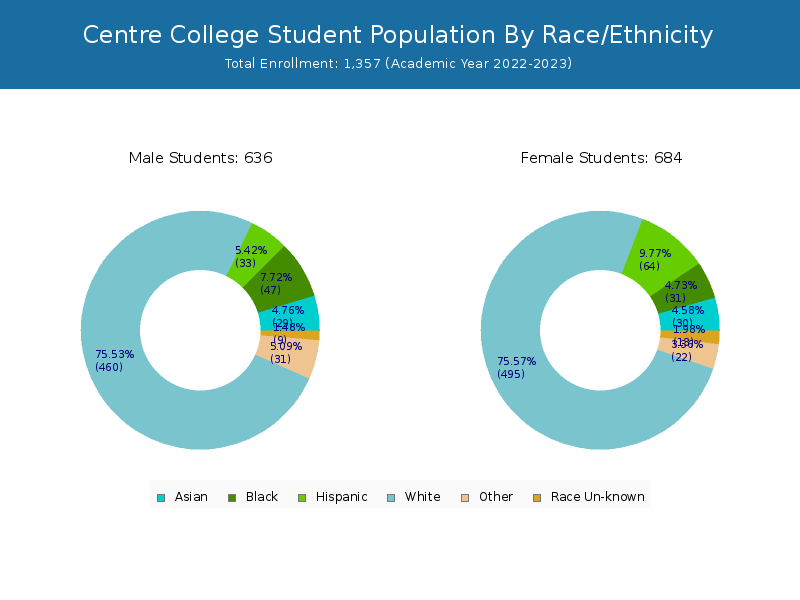
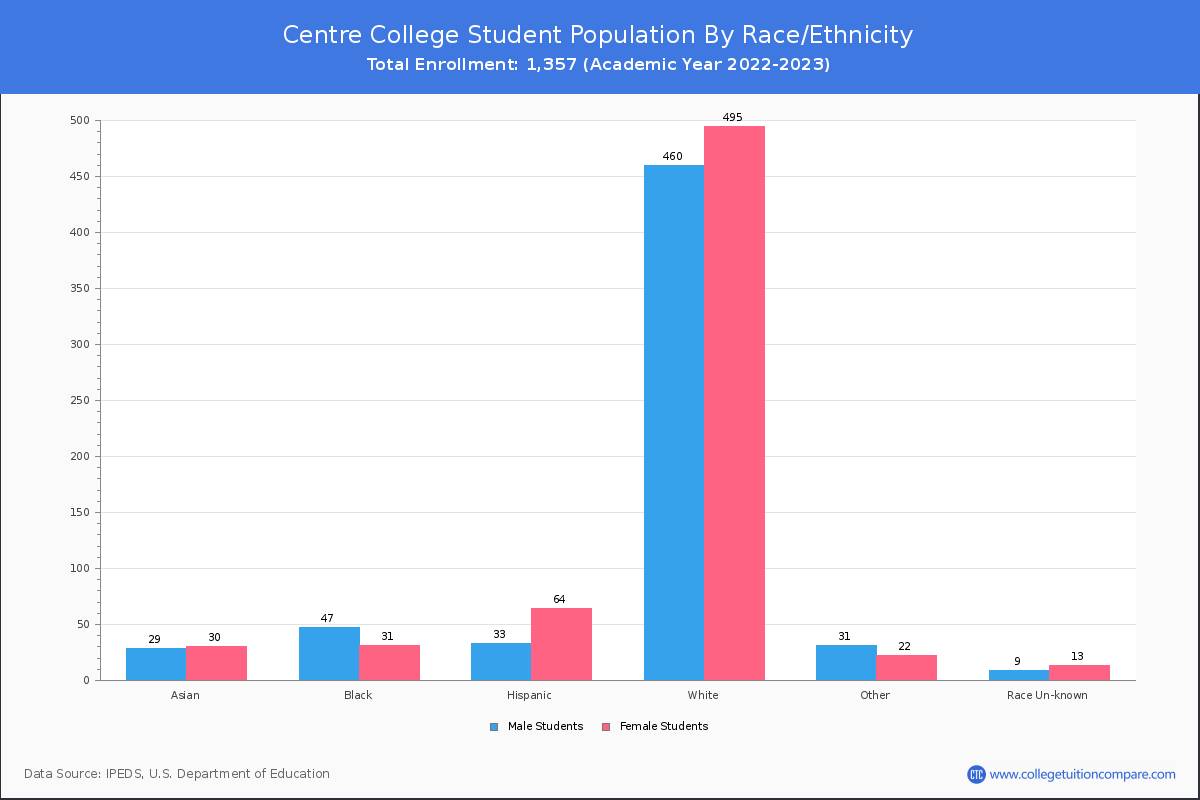
Student Distribution by Race/Ethnicity
By race/ethnicity, 984 White, 77 Black, and 58 Asian students out of a total of 1,357 are attending at Centre College. Comprehensive enrollment statistic data by race/ethnicity is shown in the next chart (Academic year 2022-2023 data).
| Race | Total | Men | Women |
|---|---|---|---|
| American Indian or Native American | 2 | 1 | 1 |
| Asian | 58 | 23 | 35 |
| Black | 77 | 48 | 29 |
| Hispanic | 96 | 34 | 62 |
| Native Hawaiian or Other Pacific Islanders | 0 | 0 | 0 |
| White | 984 | 486 | 498 |
| Two or more races | 53 | 29 | 24 |
| Race Unknown | 14 | 3 | 11 |
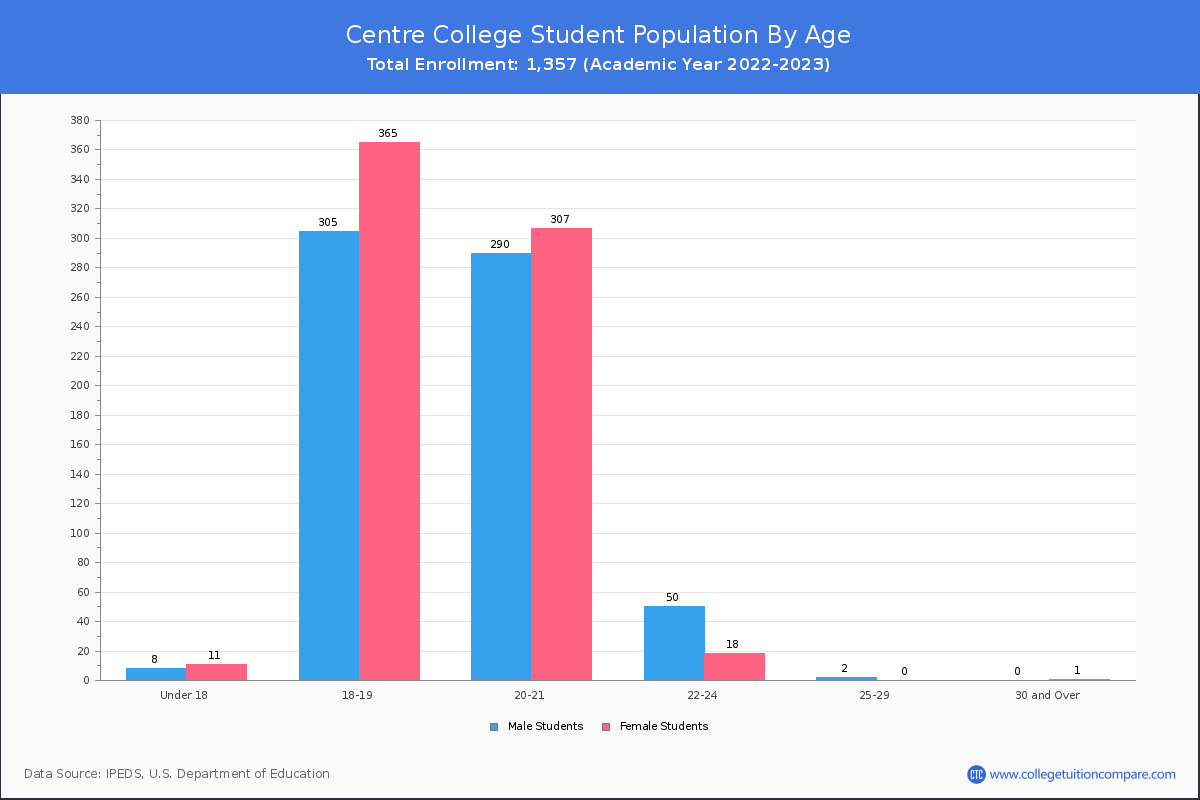
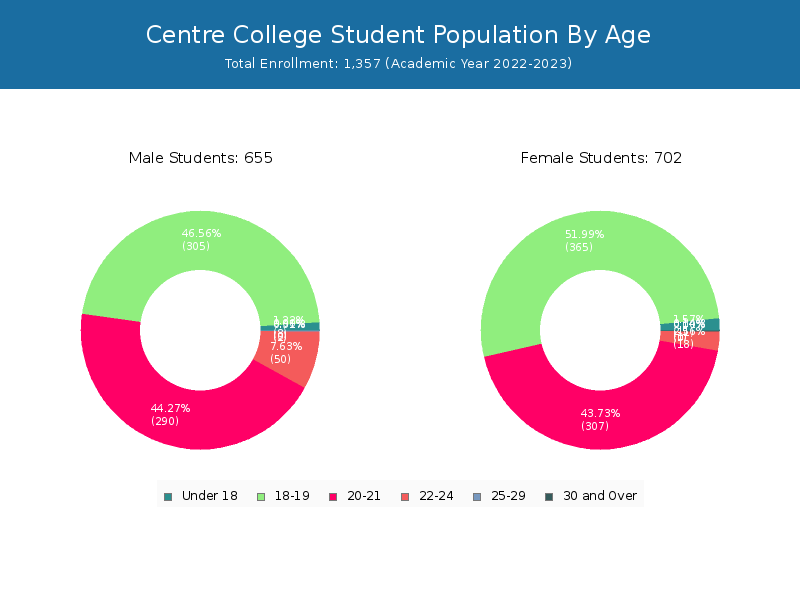
Student Age Distribution
There are 1,354 students under 25 years old, and 3 students over 25 years old out of 1,357 total students.
| Age | Total | Men | Women |
|---|---|---|---|
| Under 18 | 19 | 11 | 8 |
| 18-19 | 670 | 365 | 305 |
| 20-21 | 597 | 307 | 290 |
| 22-24 | 68 | 18 | 50 |
| 25-29 | 2 | 0 | 2 |
| 30-34 | 1 | 1 | 0 |
Transfer-in Students (Undergraduate)
Among 1,357 enrolled in undergraduate programs, 6 students have transferred-in from other institutions. The percentage of transfer-in students is 0.44%.
| Number of Students | |
|---|---|
| Regular Full-time | 1,346 |
| Transfer-in Full-time | 6 |