Student Population by Gender
Saint Ambrose University has a total of 2,747 enrolled students for the academic year 2022-2023. 2,118 students have enrolled in undergraduate programs and 629 students joined graduate programs.
By gender, 1,150 male and 1,597 female students (the male-female ratio is 42:58) are attending the school. The gender distribution is based on the 2022-2023 data.
| Total | Undergraduate | Graduate | |
|---|---|---|---|
| Total | 2,747 | 2,118 | 629 |
| Men | 1,150 | 970 | 180 |
| Women | 1,597 | 1,148 | 449 |
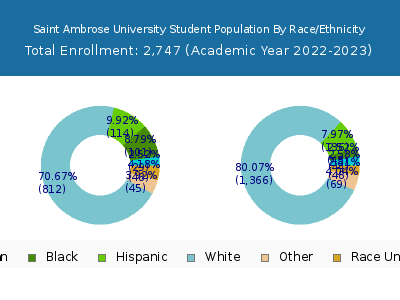
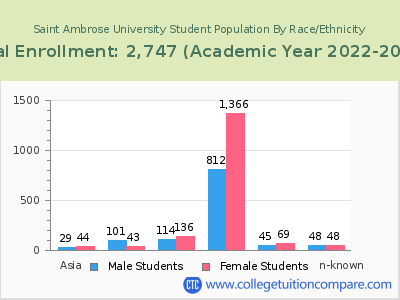
Student Distribution by Race/Ethnicity
| Race | Total | Men | Women |
|---|---|---|---|
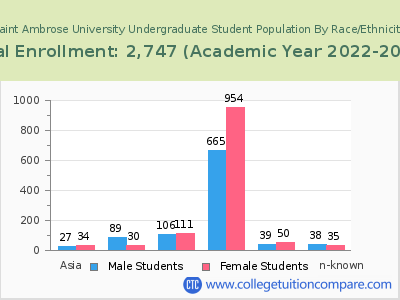
| American Indian or Native American | 4 | 3 | 1 |
| Asian | 53 | 20 | 33 |
| Black | 148 | 100 | 48 |
| Hispanic | 255 | 112 | 143 |
| Native Hawaiian or Other Pacific Islanders | 2 | 0 | 2 |
| White | 2,039 | 784 | 1,255 |
| Two or more races | 109 | 49 | 60 |
| Race Unknown | 78 | 36 | 42 |
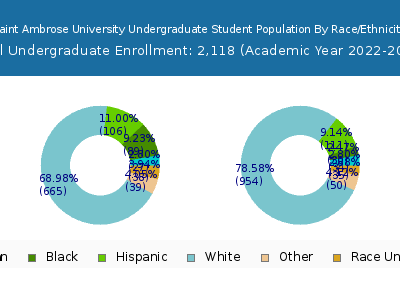
| Race | Total | Men | Women |
|---|---|---|---|
| American Indian or Native American | 3 | 3 | 0 |
| Asian | 41 | 18 | 23 |
| Black | 113 | 84 | 29 |
| Hispanic | 217 | 98 | 119 |
| Native Hawaiian or Other Pacific Islanders | 2 | 0 | 2 |
| White | 1,526 | 646 | 880 |
| Two or more races | 89 | 44 | 45 |
| Race Unknown | 74 | 34 | 40 |
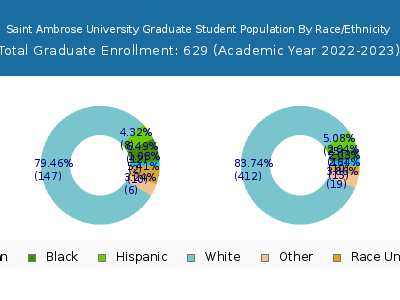
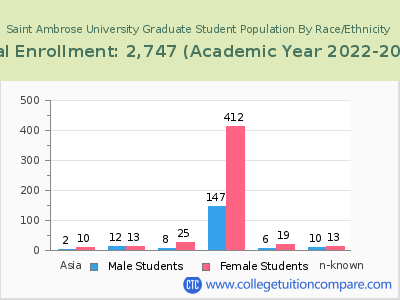
| Race | Total | Men | Women |
|---|---|---|---|
| American Indian or Native American | 1 | 1 | 0 |
| Asian | 4 | 3 | 1 |
| Black | 15 | 12 | 3 |
| Hispanic | 19 | 7 | 12 |
| Native Hawaiian or Other Pacific Islanders | 1 | 0 | 1 |
| White | 117 | 48 | 69 |
| Two or more races | 5 | 2 | 3 |
| Race Unknown | 7 | 2 | 5 |
Student Age Distribution
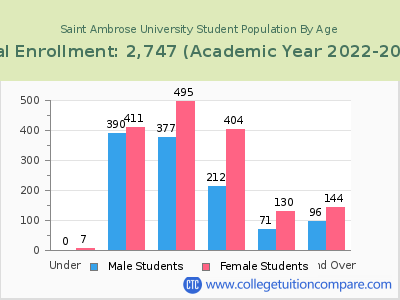
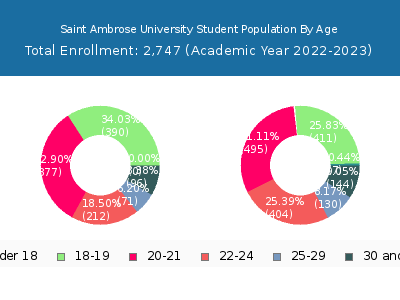
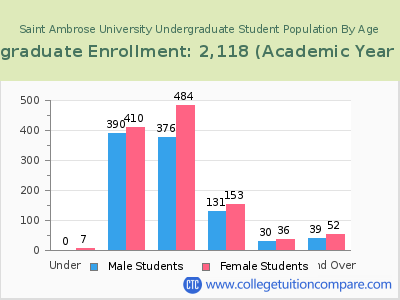
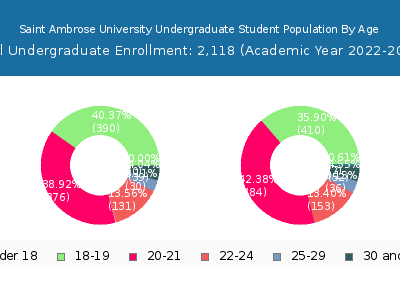
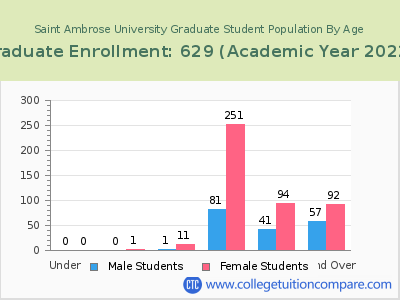
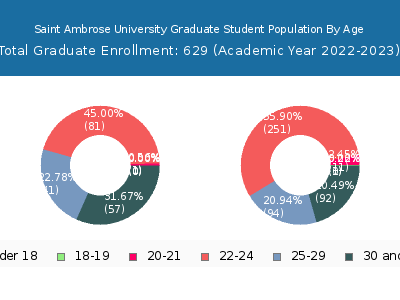
By age, Saint Ambrose has 7 students under 18 years old and 1 students over 65 years old. There are 2,296 students under 25 years old, and 441 students over 25 years old out of 2,747 total students.
In undergraduate programs, 7 students are younger than 18 and 1 students are older than 65. Saint Ambrose has 1,951 undergraduate students aged under 25 and 157 students aged 25 and over.
It has 345 graduate students aged under 25 and 284 students aged 25 and over.
| Age | Total | Men | Women |
|---|---|---|---|
| Under 18 | 7 | 7 | 0 |
| 18-19 | 801 | 411 | 390 |
| 20-21 | 872 | 495 | 377 |
| 22-24 | 616 | 404 | 212 |
| 25-29 | 201 | 130 | 71 |
| 30-34 | 67 | 42 | 25 |
| 35-39 | 56 | 28 | 28 |
| 40-49 | 77 | 51 | 26 |
| 50-64 | 39 | 23 | 16 |
| Over 65 | 1 | 0 | 1 |
| Age | Total | Men | Women |
|---|---|---|---|
| Under 18 | 7 | 7 | 0 |
| 18-19 | 800 | 410 | 390 |
| 20-21 | 860 | 484 | 376 |
| 22-24 | 284 | 153 | 131 |
| 25-29 | 66 | 36 | 30 |
| 30-34 | 26 | 15 | 11 |
| 35-39 | 22 | 11 | 11 |
| 40-49 | 28 | 19 | 9 |
| 50-64 | 14 | 7 | 7 |
| Over 65 | 1 | 0 | 1 |
| Age | Total | Men | Women |
|---|
Online Student Enrollment
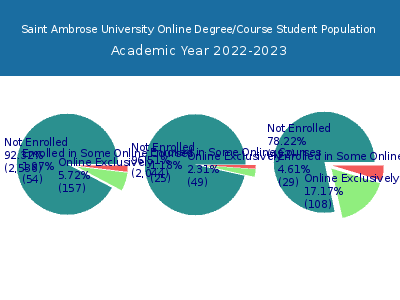
Distance learning, also called online education, is very attractive to students, especially who want to continue education and work in field. At Saint Ambrose University, 157 students are enrolled exclusively in online courses and 54 students are enrolled in some online courses.
98 students lived in Iowa or jurisdiction in which the school is located are enrolled exclusively in online courses and 59 students live in other State or outside of the United States.
| All Students | Enrolled Exclusively Online Courses | Enrolled in Some Online Courses | |
|---|---|---|---|
| All Students | 2,747 | 157 | 54 |
| Undergraduate | 2,118 | 49 | 25 |
| Graduate | 629 | 108 | 29 |
| Iowa Residents | Other States in U.S. | Outside of U.S. | |
|---|---|---|---|
| All Students | 98 | 58 | 1 |
| Undergraduate | 39 | 10 | 0 |
| Graduate | 59 | 48 | 1 |
Transfer-in Students (Undergraduate)
Among 2,118 enrolled in undergraduate programs, 174 students have transferred-in from other institutions. The percentage of transfer-in students is 8.22%.158 students have transferred in as full-time status and 16 students transferred in as part-time status.
| Number of Students | |
|---|---|
| Regular Full-time | 1,872 |
| Transfer-in Full-time | 158 |
| Regular Part-time | 72 |
| Transfer-in Part-time | 16 |
