Student Population by Gender
Trine University has a total of 4,088 enrolled students for the academic year 2022-2023. 3,819 students have enrolled in undergraduate programs and 269 students joined graduate programs.
By gender, 2,076 male and 2,012 female students (the male-female ratio is 51:49) are attending the school. The gender distribution is based on the 2022-2023 data.
| Total | Undergraduate | Graduate | |
|---|---|---|---|
| Total | 4,088 | 3,819 | 269 |
| Men | 2,076 | 2,009 | 67 |
| Women | 2,012 | 1,810 | 202 |
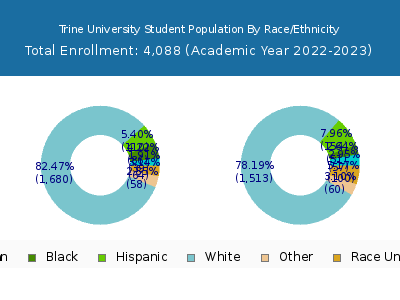
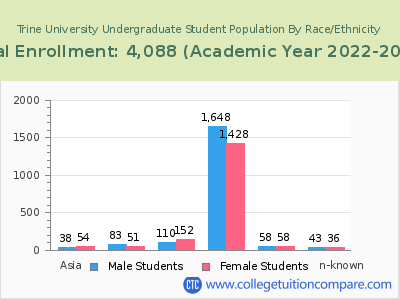
Student Distribution by Race/Ethnicity
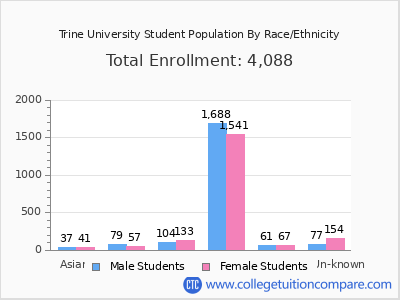
| Race | Total | Men | Women |
|---|---|---|---|
| American Indian or Native American | 9 | 6 | 3 |
| Asian | 78 | 37 | 41 |
| Black | 136 | 79 | 57 |
| Hispanic | 237 | 104 | 133 |
| Native Hawaiian or Other Pacific Islanders | 2 | 2 | 0 |
| White | 3,229 | 1,688 | 1,541 |
| Two or more races | 117 | 53 | 64 |
| Race Unknown | 231 | 77 | 154 |
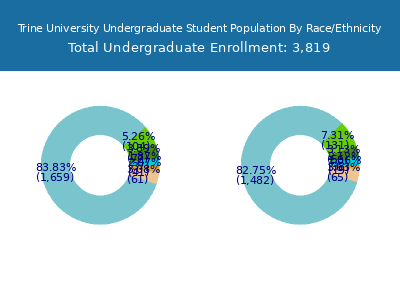
| Race | Total | Men | Women |
|---|---|---|---|
| American Indian or Native American | 8 | 6 | 2 |
| Asian | 75 | 37 | 38 |
| Black | 133 | 77 | 56 |
| Hispanic | 235 | 104 | 131 |
| Native Hawaiian or Other Pacific Islanders | 2 | 2 | 0 |
| White | 3,141 | 1,659 | 1,482 |
| Two or more races | 116 | 53 | 63 |
| Race Unknown | 60 | 41 | 19 |
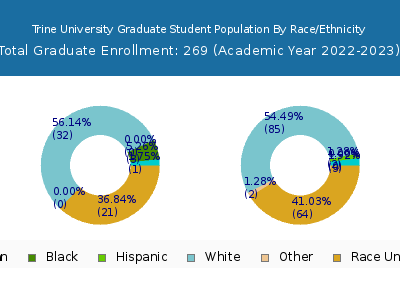
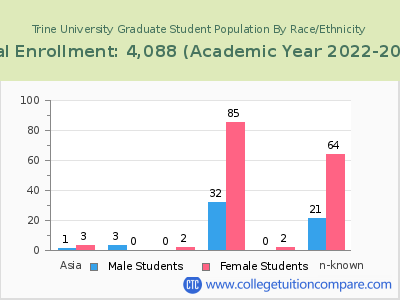
| Race | Total | Men | Women |
|---|---|---|---|
| American Indian or Native American | 0 | 0 | 0 |
| Asian | 1 | 0 | 1 |
| Black | 2 | 2 | 0 |
| Hispanic | 3 | 2 | 1 |
| Native Hawaiian or Other Pacific Islanders | 0 | 0 | 0 |
| White | 48 | 29 | 19 |
| Two or more races | 2 | 1 | 1 |
| Race Unknown | 1 | 0 | 1 |
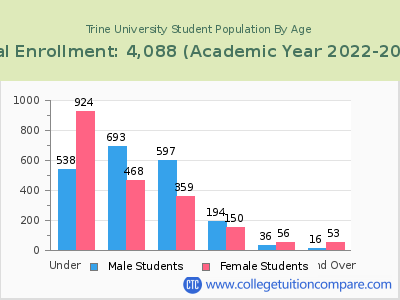
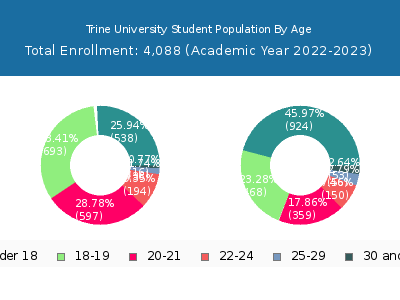
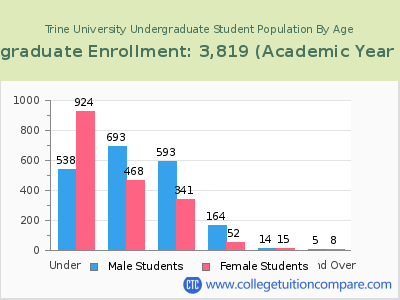
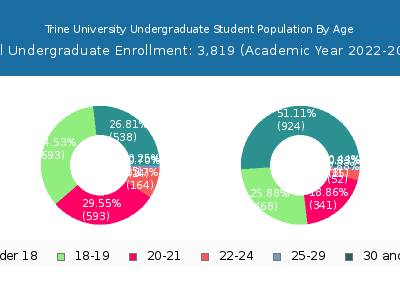
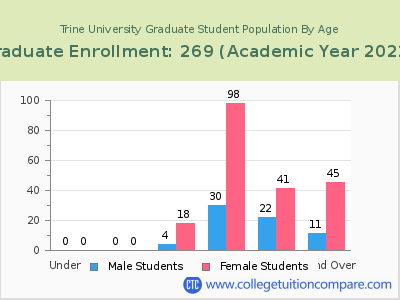
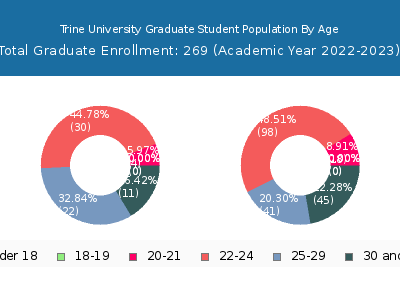
Student Age Distribution
| Age | Total | Men | Women |
|---|---|---|---|
| Under 18 | 1,462 | 924 | 538 |
| 18-19 | 1,161 | 468 | 693 |
| 20-21 | 956 | 359 | 597 |
| 22-24 | 344 | 150 | 194 |
| 25-29 | 92 | 56 | 36 |
| 30-34 | 28 | 18 | 10 |
| 35-39 | 14 | 12 | 2 |
| 40-49 | 17 | 15 | 2 |
| 50-64 | 10 | 8 | 2 |
| Age | Total | Men | Women |
|---|---|---|---|
| Under 18 | 1,462 | 924 | 538 |
| 18-19 | 1,161 | 468 | 693 |
| 20-21 | 934 | 341 | 593 |
| 22-24 | 216 | 52 | 164 |
| 25-29 | 29 | 15 | 14 |
| 30-34 | 4 | 1 | 3 |
| 35-39 | 4 | 3 | 1 |
| 40-49 | 5 | 4 | 1 |
| Age | Total | Men | Women |
|---|
Online Student Enrollment
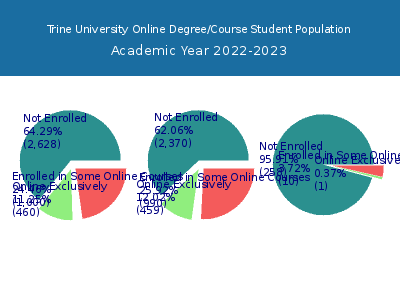
Distance learning, also called online education, is very attractive to students, especially who want to continue education and work in field. At Trine University, 460 students are enrolled exclusively in online courses and 1,000 students are enrolled in some online courses.
433 students lived in Indiana or jurisdiction in which the school is located are enrolled exclusively in online courses and 27 students live in other State or outside of the United States.
| All Students | Enrolled Exclusively Online Courses | Enrolled in Some Online Courses | |
|---|---|---|---|
| All Students | 4,088 | 460 | 1,000 |
| Undergraduate | 3,819 | 459 | 990 |
| Graduate | 269 | 1 | 10 |
| Indiana Residents | Other States in U.S. | Outside of U.S. | |
|---|---|---|---|
| All Students | 433 | 27 | 0 |
| Undergraduate | 432 | 27 | 0 |
| Graduate | 1 | - | 0 |
Transfer-in Students (Undergraduate)
Among 3,819 enrolled in undergraduate programs, 60 students have transferred-in from other institutions. The percentage of transfer-in students is 1.57%.58 students have transferred in as full-time status and 2 students transferred in as part-time status.
| Number of Students | |
|---|---|
| Regular Full-time | 2,202 |
| Transfer-in Full-time | 58 |
| Regular Part-time | 1,557 |
| Transfer-in Part-time | 2 |
