Student Population by Gender
Lincoln College of Technology-Indianapolis has a total of 889 enrolled students for the academic year 2022-2023. All 889 students are enrolled into undergraduate programs.
By gender, 742 male and 147 female students (the male-female ratio is 83:17) are attending the school. The gender distribution is based on the 2022-2023 data.
| Undergraduate | |
|---|---|
| Total | 889 |
| Men | 742 |
| Women | 147 |
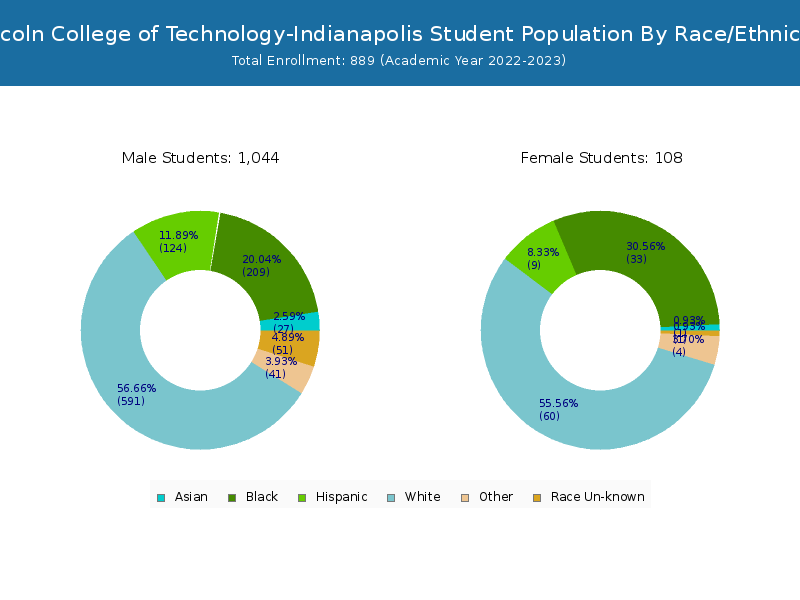
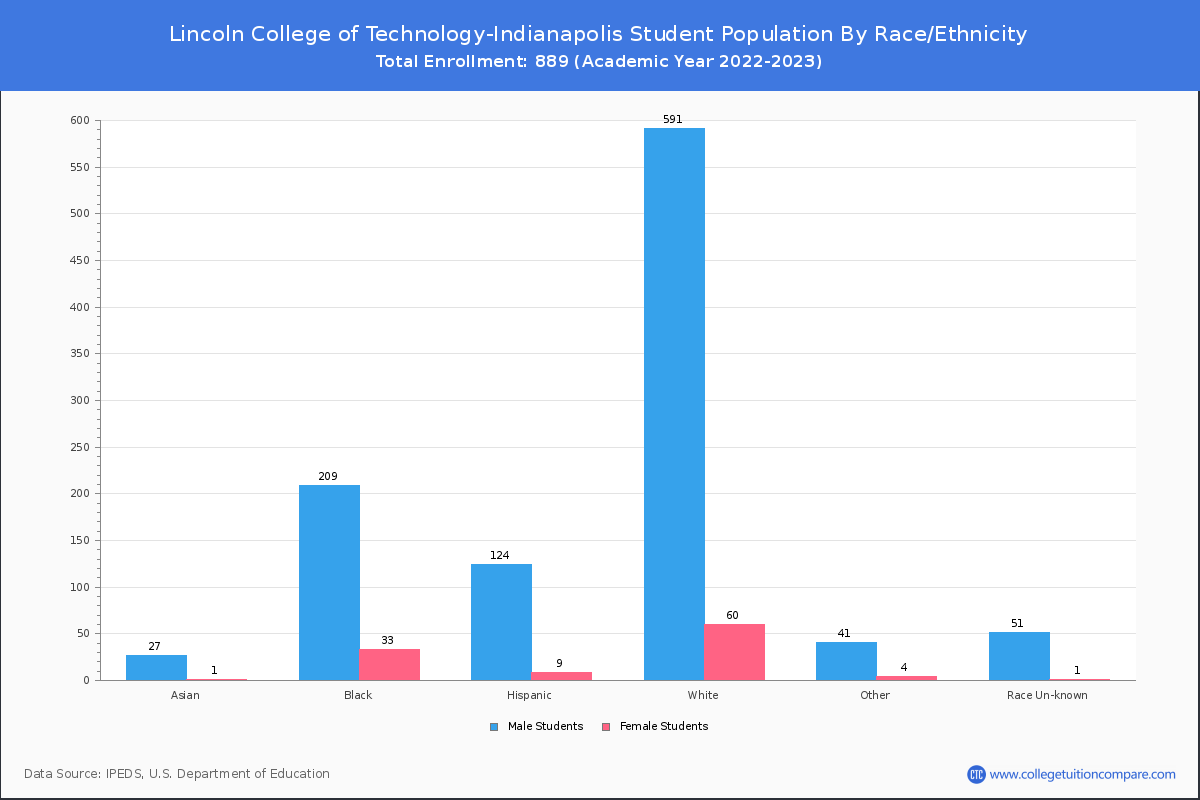
Student Distribution by Race/Ethnicity
By race/ethnicity, 465 White, 215 Black, and 26 Asian students out of a total of 889 are attending at Lincoln College of Technology-Indianapolis. Comprehensive enrollment statistic data by race/ethnicity is shown in the next chart (Academic year 2022-2023 data).
| Race | Total | Men | Women |
|---|---|---|---|
| American Indian or Native American | 3 | 2 | 1 |
| Asian | 26 | 20 | 6 |
| Black | 215 | 159 | 56 |
| Hispanic | 122 | 109 | 13 |
| Native Hawaiian or Other Pacific Islanders | 2 | 2 | 0 |
| White | 465 | 402 | 63 |
| Two or more races | 24 | 18 | 6 |
| Race Unknown | 31 | 29 | 2 |
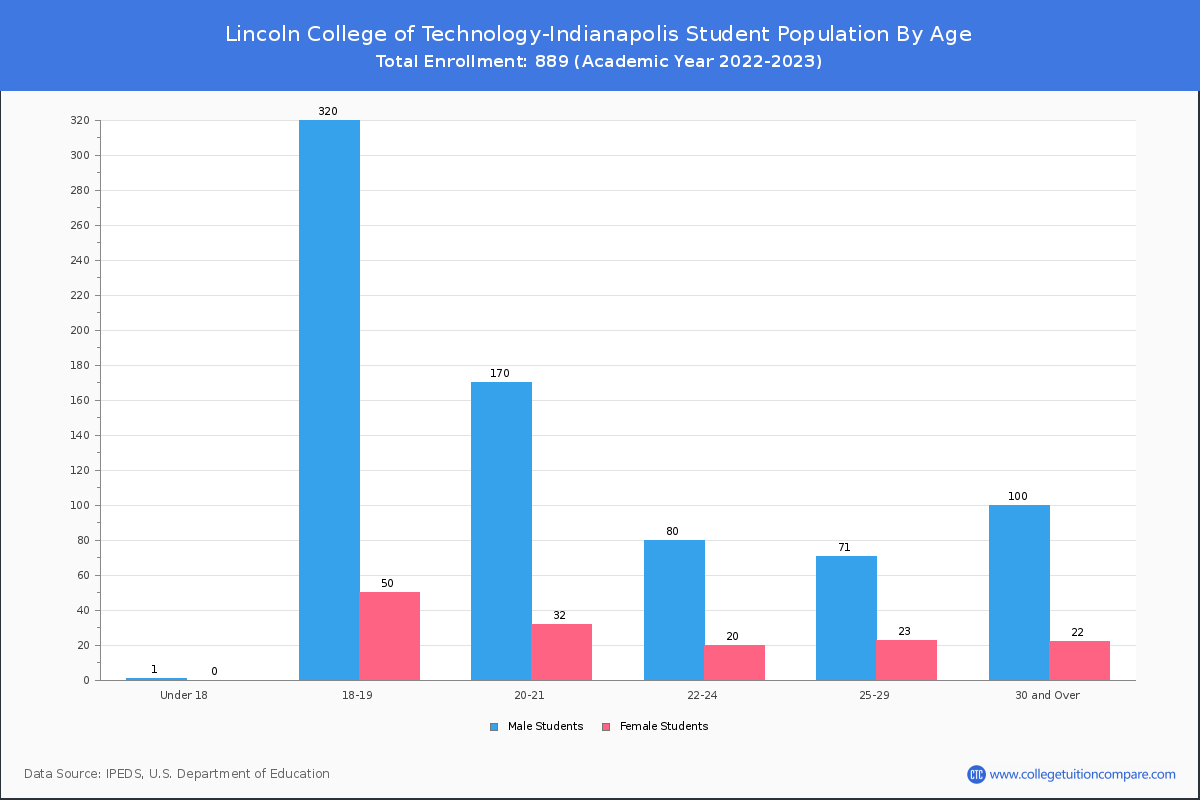
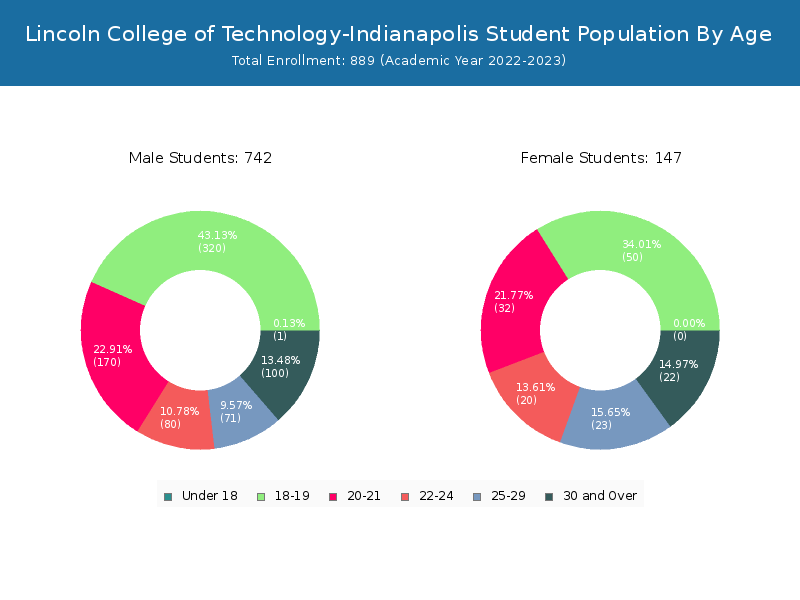
Student Age Distribution
By age, Lincoln Tech has 1 students under 18 years old and 1 students over 65 years old. There are 673 students under 25 years old, and 216 students over 25 years old out of 889 total students.
| Age | Total | Men | Women |
|---|---|---|---|
| Under 18 | 1 | 0 | 1 |
| 18-19 | 370 | 50 | 320 |
| 20-21 | 202 | 32 | 170 |
| 22-24 | 100 | 20 | 80 |
| 25-29 | 94 | 23 | 71 |
| 30-34 | 57 | 9 | 48 |
| 35-39 | 28 | 7 | 21 |
| 40-49 | 33 | 5 | 28 |
| 50-64 | 3 | 1 | 2 |
| Over 65 | 1 | 0 | 1 |
Transfer-in Students (Undergraduate)
Among 889 enrolled in undergraduate programs, 1 students have transferred-in from other institutions. The percentage of transfer-in students is 0.11%.
| Number of Students | |
|---|---|
| Regular Full-time | 888 |
| Transfer-in Full-time | 1 |