Student Population by Gender
Huntington University has a total of 1,472 enrolled students for the academic year 2022-2023. 1,229 students have enrolled in undergraduate programs and 243 students joined graduate programs.
By gender, 543 male and 929 female students (the male-female ratio is 37:63) are attending the school. The gender distribution is based on the 2022-2023 data.
| Total | Undergraduate | Graduate | |
|---|---|---|---|
| Total | 1,472 | 1,229 | 243 |
| Men | 543 | 481 | 62 |
| Women | 929 | 748 | 181 |
Student Distribution by Race/Ethnicity
| Race | Total | Men | Women |
|---|---|---|---|
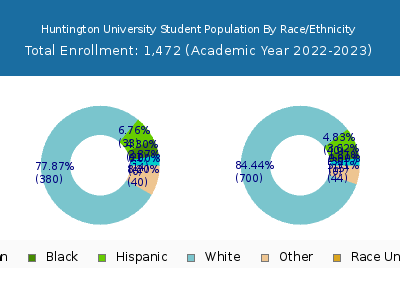
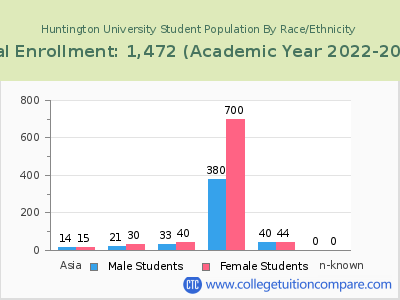
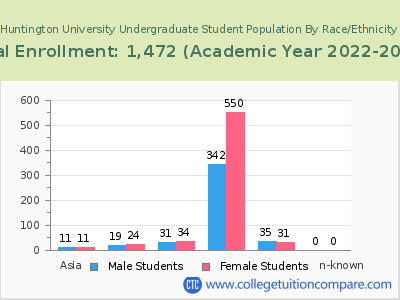
| American Indian or Native American | 7 | 5 | 2 |
| Asian | 33 | 12 | 21 |
| Black | 49 | 17 | 32 |
| Hispanic | 35 | 23 | 12 |
| Native Hawaiian or Other Pacific Islanders | 5 | 5 | 0 |
| White | 1,219 | 421 | 798 |
| Two or more races | 70 | 24 | 46 |
| Race Unknown | 0 | 0 | 0 |
| Race | Total | Men | Women |
|---|---|---|---|
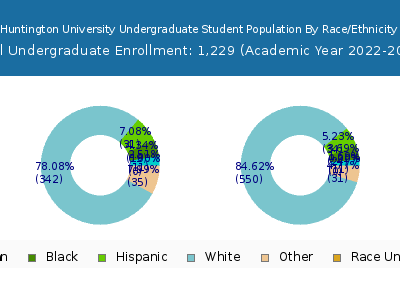
| American Indian or Native American | 7 | 5 | 2 |
| Asian | 20 | 8 | 12 |
| Black | 41 | 16 | 25 |
| Hispanic | 32 | 22 | 10 |
| Native Hawaiian or Other Pacific Islanders | 5 | 5 | 0 |
| White | 1,029 | 384 | 645 |
| Two or more races | 59 | 22 | 37 |
| Race Unknown | 0 | 0 | 0 |
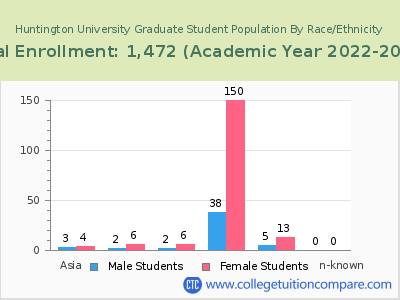
| Race | Total | Men | Women |
|---|---|---|---|
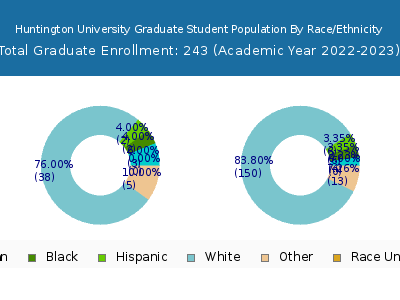
| American Indian or Native American | 0 | 0 | 0 |
| Asian | 2 | 1 | 1 |
| Black | 1 | 0 | 1 |
| Hispanic | 0 | 0 | 0 |
| Native Hawaiian or Other Pacific Islanders | 0 | 0 | 0 |
| White | 33 | 15 | 18 |
| Two or more races | 2 | 0 | 2 |
| Race Unknown | 0 | 0 | 0 |
Student Age Distribution
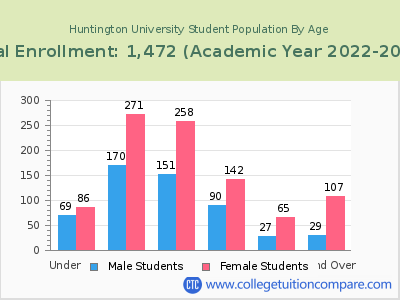
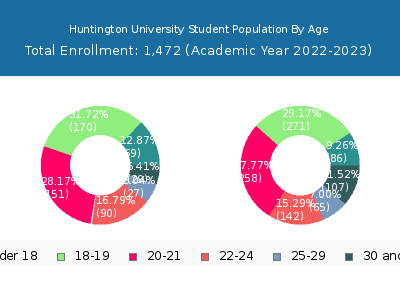
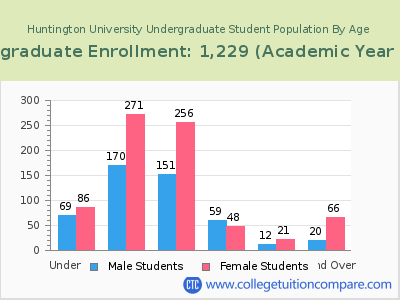
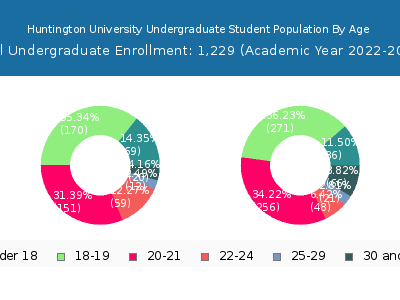
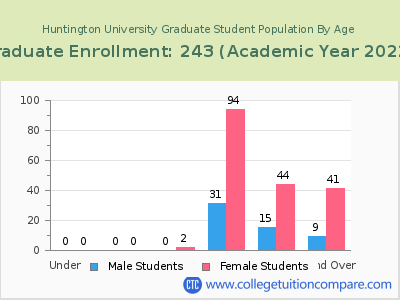
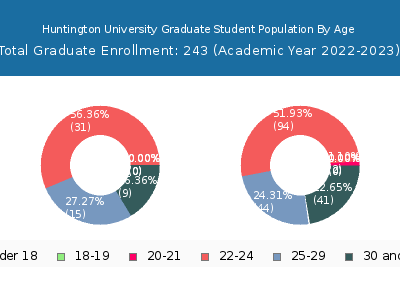
By age, Huntington has 155 students under 18 years old and 2 students over 65 years old. There are 1,237 students under 25 years old, and 228 students over 25 years old out of 1,472 total students.
In undergraduate programs, 155 students are younger than 18 and 2 students are older than 65. Huntington has 1,110 undergraduate students aged under 25 and 119 students aged 25 and over.
It has 127 graduate students aged under 25 and 109 students aged 25 and over.
| Age | Total | Men | Women |
|---|---|---|---|
| Under 18 | 155 | 86 | 69 |
| 18-19 | 441 | 271 | 170 |
| 20-21 | 409 | 258 | 151 |
| 22-24 | 232 | 142 | 90 |
| 25-29 | 92 | 65 | 27 |
| 30-34 | 44 | 32 | 12 |
| 35-39 | 25 | 24 | 1 |
| 40-49 | 43 | 36 | 7 |
| 50-64 | 22 | 14 | 8 |
| Over 65 | 2 | 1 | 1 |
| Age | Total | Men | Women |
|---|---|---|---|
| Under 18 | 155 | 86 | 69 |
| 18-19 | 441 | 271 | 170 |
| 20-21 | 407 | 256 | 151 |
| 22-24 | 107 | 48 | 59 |
| 25-29 | 33 | 21 | 12 |
| 30-34 | 32 | 22 | 10 |
| 35-39 | 16 | 16 | 0 |
| 40-49 | 22 | 18 | 4 |
| 50-64 | 14 | 9 | 5 |
| Over 65 | 2 | 1 | 1 |
| Age | Total | Men | Women |
|---|
Online Student Enrollment
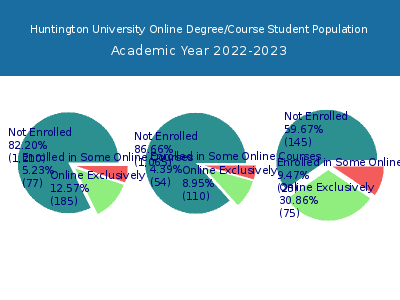
Distance learning, also called online education, is very attractive to students, especially who want to continue education and work in field. At Huntington University, 185 students are enrolled exclusively in online courses and 77 students are enrolled in some online courses.
140 students lived in Indiana or jurisdiction in which the school is located are enrolled exclusively in online courses and 45 students live in other State or outside of the United States.
| All Students | Enrolled Exclusively Online Courses | Enrolled in Some Online Courses | |
|---|---|---|---|
| All Students | 1,472 | 185 | 77 |
| Undergraduate | 1,229 | 110 | 54 |
| Graduate | 243 | 75 | 23 |
| Indiana Residents | Other States in U.S. | Outside of U.S. | |
|---|---|---|---|
| All Students | 140 | 45 | 0 |
| Undergraduate | 83 | 27 | 0 |
| Graduate | 57 | 18 | 0 |
Transfer-in Students (Undergraduate)
Among 1,229 enrolled in undergraduate programs, 41 students have transferred-in from other institutions. The percentage of transfer-in students is 3.34%.35 students have transferred in as full-time status and 6 students transferred in as part-time status.
| Number of Students | |
|---|---|
| Regular Full-time | 876 |
| Transfer-in Full-time | 35 |
| Regular Part-time | 312 |
| Transfer-in Part-time | 6 |
