Student Population by Gender
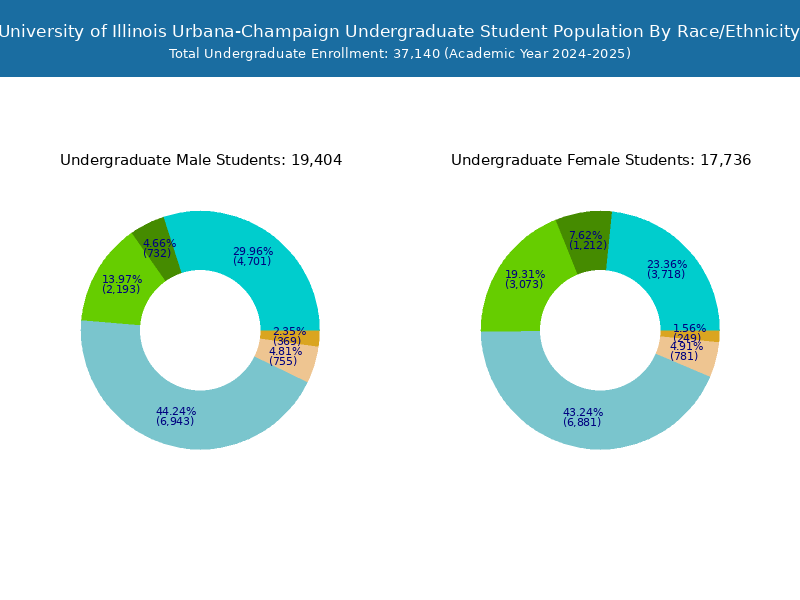
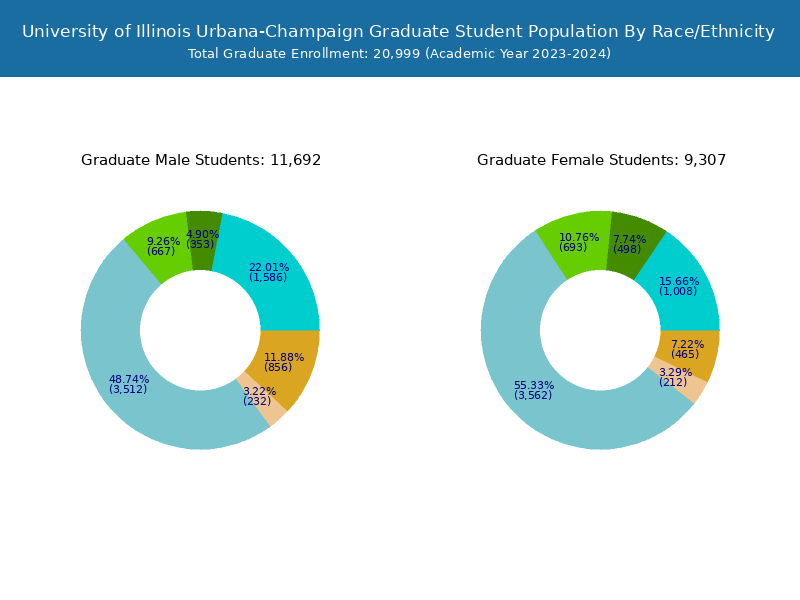
University of Illinois Urbana-Champaign has a total of 56,916 enrolled students for the academic year 2022-2023. 35,120 students have enrolled in undergraduate programs and 21,796 students joined graduate programs.
By gender, 31,000 male and 25,916 female students (the male-female ratio is 54:46) are attending the school. The gender distribution is based on the 2022-2023 data.
| Total | Undergraduate | Graduate | |
|---|---|---|---|
| Total | 56,916 | 35,120 | 21,796 |
| Men | 31,000 | 18,821 | 12,179 |
| Women | 25,916 | 16,299 | 9,617 |
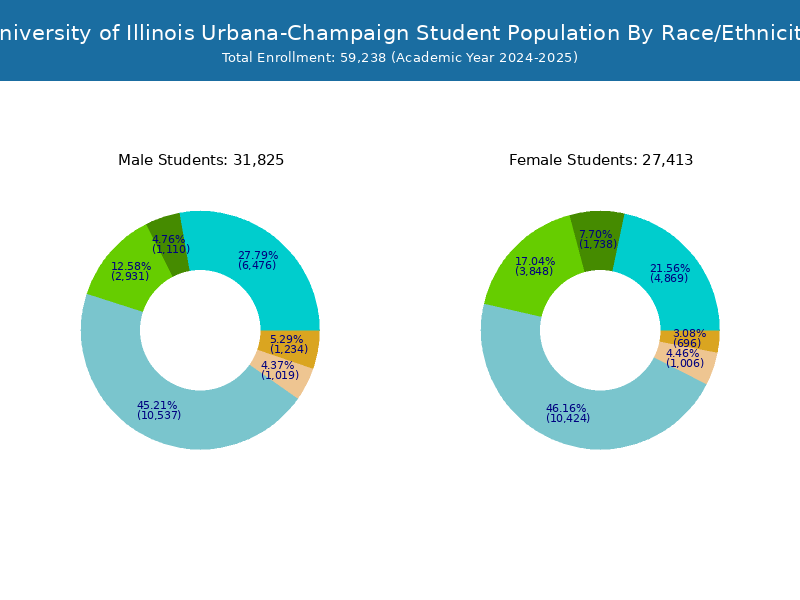
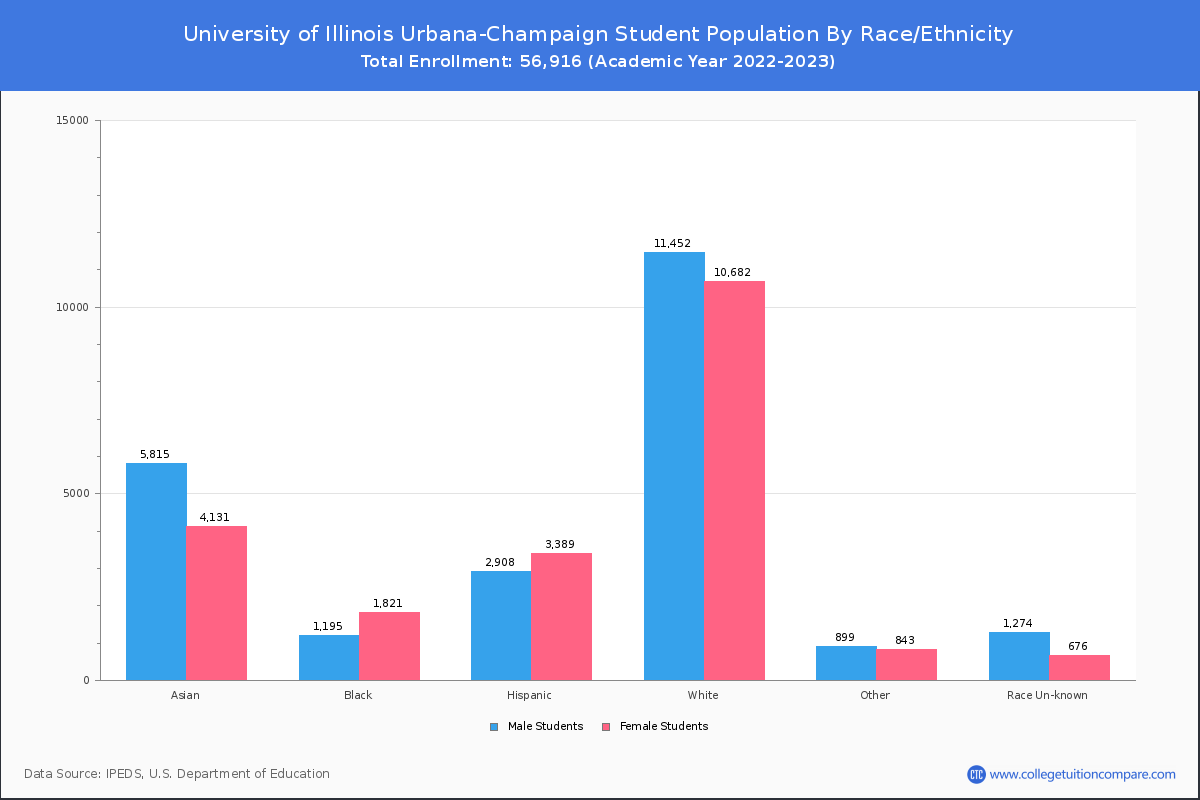
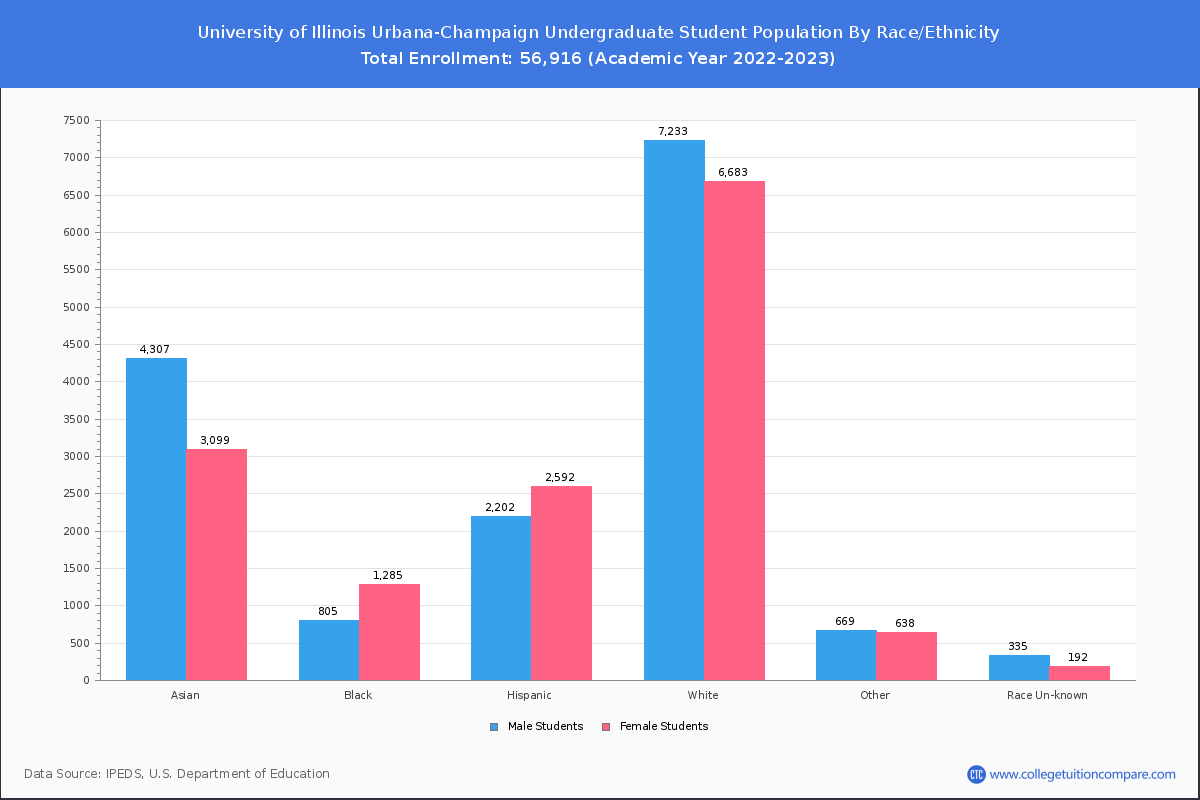
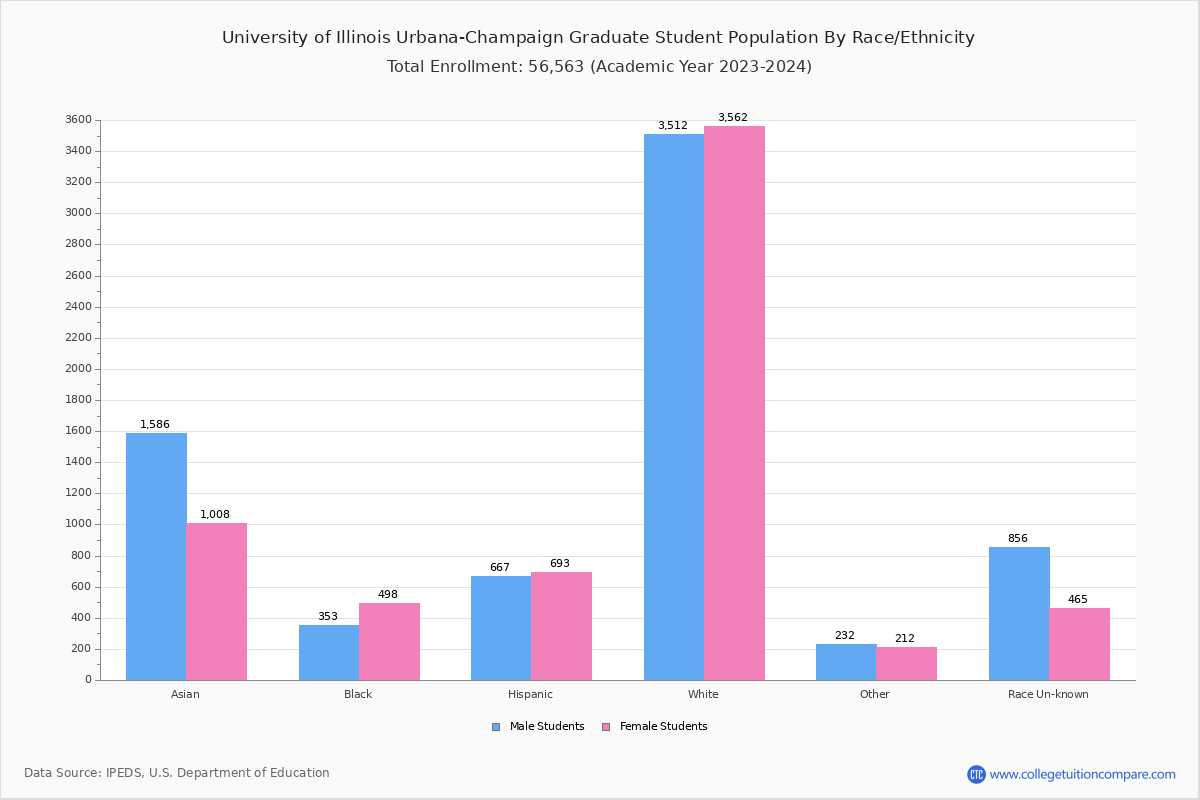
Student Distribution by Race/Ethnicity
By race/ethnicity, 21,268 White, 2,956 Black, and 10,117 Asian students out of a total of 56,916 are attending at University of Illinois Urbana-Champaign. Comprehensive enrollment statistic data by race/ethnicity is shown in the next chart (Academic year 2022-2023 data).
| Race | Total | Men | Women |
|---|---|---|---|
| American Indian or Native American | 25 | 16 | 9 |
| Asian | 10,117 | 5,797 | 4,320 |
| Black | 2,956 | 1,175 | 1,781 |
| Hispanic | 6,138 | 2,804 | 3,334 |
| Native Hawaiian or Other Pacific Islanders | 29 | 20 | 9 |
| White | 21,268 | 10,854 | 10,414 |
| Two or more races | 1,650 | 835 | 815 |
| Race Unknown | 1,942 | 1,233 | 709 |
| Race | Total | Men | Women |
|---|---|---|---|
| American Indian or Native American | 11 | 6 | 5 |
| Asian | 7,608 | 4,320 | 3,288 |
| Black | 2,041 | 799 | 1,242 |
| Hispanic | 4,720 | 2,107 | 2,613 |
| Native Hawaiian or Other Pacific Islanders | 11 | 10 | 1 |
| White | 13,628 | 6,960 | 6,668 |
| Two or more races | 1,240 | 617 | 623 |
| Race Unknown | 518 | 315 | 203 |
| Race | Total | Men | Women |
|---|---|---|---|
| American Indian or Native American | 1 | 1 | 0 |
| Asian | 132 | 82 | 50 |
| Black | 91 | 40 | 51 |
| Hispanic | 186 | 86 | 100 |
| Native Hawaiian or Other Pacific Islanders | 2 | 1 | 1 |
| White | 674 | 366 | 308 |
| Two or more races | 47 | 28 | 19 |
| Race Unknown | 22 | 20 | 2 |
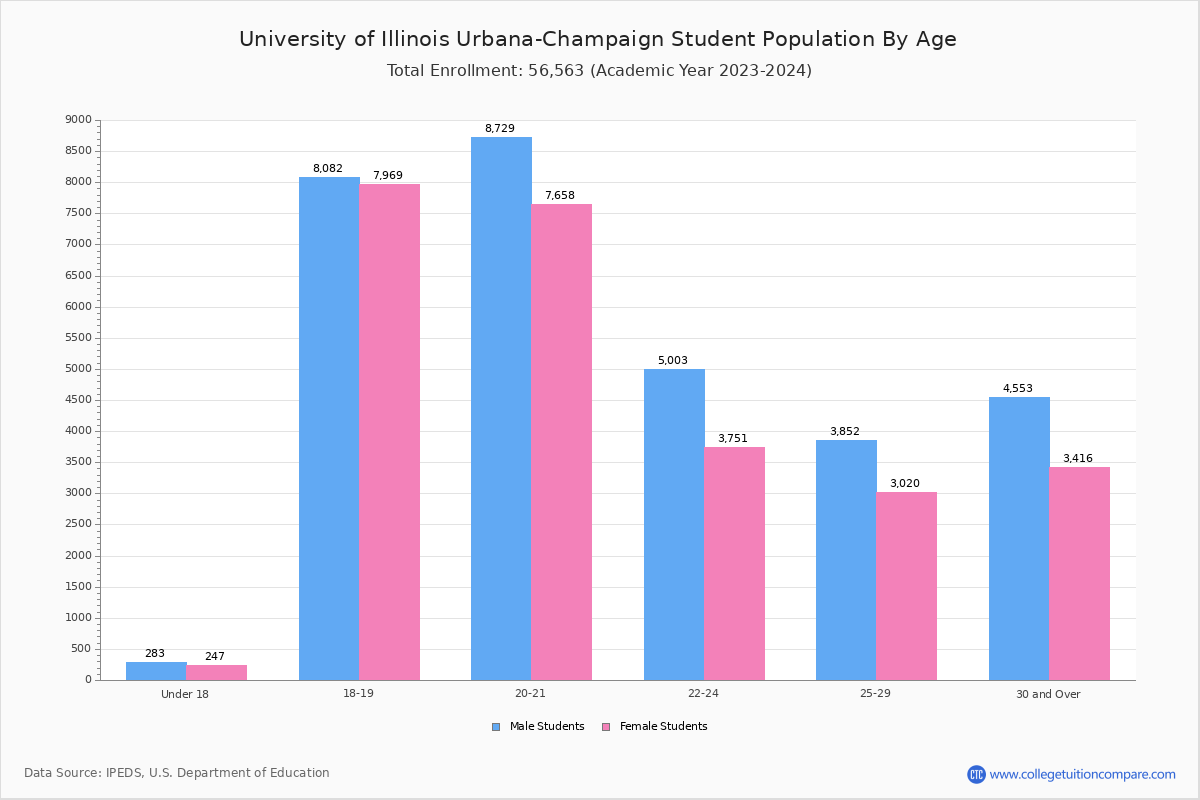
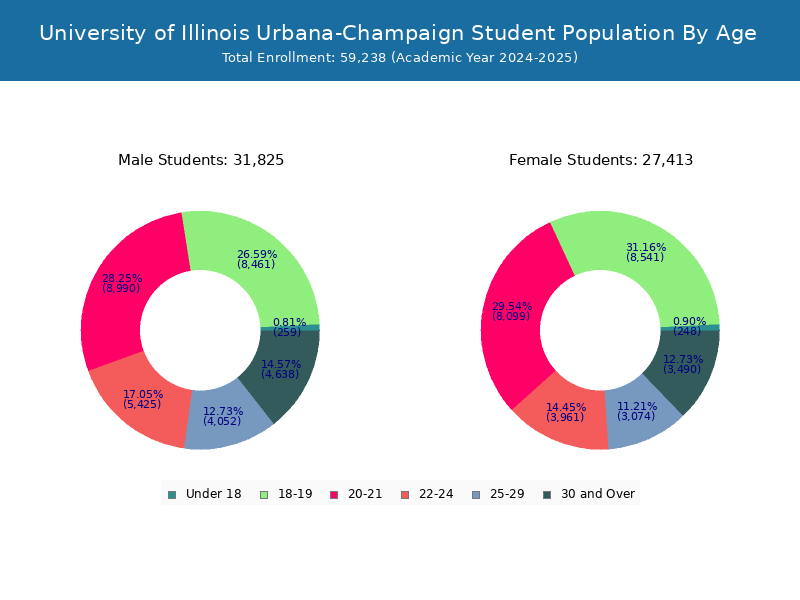
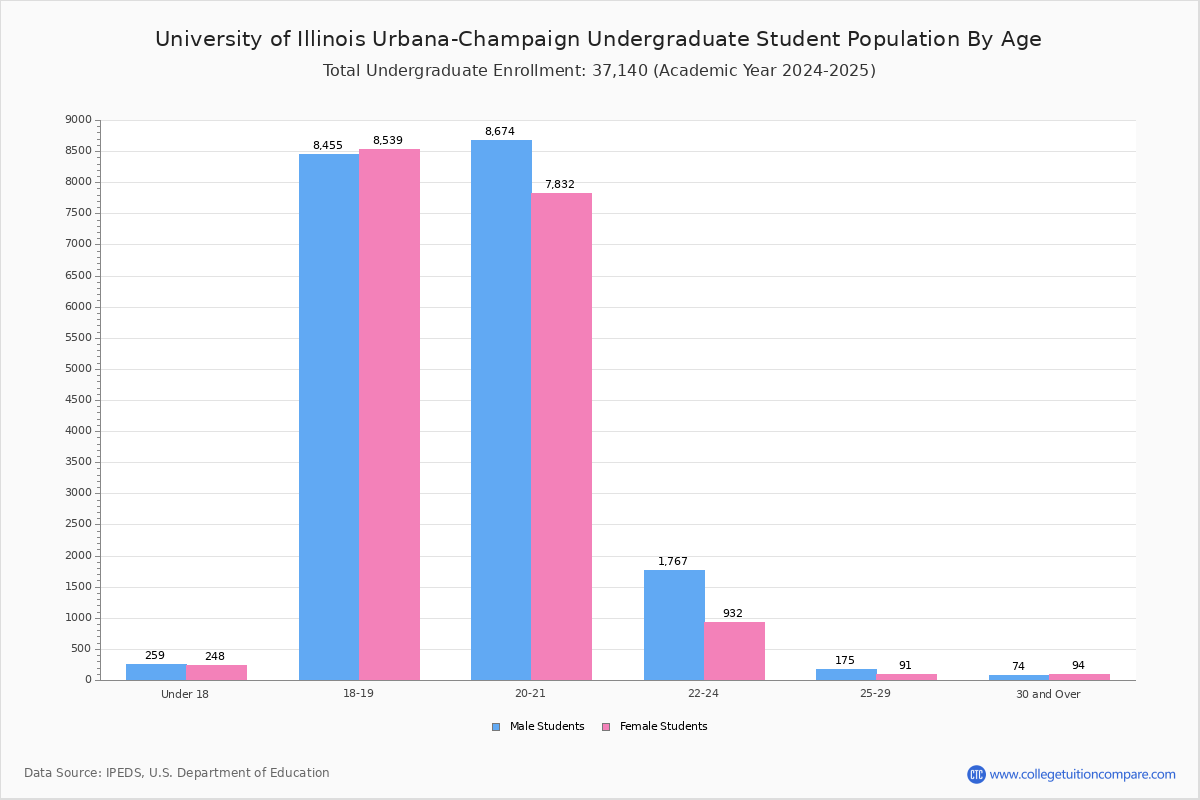
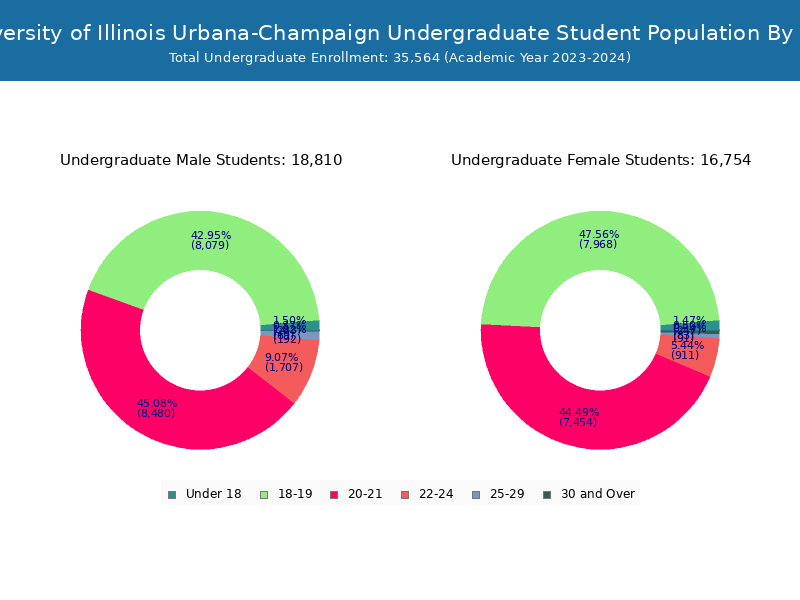
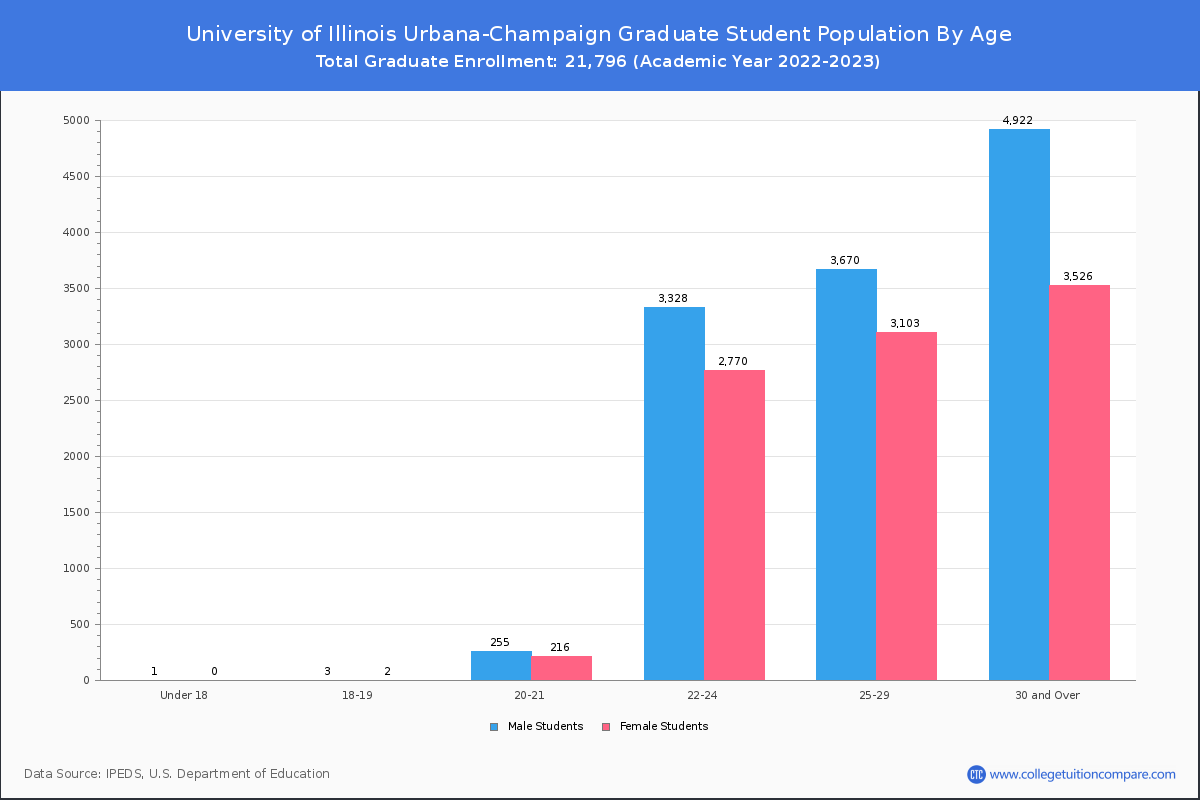
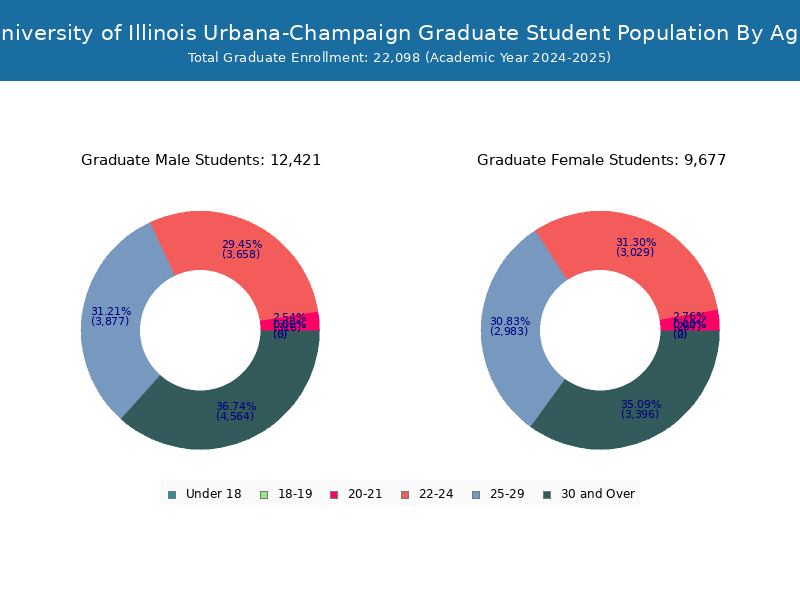
Student Age Distribution
By age, UIUC has 585 students under 18 years old and 18 students over 65 years old. There are 41,226 students under 25 years old, and 15,690 students over 25 years old out of 56,916 total students.
In undergraduate programs, 584 students are younger than 18 and 2 students are older than 65. UIUC has 34,651 undergraduate students aged under 25 and 469 students aged 25 and over.
In graduate schools at UIUC, 1 students are younger than 18 and 16 students are older than 65. It has 6,575 graduate students aged under 25 and 15,221 students aged 25 and over.
| Age | Total | Men | Women |
|---|---|---|---|
| Under 18 | 585 | 276 | 309 |
| 18-19 | 15,640 | 7,555 | 8,085 |
| 20-21 | 16,119 | 7,513 | 8,606 |
| 22-24 | 8,882 | 3,762 | 5,120 |
| 25-29 | 7,079 | 3,210 | 3,869 |
| 30-34 | 3,405 | 1,409 | 1,996 |
| 35-39 | 2,131 | 849 | 1,282 |
| 40-49 | 2,316 | 974 | 1,342 |
| 50-64 | 741 | 361 | 380 |
| Over 65 | 18 | 7 | 11 |
| Age | Total | Men | Women |
|---|---|---|---|
| Under 18 | 584 | 276 | 308 |
| 18-19 | 15,635 | 7,553 | 8,082 |
| 20-21 | 15,648 | 7,297 | 8,351 |
| 22-24 | 2,784 | 992 | 1,792 |
| 25-29 | 306 | 107 | 199 |
| 30-34 | 79 | 26 | 53 |
| 35-39 | 27 | 10 | 17 |
| 40-49 | 31 | 19 | 12 |
| 50-64 | 24 | 19 | 5 |
| Over 65 | 2 | 0 | 2 |
| Age | Total | Men | Women |
|---|---|---|---|
| Under 18 | 1 | 0 | 1 |
| 18-19 | 5 | 2 | 3 |
| 20-21 | 471 | 216 | 255 |
| 22-24 | 6,098 | 2,770 | 3,328 |
| 25-29 | 6,773 | 3,103 | 3,670 |
| 30-34 | 3,326 | 1,383 | 1,943 |
| 35-39 | 2,104 | 839 | 1,265 |
| 40-49 | 2,285 | 955 | 1,330 |
| 50-64 | 717 | 342 | 375 |
| Over 65 | 16 | 7 | 9 |
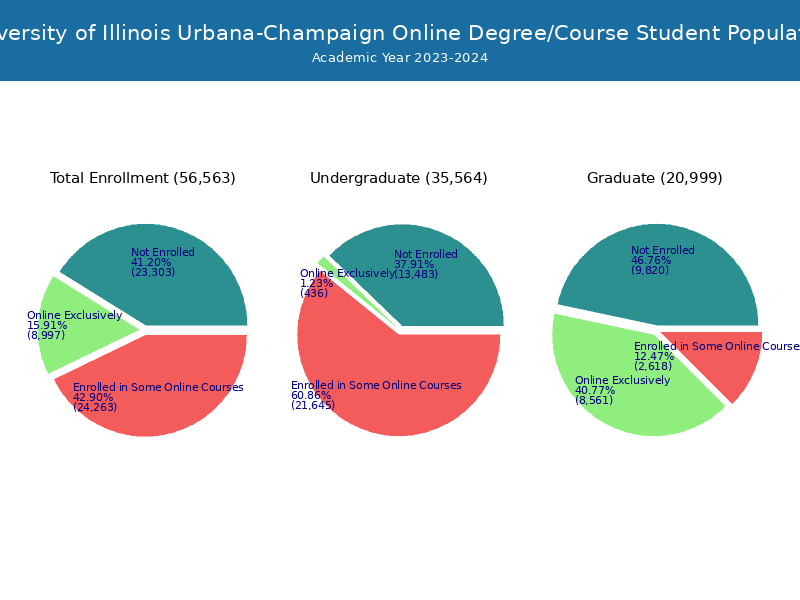
Online Student Enrollment
Distance learning, also called online education, is very attractive to students, especially who want to continue education and work in field. At University of Illinois Urbana-Champaign, 9,915 students are enrolled exclusively in online courses and 25,151 students are enrolled in some online courses.
3,529 students lived in Illinois or jurisdiction in which the school is located are enrolled exclusively in online courses and 6,386 students live in other State or outside of the United States.
| All Students | Enrolled Exclusively Online Courses | Enrolled in Some Online Courses | |
|---|---|---|---|
| All Students | 56,916 | 9,915 | 25,151 |
| Undergraduate | 35,120 | 658 | 21,798 |
| Graduate | 21,796 | 9,257 | 3,353 |
| Illinois Residents | Other States in U.S. | Outside of U.S. | |
|---|---|---|---|
| All Students | 3,529 | 5,135 | 1,251 |
| Undergraduate | 378 | 159 | 121 |
| Graduate | 3,151 | 4,976 | 1,130 |
Transfer-in Students (Undergraduate)
Among 35,120 enrolled in undergraduate programs, 1,390 students have transferred-in from other institutions. The percentage of transfer-in students is 3.96%.1,264 students have transferred in as full-time status and 126 students transferred in as part-time status.
| Number of Students | |
|---|---|
| Regular Full-time | 32,549 |
| Transfer-in Full-time | 1,264 |
| Regular Part-time | 1,181 |
| Transfer-in Part-time | 126 |