Student Population by Gender
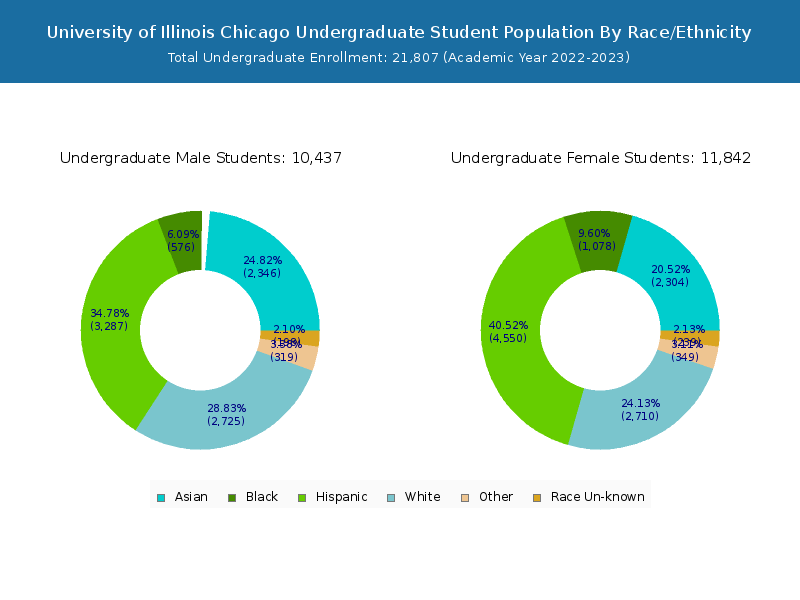
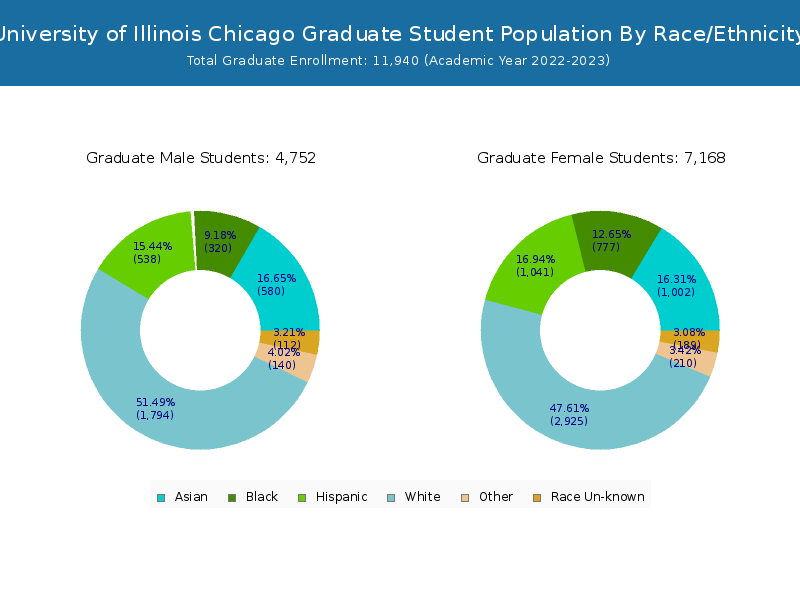
University of Illinois Chicago has a total of 33,747 enrolled students for the academic year 2022-2023. 21,807 students have enrolled in undergraduate programs and 11,940 students joined graduate programs.
By gender, 14,969 male and 18,778 female students (the male-female ratio is 44:56) are attending the school. The gender distribution is based on the 2022-2023 data.
| Total | Undergraduate | Graduate | |
|---|---|---|---|
| Total | 33,747 | 21,807 | 11,940 |
| Men | 14,969 | 10,226 | 4,743 |
| Women | 18,778 | 11,581 | 7,197 |
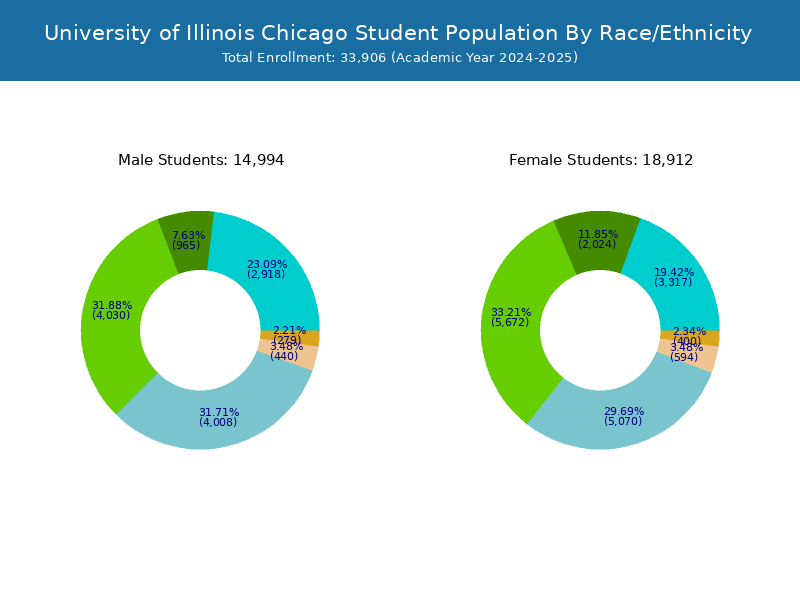
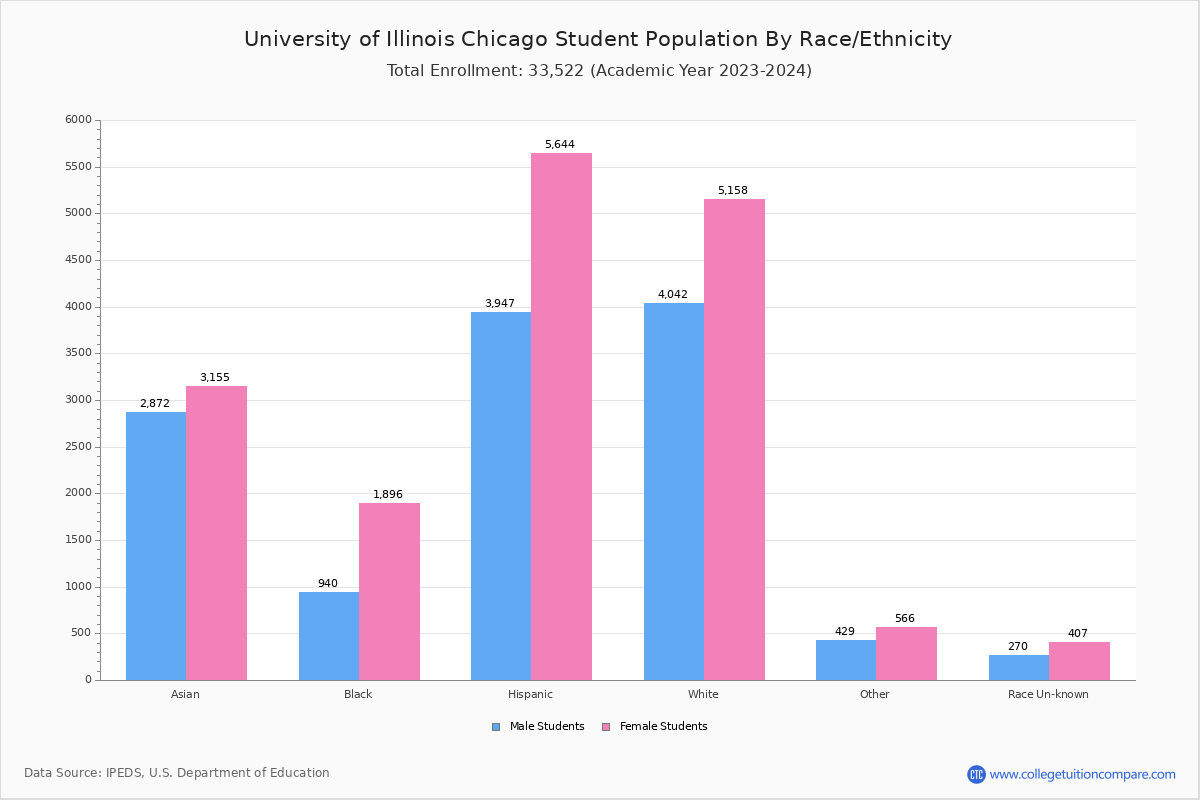
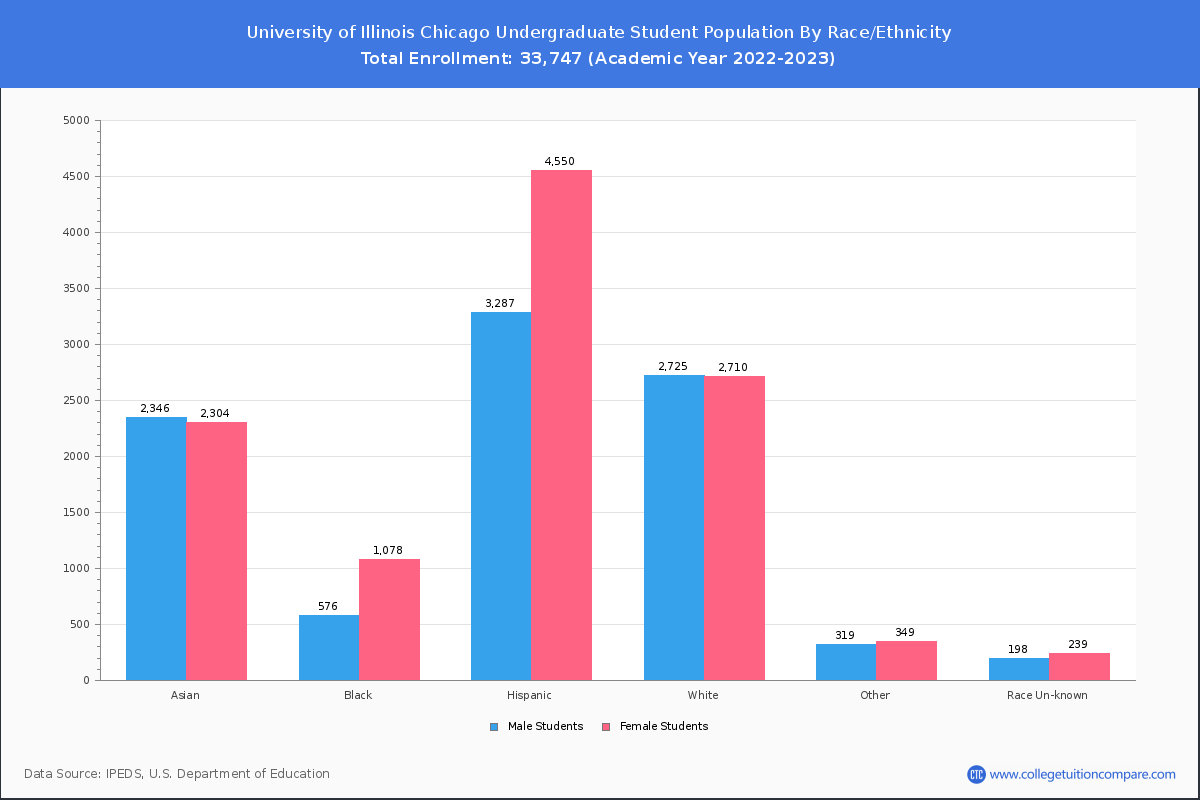
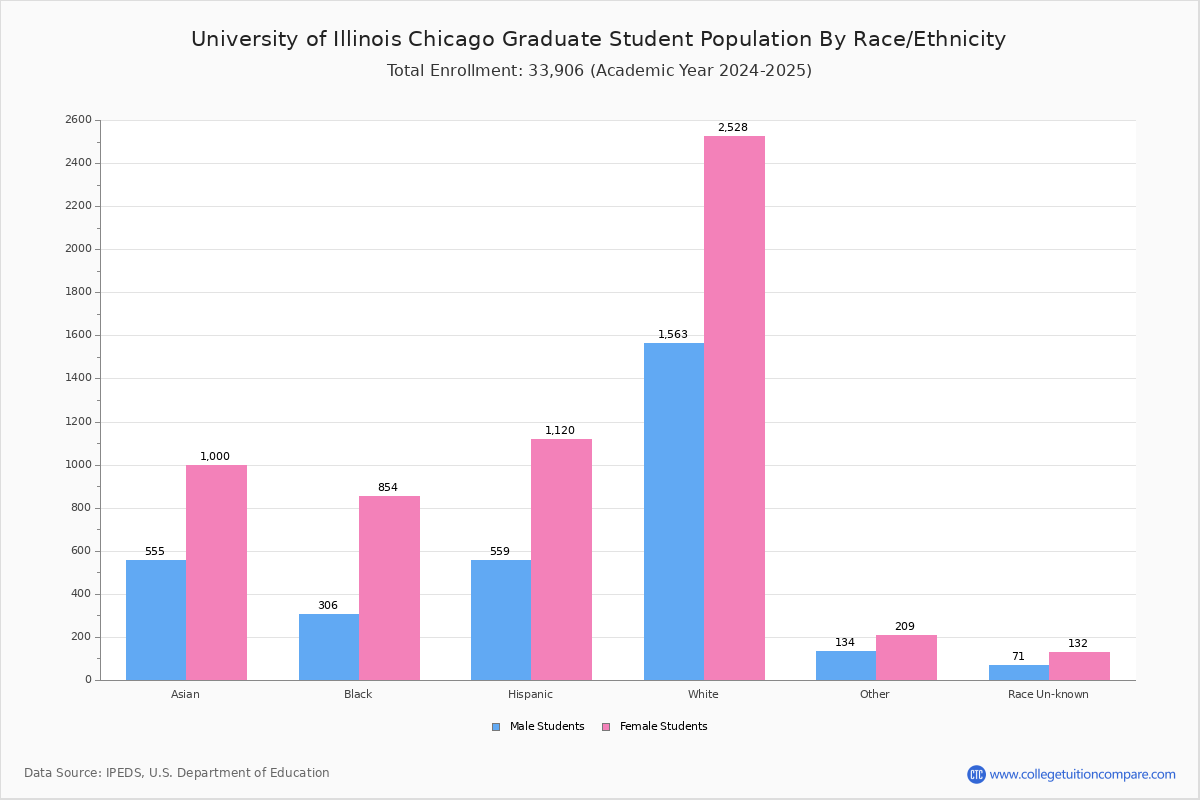
Student Distribution by Race/Ethnicity
By race/ethnicity, 9,531 White, 2,750 Black, and 6,093 Asian students out of a total of 33,747 are attending at University of Illinois Chicago. Comprehensive enrollment statistic data by race/ethnicity is shown in the next chart (Academic year 2022-2023 data).
| Race | Total | Men | Women |
|---|---|---|---|
| American Indian or Native American | 23 | 10 | 13 |
| Asian | 6,093 | 2,858 | 3,235 |
| Black | 2,750 | 894 | 1,856 |
| Hispanic | 9,473 | 3,849 | 5,624 |
| Native Hawaiian or Other Pacific Islanders | 7 | 4 | 3 |
| White | 9,531 | 4,209 | 5,322 |
| Two or more races | 962 | 416 | 546 |
| Race Unknown | 645 | 281 | 364 |
| Race | Total | Men | Women |
|---|---|---|---|
| American Indian or Native American | 9 | 4 | 5 |
| Asian | 4,545 | 2,313 | 2,232 |
| Black | 1,643 | 604 | 1,039 |
| Hispanic | 7,853 | 3,319 | 4,534 |
| Native Hawaiian or Other Pacific Islanders | 5 | 4 | 1 |
| White | 5,047 | 2,498 | 2,549 |
| Two or more races | 639 | 303 | 336 |
| Race Unknown | 424 | 193 | 231 |
| Race | Total | Men | Women |
|---|---|---|---|
| American Indian or Native American | 0 | 0 | 0 |
| Asian | 321 | 170 | 151 |
| Black | 182 | 65 | 117 |
| Hispanic | 690 | 302 | 388 |
| Native Hawaiian or Other Pacific Islanders | 2 | 1 | 1 |
| White | 679 | 320 | 359 |
| Two or more races | 88 | 35 | 53 |
| Race Unknown | 71 | 30 | 41 |
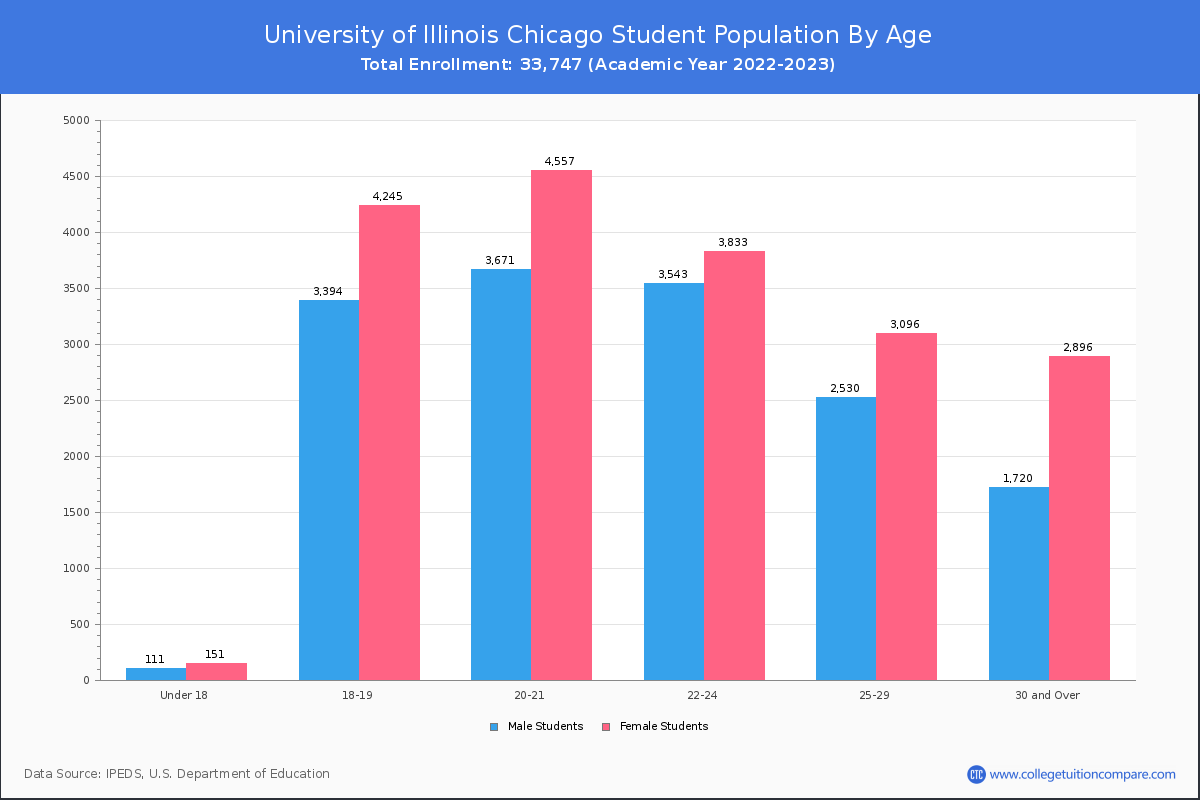
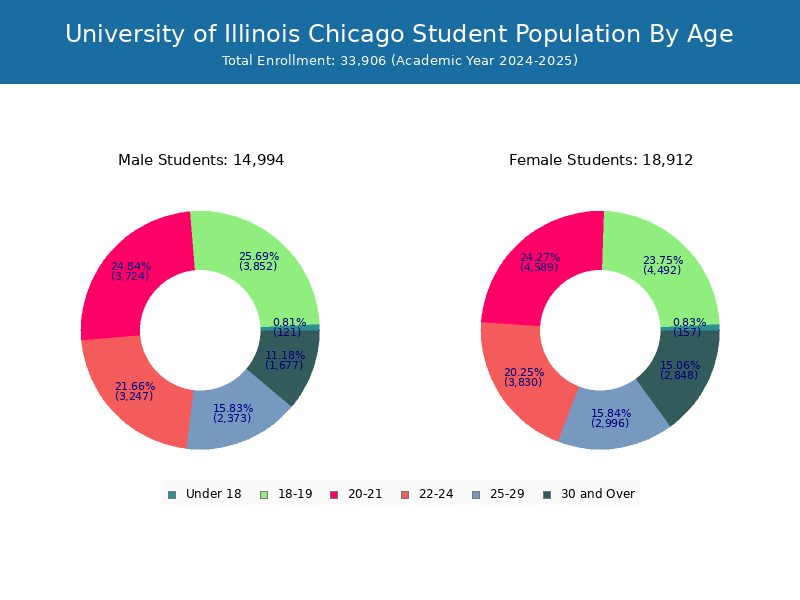
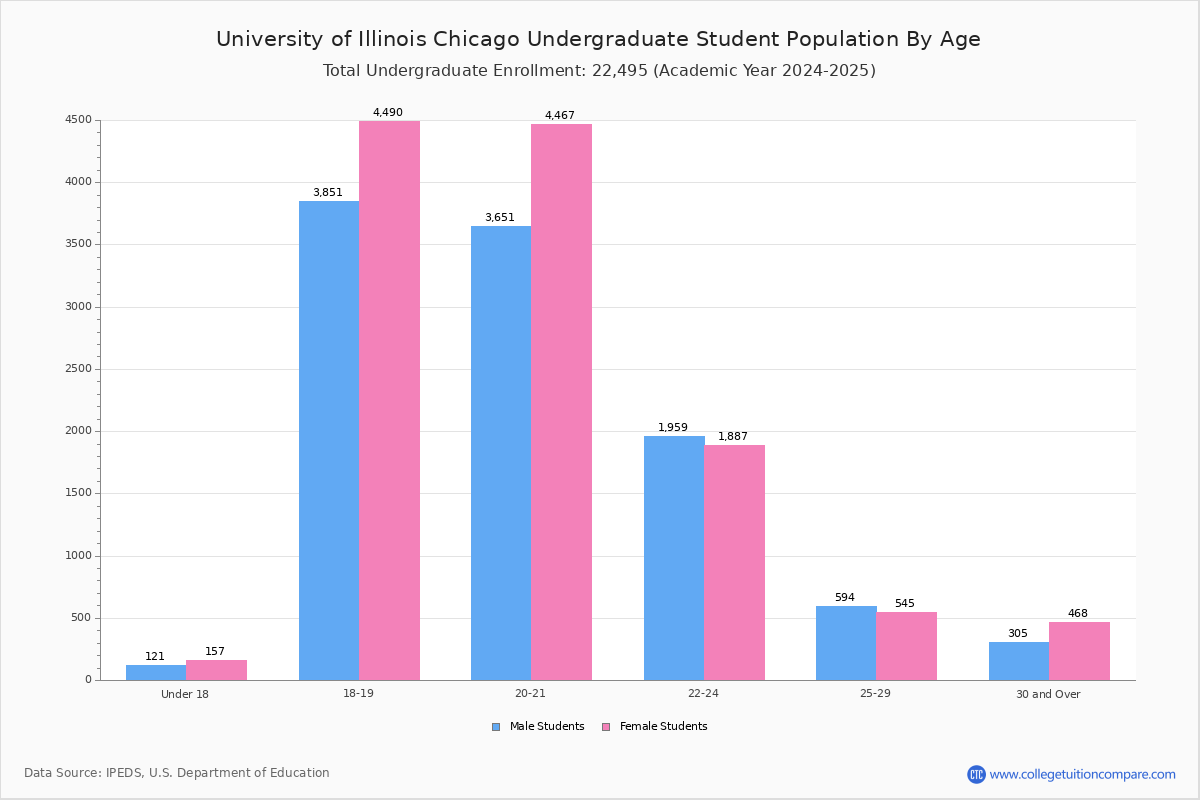
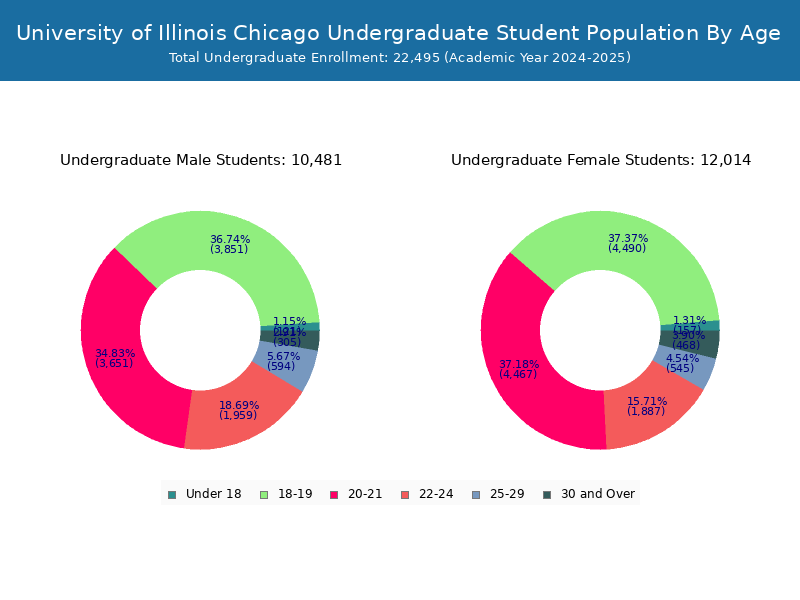
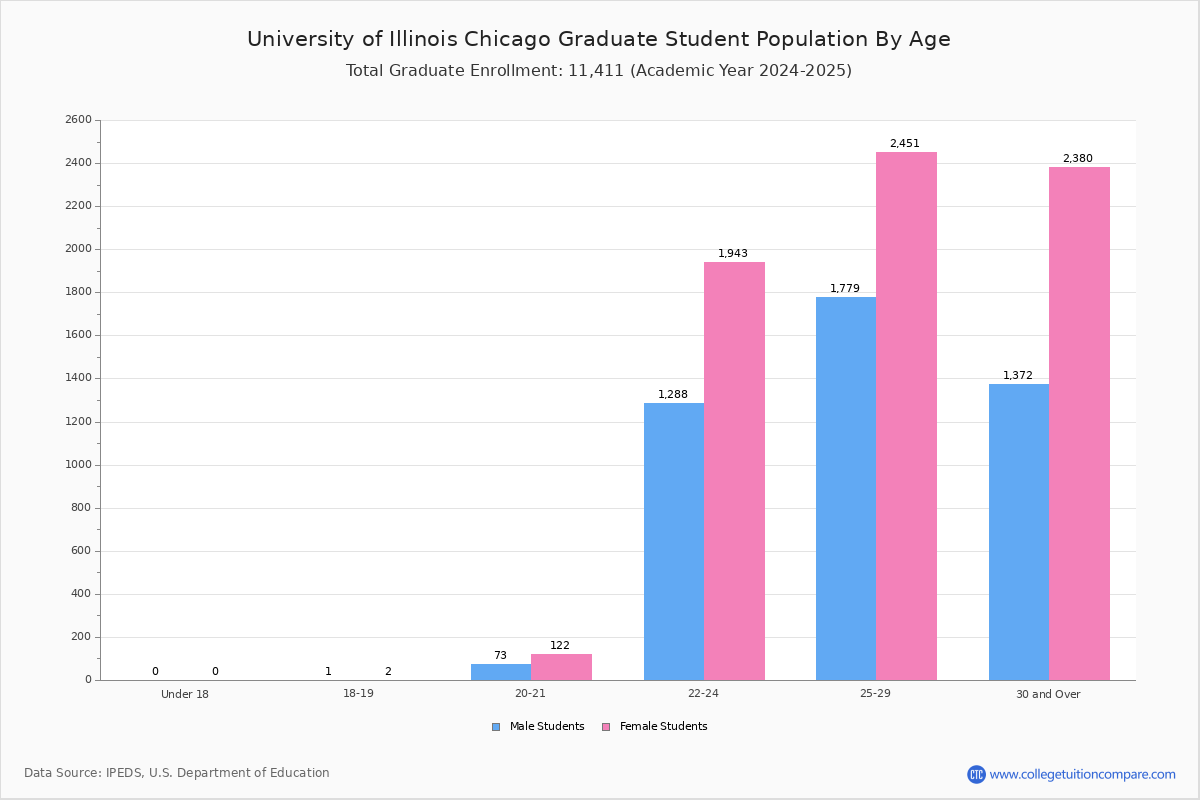
Student Age Distribution
By age, UIC has 262 students under 18 years old and 30 students over 65 years old. There are 23,505 students under 25 years old, and 10,242 students over 25 years old out of 33,747 total students.
In undergraduate programs, 262 students are younger than 18 and 3 students are older than 65. UIC has 19,917 undergraduate students aged under 25 and 1,890 students aged 25 and over.
It has 3,588 graduate students aged under 25 and 8,352 students aged 25 and over.

| Age | Total | Men | Women |
|---|---|---|---|
| Under 18 | 262 | 151 | 111 |
| 18-19 | 7,639 | 4,245 | 3,394 |
| 20-21 | 8,228 | 4,557 | 3,671 |
| 22-24 | 7,376 | 3,833 | 3,543 |
| 25-29 | 5,626 | 3,096 | 2,530 |
| 30-34 | 2,099 | 1,236 | 863 |
| 35-39 | 1,064 | 695 | 369 |
| 40-49 | 1,010 | 657 | 353 |
| 50-64 | 413 | 292 | 121 |
| Over 65 | 30 | 16 | 14 |
| Age | Total | Men | Women |
|---|---|---|---|
| Under 18 | 262 | 151 | 111 |
| 18-19 | 7,636 | 4,243 | 3,393 |
| 20-21 | 8,021 | 4,442 | 3,579 |
| 22-24 | 3,998 | 1,798 | 2,200 |
| 25-29 | 1,181 | 544 | 637 |
| 30-34 | 347 | 186 | 161 |
| 35-39 | 170 | 99 | 71 |
| 40-49 | 130 | 78 | 52 |
| 50-64 | 59 | 39 | 20 |
| Over 65 | 3 | 1 | 2 |
| Age | Total | Men | Women |
|---|
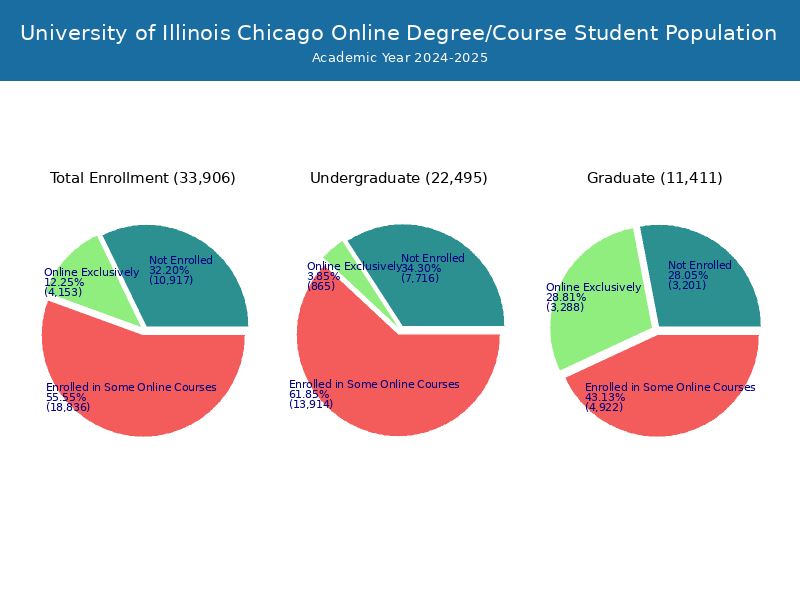
Online Student Enrollment
Distance learning, also called online education, is very attractive to students, especially who want to continue education and work in field. At University of Illinois Chicago, 4,049 students are enrolled exclusively in online courses and 20,091 students are enrolled in some online courses.
2,941 students lived in Illinois or jurisdiction in which the school is located are enrolled exclusively in online courses and 1,108 students live in other State or outside of the United States.
| All Students | Enrolled Exclusively Online Courses | Enrolled in Some Online Courses | |
|---|---|---|---|
| All Students | 33,747 | 4,049 | 20,091 |
| Undergraduate | 21,807 | 773 | 14,388 |
| Graduate | 11,940 | 3,276 | 5,703 |
| Illinois Residents | Other States in U.S. | Outside of U.S. | |
|---|---|---|---|
| All Students | 2,941 | 681 | 427 |
| Undergraduate | 709 | 43 | 21 |
| Graduate | 2,232 | 638 | 406 |
Transfer-in Students (Undergraduate)
Among 21,807 enrolled in undergraduate programs, 2,110 students have transferred-in from other institutions. The percentage of transfer-in students is 9.68%.1,784 students have transferred in as full-time status and 326 students transferred in as part-time status.
| Number of Students | |
|---|---|
| Regular Full-time | 17,944 |
| Transfer-in Full-time | 1,784 |
| Regular Part-time | 1,753 |
| Transfer-in Part-time | 326 |