Student Population by Gender
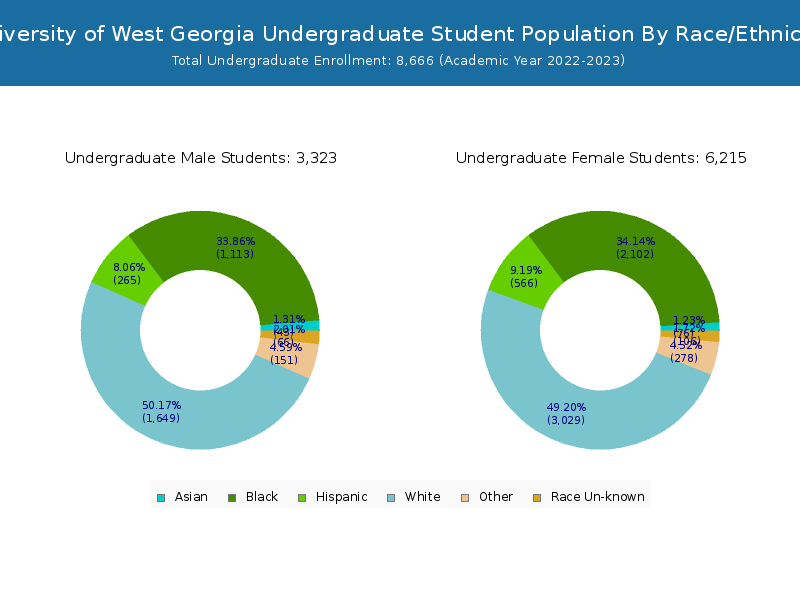
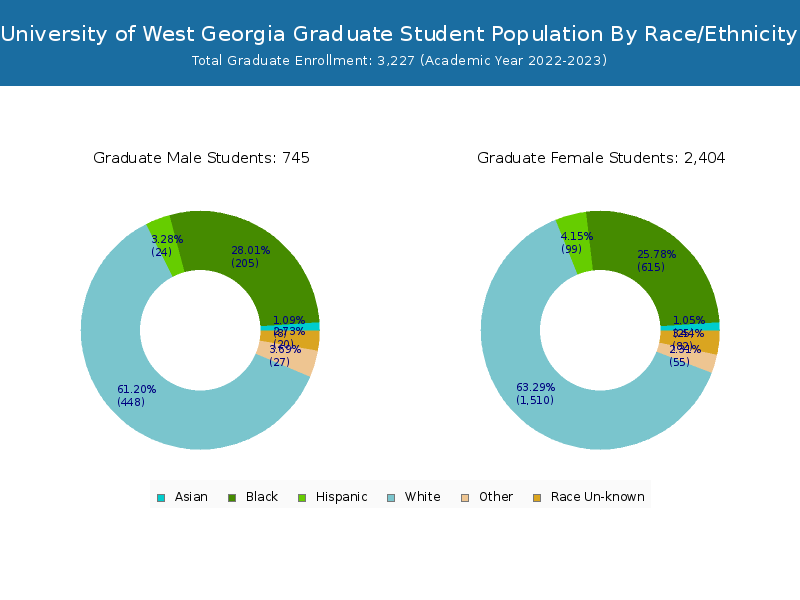
University of West Georgia has a total of 11,893 enrolled students for the academic year 2022-2023. 8,666 students have enrolled in undergraduate programs and 3,227 students joined graduate programs.
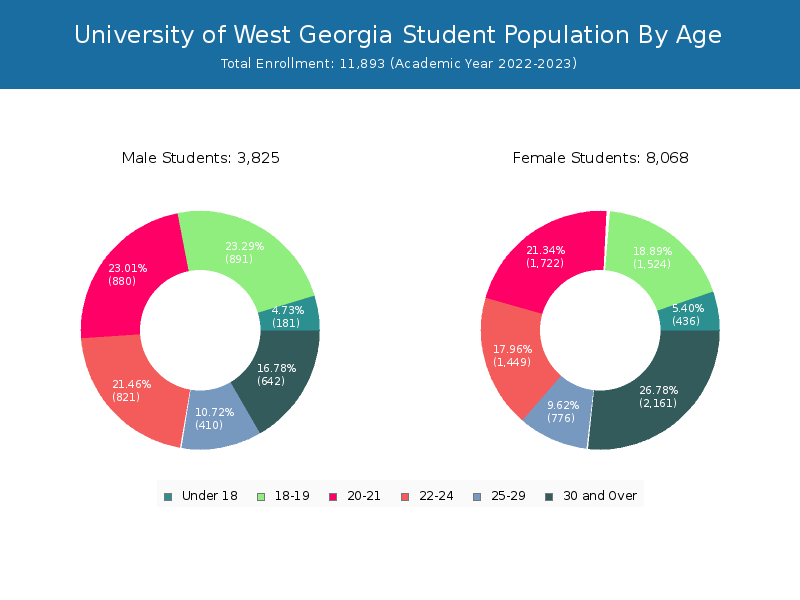
By gender, 3,825 male and 8,068 female students (the male-female ratio is 32:68) are attending the school. The gender distribution is based on the 2022-2023 data.
| Total | Undergraduate | Graduate | |
|---|---|---|---|
| Total | 11,893 | 8,666 | 3,227 |
| Men | 3,825 | 3,074 | 751 |
| Women | 8,068 | 5,592 | 2,476 |
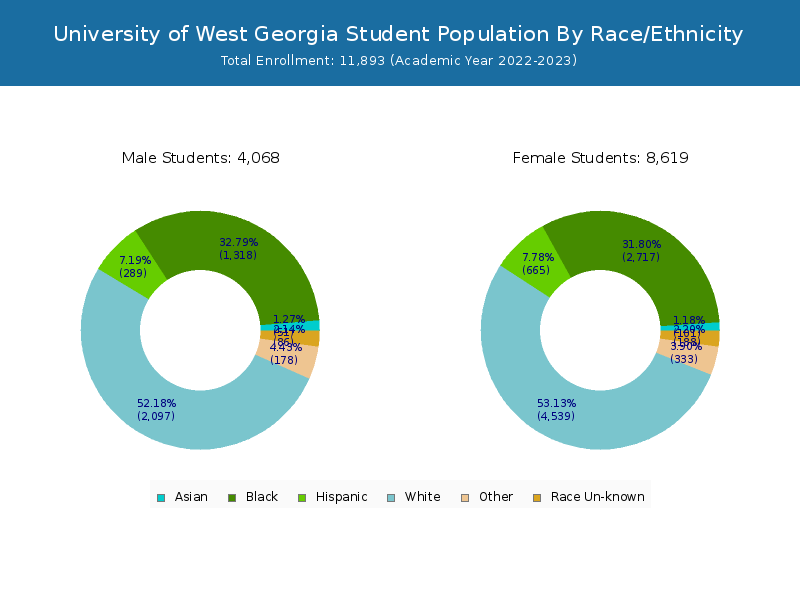
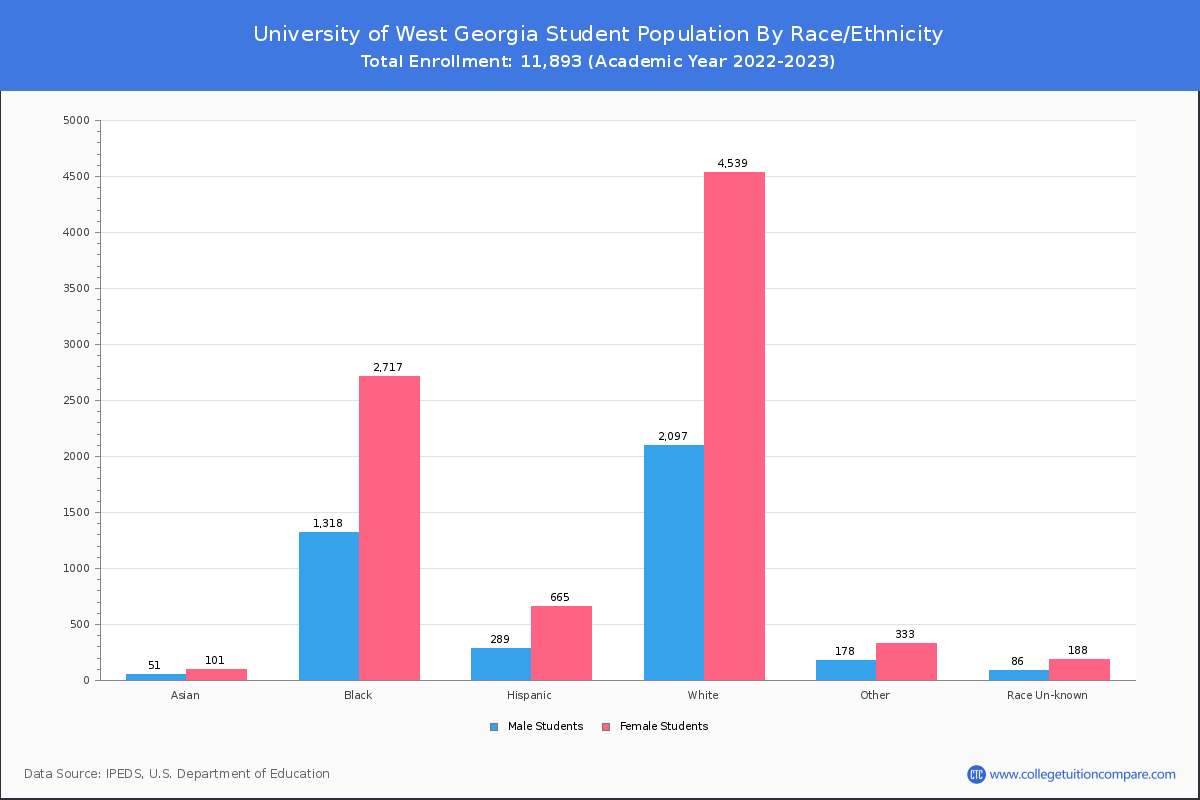
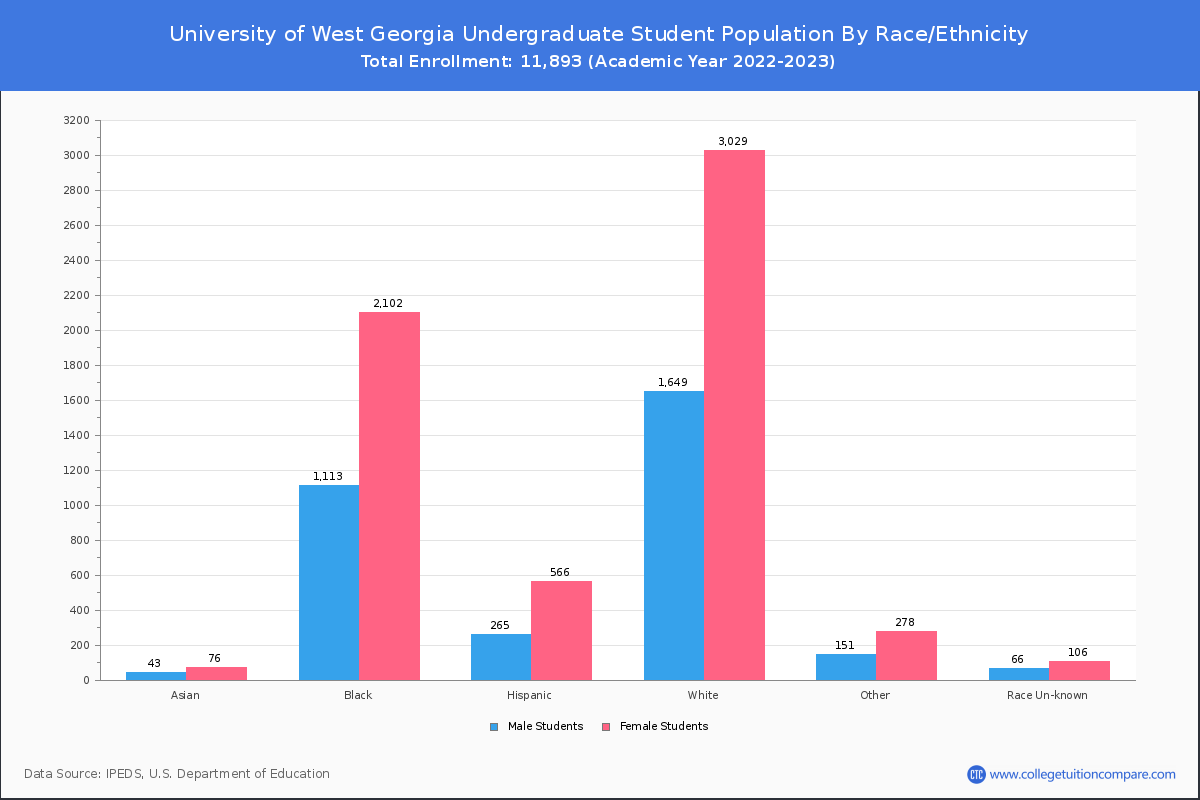
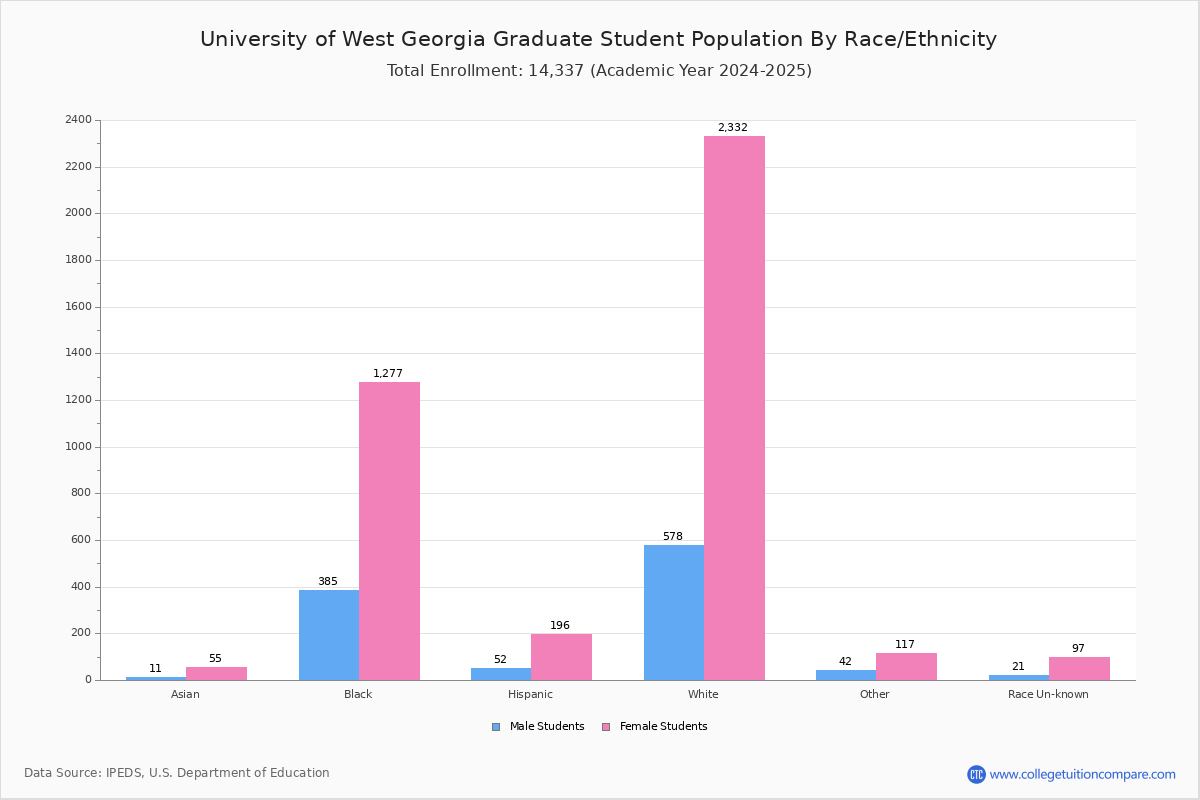
Student Distribution by Race/Ethnicity
By race/ethnicity, 6,370 White, 3,616 Black, and 142 Asian students out of a total of 11,893 are attending at University of West Georgia. Comprehensive enrollment statistic data by race/ethnicity is shown in the next chart (Academic year 2022-2023 data).
| Race | Total | Men | Women |
|---|---|---|---|
| American Indian or Native American | 19 | 8 | 11 |
| Asian | 142 | 44 | 98 |
| Black | 3,616 | 1,166 | 2,450 |
| Hispanic | 887 | 258 | 629 |
| Native Hawaiian or Other Pacific Islanders | 10 | 3 | 7 |
| White | 6,370 | 2,034 | 4,336 |
| Two or more races | 474 | 158 | 316 |
| Race Unknown | 220 | 78 | 142 |
| Race | Total | Men | Women |
|---|---|---|---|
| American Indian or Native American | 14 | 6 | 8 |
| Asian | 113 | 36 | 77 |
| Black | 2,724 | 952 | 1,772 |
| Hispanic | 762 | 233 | 529 |
| Native Hawaiian or Other Pacific Islanders | 8 | 3 | 5 |
| White | 4,423 | 1,602 | 2,821 |
| Two or more races | 394 | 140 | 254 |
| Race Unknown | 140 | 62 | 78 |
| Race | Total | Men | Women |
|---|---|---|---|
| American Indian or Native American | 0 | 0 | 0 |
| Asian | 5 | 0 | 5 |
| Black | 189 | 62 | 127 |
| Hispanic | 50 | 14 | 36 |
| Native Hawaiian or Other Pacific Islanders | 0 | 0 | 0 |
| White | 304 | 117 | 187 |
| Two or more races | 32 | 10 | 22 |
| Race Unknown | 12 | 5 | 7 |
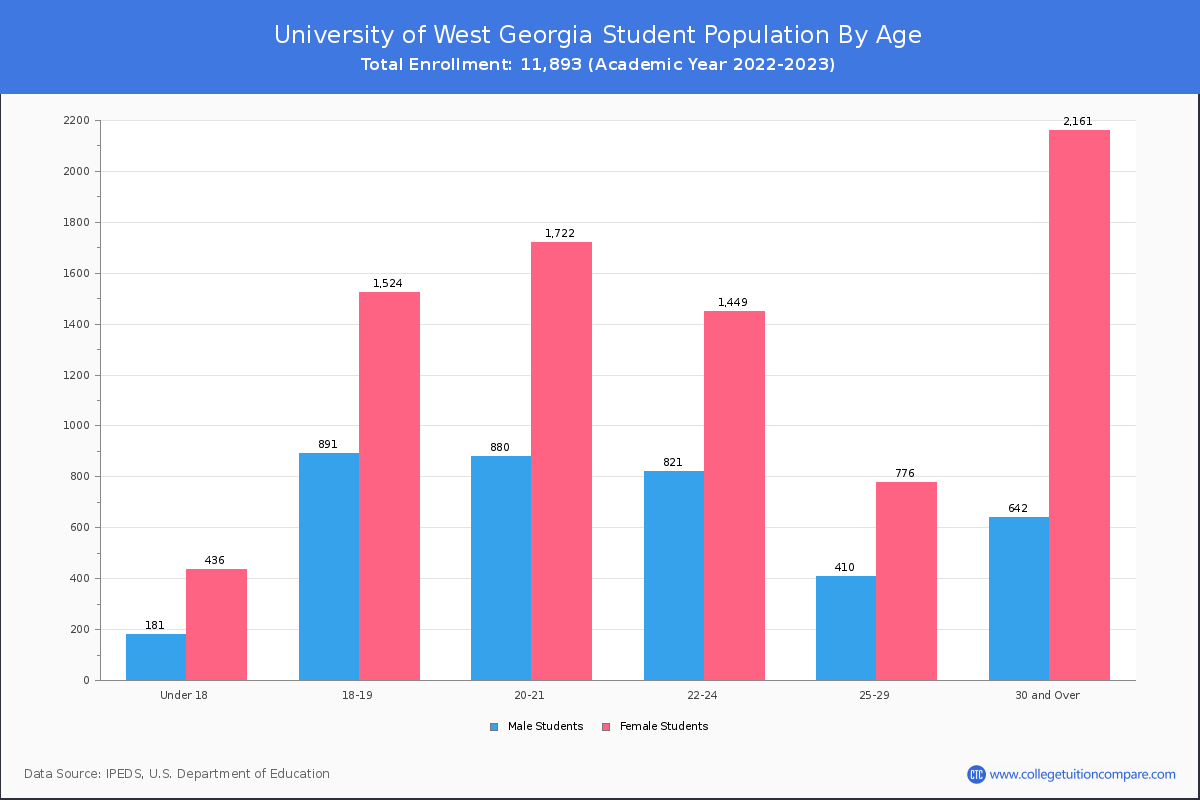
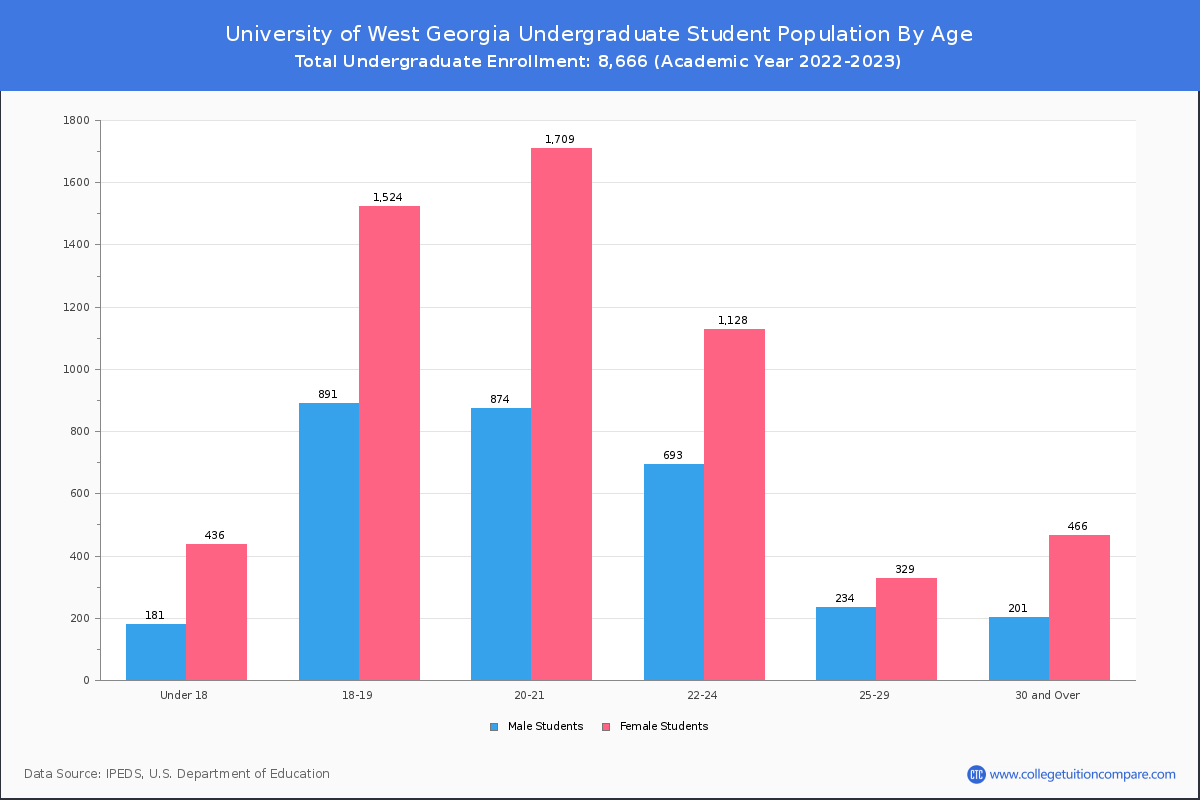
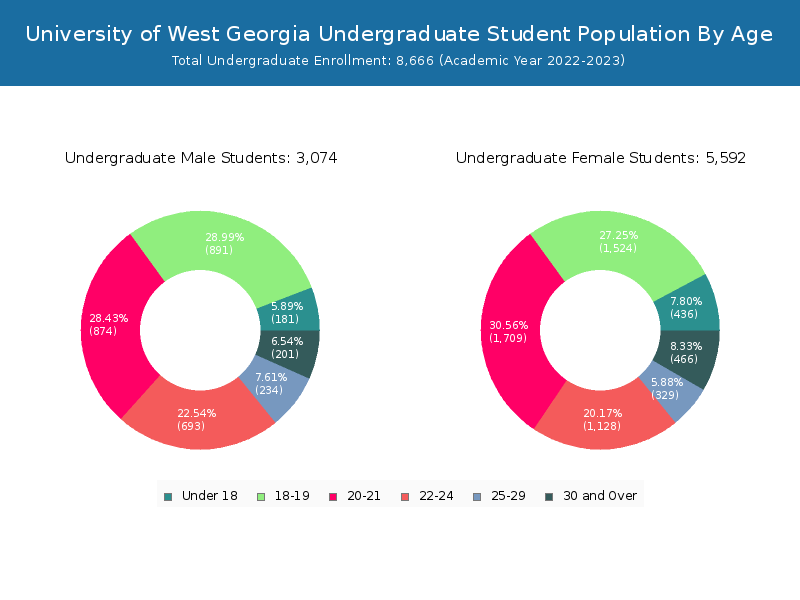
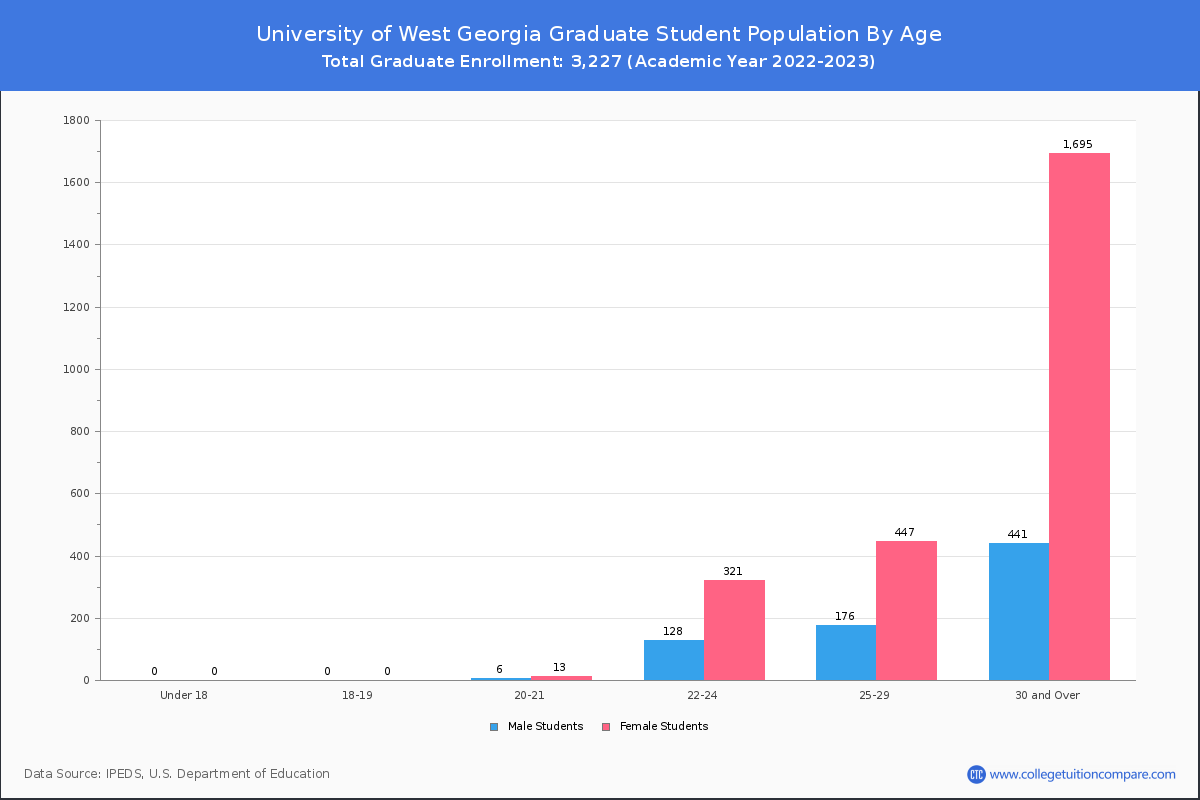
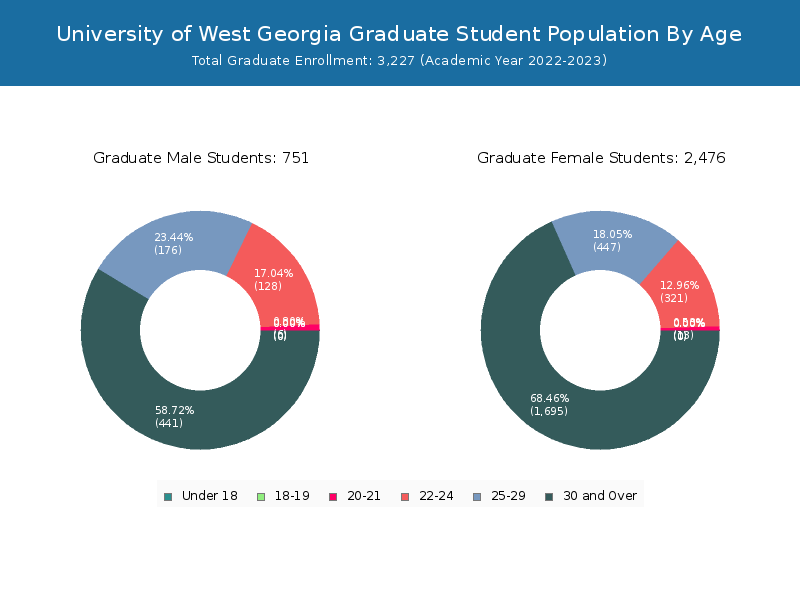
Student Age Distribution
By age, U of West Georgia has 617 students under 18 years old and 39 students over 65 years old. There are 7,904 students under 25 years old, and 3,989 students over 25 years old out of 11,893 total students.
In undergraduate programs, 617 students are younger than 18 and 25 students are older than 65. U of West Georgia has 7,436 undergraduate students aged under 25 and 1,230 students aged 25 and over.
It has 468 graduate students aged under 25 and 2,759 students aged 25 and over.
| Age | Total | Men | Women |
|---|---|---|---|
| Under 18 | 617 | 436 | 181 |
| 18-19 | 2,415 | 1,524 | 891 |
| 20-21 | 2,602 | 1,722 | 880 |
| 22-24 | 2,270 | 1,449 | 821 |
| 25-29 | 1,186 | 776 | 410 |
| 30-34 | 768 | 550 | 218 |
| 35-39 | 601 | 466 | 135 |
| 40-49 | 937 | 758 | 179 |
| 50-64 | 458 | 366 | 92 |
| Over 65 | 39 | 21 | 18 |
| Age | Total | Men | Women |
|---|---|---|---|
| Under 18 | 617 | 436 | 181 |
| 18-19 | 2,415 | 1,524 | 891 |
| 20-21 | 2,583 | 1,709 | 874 |
| 22-24 | 1,821 | 1,128 | 693 |
| 25-29 | 563 | 329 | 234 |
| 30-34 | 255 | 172 | 83 |
| 35-39 | 155 | 110 | 45 |
| 40-49 | 143 | 102 | 41 |
| 50-64 | 89 | 69 | 20 |
| Over 65 | 25 | 13 | 12 |
| Age | Total | Men | Women |
|---|
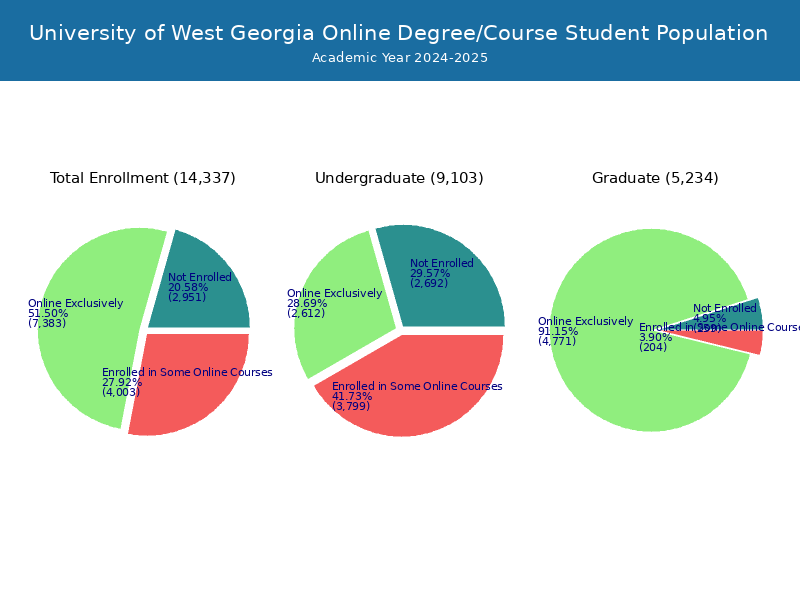
Online Student Enrollment
Distance learning, also called online education, is very attractive to students, especially who want to continue education and work in field. At University of West Georgia, 4,937 students are enrolled exclusively in online courses and 4,547 students are enrolled in some online courses.
4,680 students lived in Georgia or jurisdiction in which the school is located are enrolled exclusively in online courses and 257 students live in other State or outside of the United States.
| All Students | Enrolled Exclusively Online Courses | Enrolled in Some Online Courses | |
|---|---|---|---|
| All Students | 11,893 | 4,937 | 4,547 |
| Undergraduate | 8,666 | 2,198 | 4,349 |
| Graduate | 3,227 | 2,739 | 198 |
| Georgia Residents | Other States in U.S. | Outside of U.S. | |
|---|---|---|---|
| All Students | 4,680 | 225 | 32 |
| Undergraduate | 2,069 | 107 | 22 |
| Graduate | 2,611 | 118 | 10 |
Transfer-in Students (Undergraduate)
Among 8,666 enrolled in undergraduate programs, 596 students have transferred-in from other institutions. The percentage of transfer-in students is 6.88%.444 students have transferred in as full-time status and 152 students transferred in as part-time status.
| Number of Students | |
|---|---|
| Regular Full-time | 5,836 |
| Transfer-in Full-time | 444 |
| Regular Part-time | 2,234 |
| Transfer-in Part-time | 152 |