Student Population by Gender
Shorter University has a total of 1,515 enrolled students for the academic year 2022-2023. 1,373 students have enrolled in undergraduate programs and 142 students joined graduate programs.
By gender, 670 male and 845 female students (the male-female ratio is 44:56) are attending the school. The gender distribution is based on the 2022-2023 data.
| Total | Undergraduate | Graduate | |
|---|---|---|---|
| Total | 1,515 | 1,373 | 142 |
| Men | 670 | 606 | 64 |
| Women | 845 | 767 | 78 |
Student Distribution by Race/Ethnicity
| Race | Total | Men | Women |
|---|---|---|---|
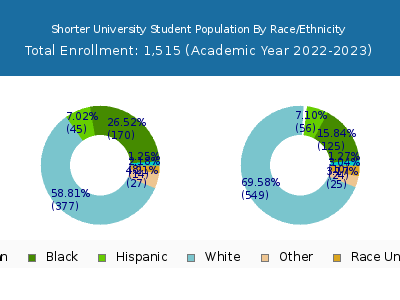
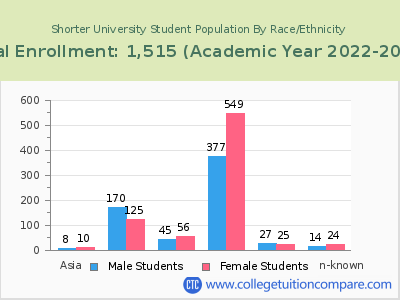
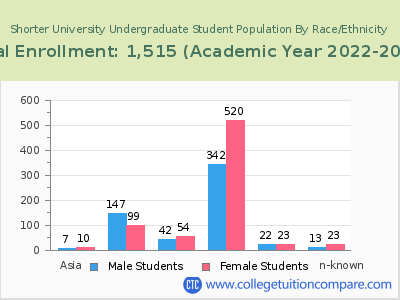
| American Indian or Native American | 9 | 4 | 5 |
| Asian | 19 | 5 | 14 |
| Black | 266 | 160 | 106 |
| Hispanic | 142 | 57 | 85 |
| Native Hawaiian or Other Pacific Islanders | 3 | 1 | 2 |
| White | 956 | 378 | 578 |
| Two or more races | 49 | 28 | 21 |
| Race Unknown | 42 | 18 | 24 |
| Race | Total | Men | Women |
|---|---|---|---|
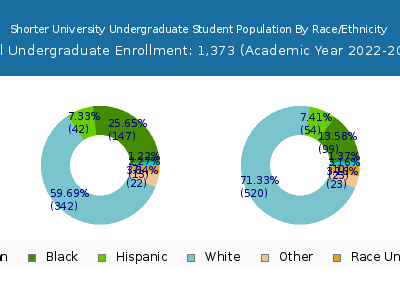
| American Indian or Native American | 9 | 4 | 5 |
| Asian | 15 | 5 | 10 |
| Black | 228 | 141 | 87 |
| Hispanic | 130 | 51 | 79 |
| Native Hawaiian or Other Pacific Islanders | 3 | 1 | 2 |
| White | 877 | 343 | 534 |
| Two or more races | 43 | 25 | 18 |
| Race Unknown | 39 | 17 | 22 |
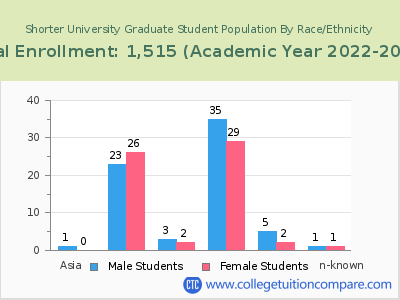
| Race | Total | Men | Women |
|---|---|---|---|
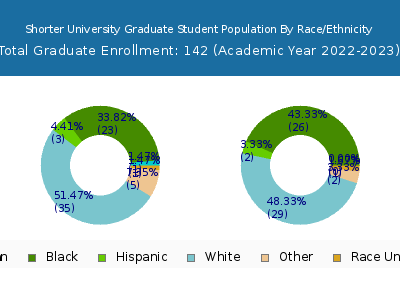
| American Indian or Native American | 0 | 0 | 0 |
| Asian | 1 | 0 | 1 |
| Black | 12 | 6 | 6 |
| Hispanic | 10 | 5 | 5 |
| Native Hawaiian or Other Pacific Islanders | 0 | 0 | 0 |
| White | 56 | 27 | 29 |
| Two or more races | 3 | 3 | 0 |
| Race Unknown | 1 | 0 | 1 |
Student Age Distribution
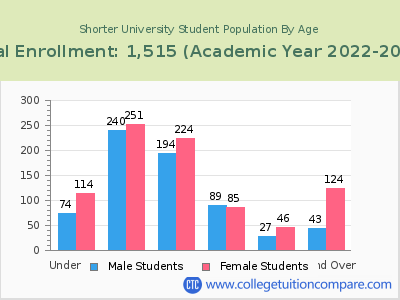
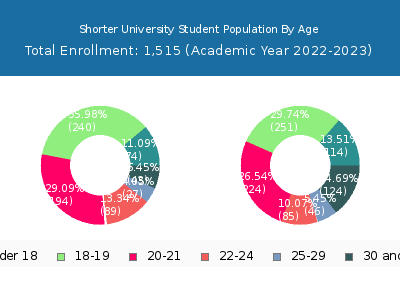
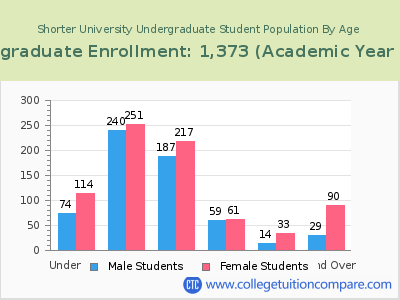
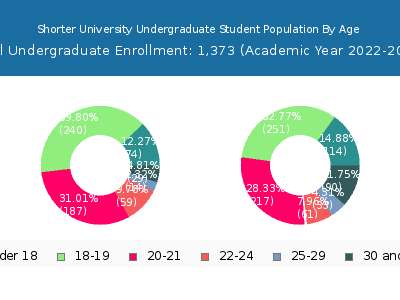
By age, Shorter has 188 students under 18 years old and 1 students over 65 years old. There are 1,271 students under 25 years old, and 240 students over 25 years old out of 1,515 total students.
In undergraduate programs, 188 students are younger than 18 and 1 students are older than 65. Shorter has 1,203 undergraduate students aged under 25 and 166 students aged 25 and over.
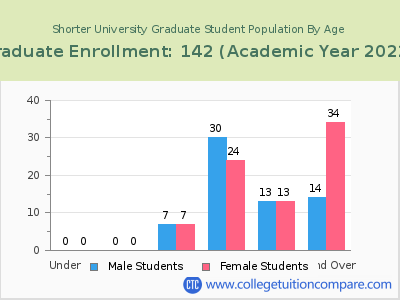
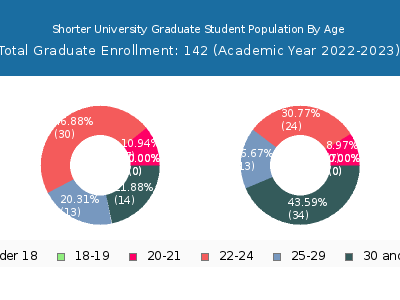
It has 68 graduate students aged under 25 and 74 students aged 25 and over.
| Age | Total | Men | Women |
|---|---|---|---|
| Under 18 | 188 | 114 | 74 |
| 18-19 | 491 | 251 | 240 |
| 20-21 | 418 | 224 | 194 |
| 22-24 | 174 | 85 | 89 |
| 25-29 | 73 | 46 | 27 |
| 30-34 | 31 | 19 | 12 |
| 35-39 | 30 | 24 | 6 |
| 40-49 | 60 | 49 | 11 |
| 50-64 | 45 | 32 | 13 |
| Over 65 | 1 | 0 | 1 |
| Age | Total | Men | Women |
|---|---|---|---|
| Under 18 | 188 | 114 | 74 |
| 18-19 | 491 | 251 | 240 |
| 20-21 | 404 | 217 | 187 |
| 22-24 | 120 | 61 | 59 |
| 25-29 | 47 | 33 | 14 |
| 30-34 | 22 | 15 | 7 |
| 35-39 | 23 | 20 | 3 |
| 40-49 | 44 | 36 | 8 |
| 50-64 | 29 | 19 | 10 |
| Over 65 | 1 | 0 | 1 |
| Age | Total | Men | Women |
|---|
Online Student Enrollment
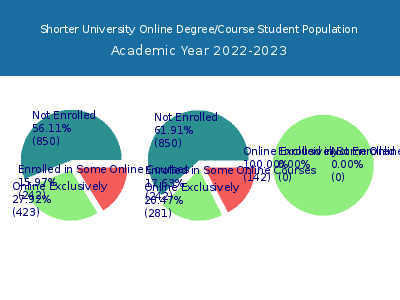
Distance learning, also called online education, is very attractive to students, especially who want to continue education and work in field. At Shorter University, 423 students are enrolled exclusively in online courses and 242 students are enrolled in some online courses.
363 students lived in Georgia or jurisdiction in which the school is located are enrolled exclusively in online courses and 60 students live in other State or outside of the United States.
| All Students | Enrolled Exclusively Online Courses | Enrolled in Some Online Courses | |
|---|---|---|---|
| All Students | 1,515 | 423 | 242 |
| Undergraduate | 1,373 | 281 | 242 |
| Graduate | 142 | 142 | 0 |
| Georgia Residents | Other States in U.S. | Outside of U.S. | |
|---|---|---|---|
| All Students | 363 | 59 | 1 |
| Undergraduate | 243 | 37 | 1 |
| Graduate | 120 | 22 | 0 |
Transfer-in Students (Undergraduate)
Among 1,373 enrolled in undergraduate programs, 89 students have transferred-in from other institutions. The percentage of transfer-in students is 6.48%.82 students have transferred in as full-time status and 7 students transferred in as part-time status.
| Number of Students | |
|---|---|
| Regular Full-time | 981 |
| Transfer-in Full-time | 82 |
| Regular Part-time | 303 |
| Transfer-in Part-time | 7 |
