Student Population by Gender
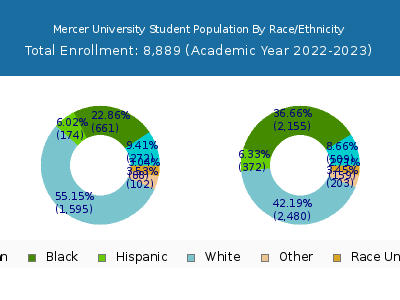
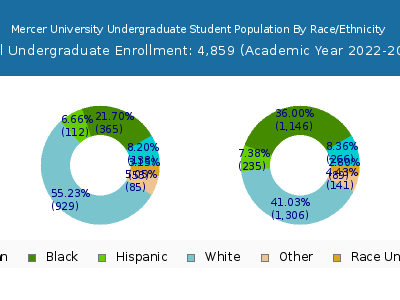
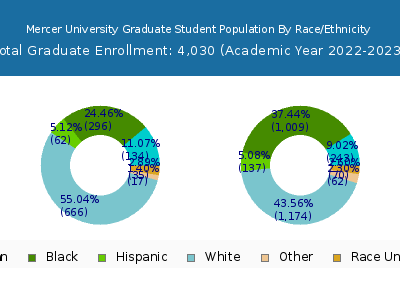
Mercer University has a total of 8,889 enrolled students for the academic year 2022-2023. 4,859 students have enrolled in undergraduate programs and 4,030 students joined graduate programs.
By gender, 2,912 male and 5,977 female students (the male-female ratio is 33:67) are attending the school. The gender distribution is based on the 2022-2023 data.
| Total | Undergraduate | Graduate | |
|---|---|---|---|
| Total | 8,889 | 4,859 | 4,030 |
| Men | 2,912 | 1,680 | 1,232 |
| Women | 5,977 | 3,179 | 2,798 |
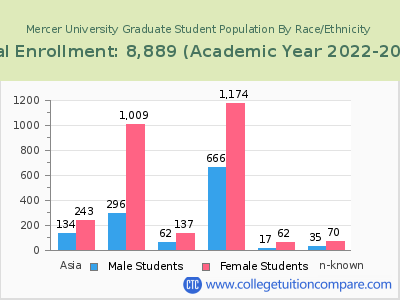
Student Distribution by Race/Ethnicity
| Race | Total | Men | Women |
|---|---|---|---|
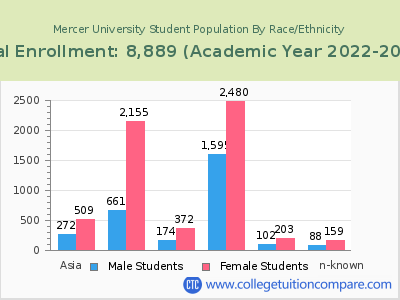
| American Indian or Native American | 13 | 3 | 10 |
| Asian | 745 | 251 | 494 |
| Black | 2,840 | 612 | 2,228 |
| Hispanic | 585 | 208 | 377 |
| Native Hawaiian or Other Pacific Islanders | 9 | 2 | 7 |
| White | 3,922 | 1,552 | 2,370 |
| Two or more races | 288 | 91 | 197 |
| Race Unknown | 219 | 77 | 142 |
| Race | Total | Men | Women |
|---|---|---|---|
| American Indian or Native American | 6 | 0 | 6 |
| Asian | 389 | 135 | 254 |
| Black | 1,536 | 346 | 1,190 |
| Hispanic | 371 | 137 | 234 |
| Native Hawaiian or Other Pacific Islanders | 6 | 1 | 5 |
| White | 2,125 | 903 | 1,222 |
| Two or more races | 201 | 71 | 130 |
| Race Unknown | 122 | 43 | 79 |
| Race | Total | Men | Women |
|---|---|---|---|
| American Indian or Native American | 1 | 0 | 1 |
| Asian | 22 | 4 | 18 |
| Black | 226 | 33 | 193 |
| Hispanic | 41 | 12 | 29 |
| Native Hawaiian or Other Pacific Islanders | 0 | 0 | 0 |
| White | 150 | 45 | 105 |
| Two or more races | 15 | 3 | 12 |
| Race Unknown | 22 | 7 | 15 |
Student Age Distribution
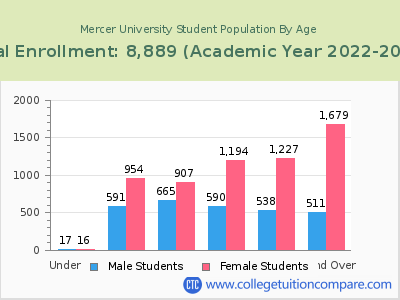
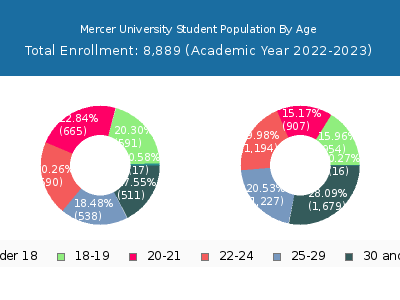
By age, Mercer has 33 students under 18 years old and 17 students over 65 years old. There are 4,934 students under 25 years old, and 3,955 students over 25 years old out of 8,889 total students.
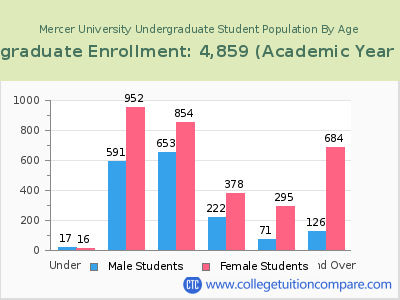
In undergraduate programs, 33 students are younger than 18 and 2 students are older than 65. Mercer has 3,683 undergraduate students aged under 25 and 1,176 students aged 25 and over.
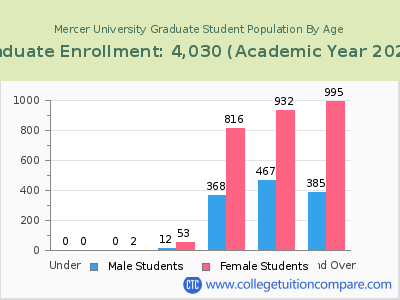
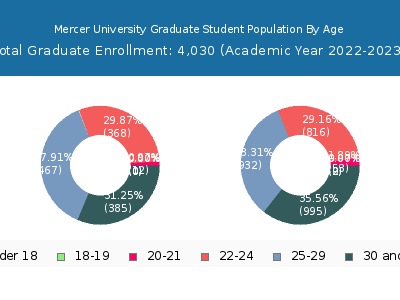
It has 1,251 graduate students aged under 25 and 2,779 students aged 25 and over.
| Age | Total | Men | Women |
|---|---|---|---|
| Under 18 | 33 | 16 | 17 |
| 18-19 | 1,545 | 954 | 591 |
| 20-21 | 1,572 | 907 | 665 |
| 22-24 | 1,784 | 1,194 | 590 |
| 25-29 | 1,765 | 1,227 | 538 |
| 30-34 | 728 | 525 | 203 |
| 35-39 | 483 | 369 | 114 |
| 40-49 | 655 | 531 | 124 |
| 50-64 | 307 | 242 | 65 |
| Over 65 | 17 | 12 | 5 |
| Age | Total | Men | Women |
|---|---|---|---|
| Under 18 | 33 | 16 | 17 |
| 18-19 | 1,543 | 952 | 591 |
| 20-21 | 1,507 | 854 | 653 |
| 22-24 | 600 | 378 | 222 |
| 25-29 | 366 | 295 | 71 |
| 30-34 | 228 | 185 | 43 |
| 35-39 | 180 | 153 | 27 |
| 40-49 | 262 | 232 | 30 |
| 50-64 | 138 | 112 | 26 |
| Over 65 | 2 | 2 | 0 |
| Age | Total | Men | Women |
|---|
Online Student Enrollment
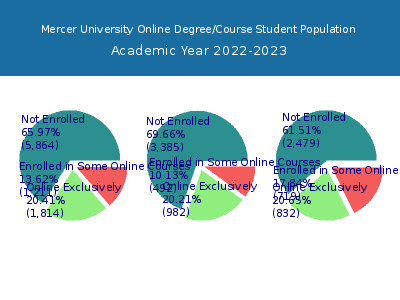
Distance learning, also called online education, is very attractive to students, especially who want to continue education and work in field. At Mercer University, 1,814 students are enrolled exclusively in online courses and 1,211 students are enrolled in some online courses.
1,622 students lived in Georgia or jurisdiction in which the school is located are enrolled exclusively in online courses and 192 students live in other State or outside of the United States.
| All Students | Enrolled Exclusively Online Courses | Enrolled in Some Online Courses | |
|---|---|---|---|
| All Students | 8,889 | 1,814 | 1,211 |
| Undergraduate | 4,859 | 982 | 492 |
| Graduate | 4,030 | 832 | 719 |
| Georgia Residents | Other States in U.S. | Outside of U.S. | |
|---|---|---|---|
| All Students | 1,622 | 184 | 8 |
| Undergraduate | 897 | 82 | 3 |
| Graduate | 725 | 102 | 5 |
Transfer-in Students (Undergraduate)
Among 4,859 enrolled in undergraduate programs, 485 students have transferred-in from other institutions. The percentage of transfer-in students is 9.98%.345 students have transferred in as full-time status and 140 students transferred in as part-time status.
| Number of Students | |
|---|---|
| Regular Full-time | 3,784 |
| Transfer-in Full-time | 345 |
| Regular Part-time | 590 |
| Transfer-in Part-time | 140 |
