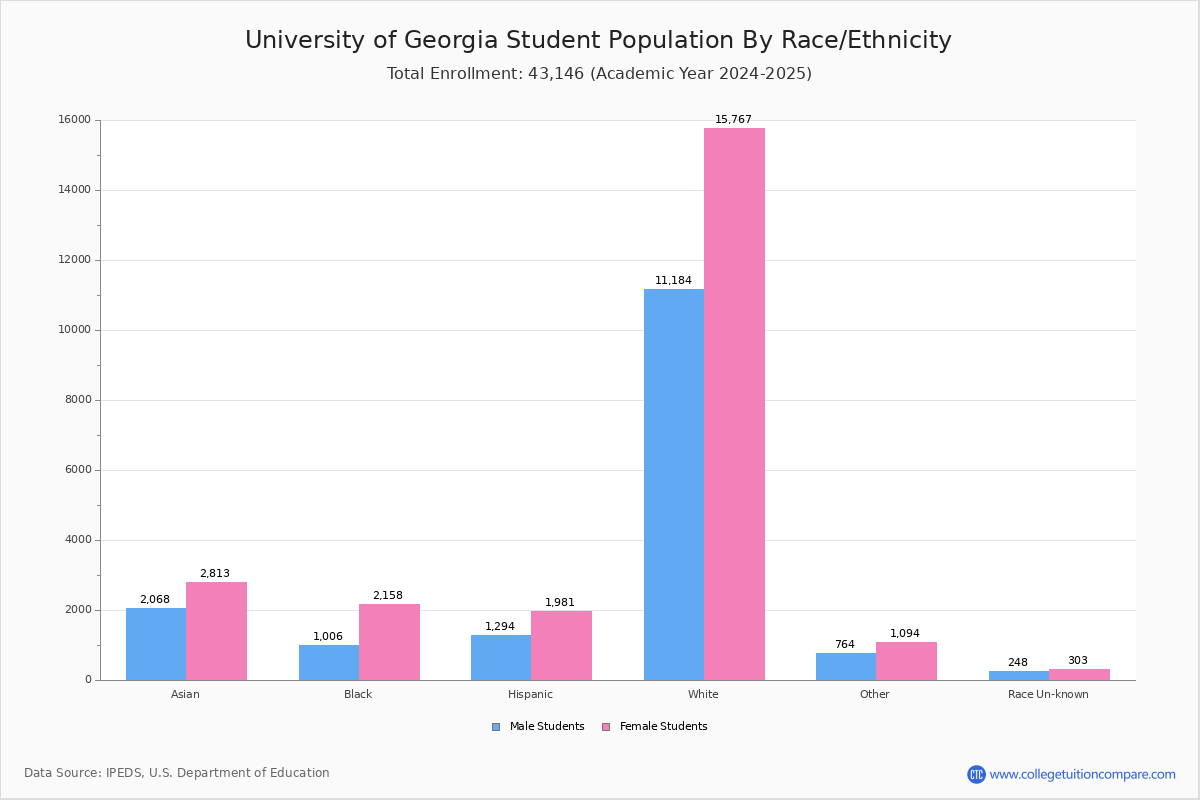
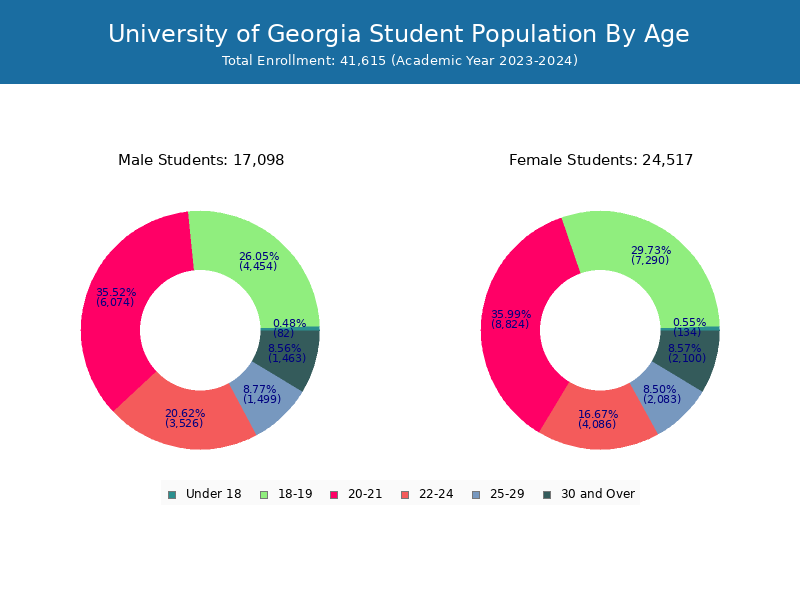
Student Population by Gender
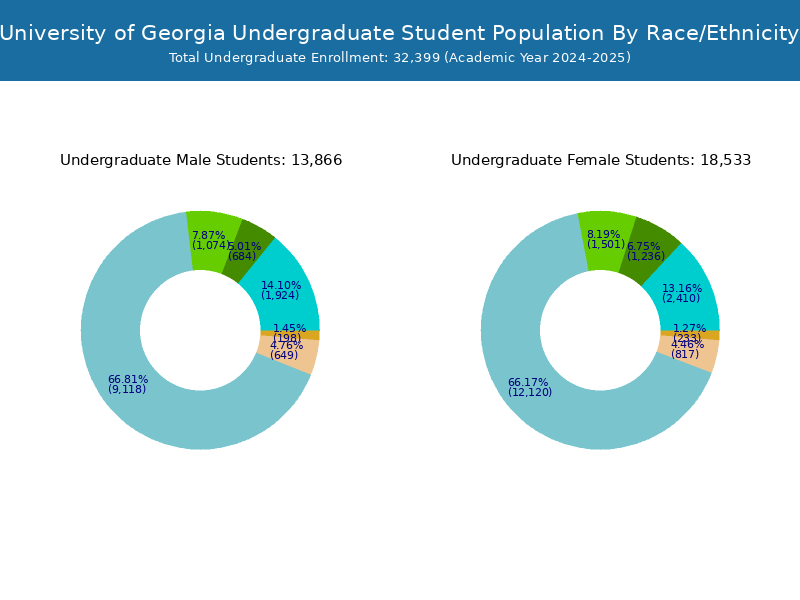
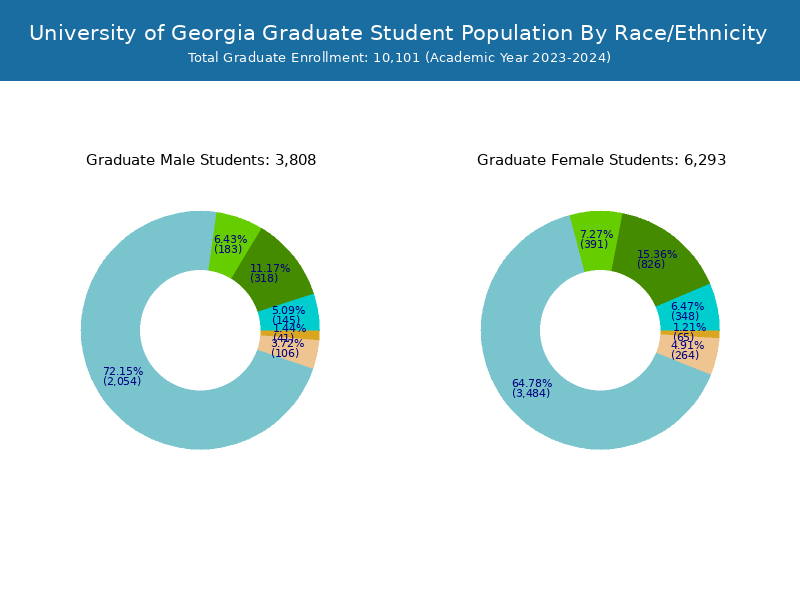
University of Georgia has a total of 40,607 enrolled students for the academic year 2022-2023. 30,714 students have enrolled in undergraduate programs and 9,893 students joined graduate programs.
By gender, 16,641 male and 23,966 female students (the male-female ratio is 41:59) are attending the school. The gender distribution is based on the 2022-2023 data.
| Total | Undergraduate | Graduate | |
|---|---|---|---|
| Total | 40,607 | 30,714 | 9,893 |
| Men | 16,641 | 12,883 | 3,758 |
| Women | 23,966 | 17,831 | 6,135 |
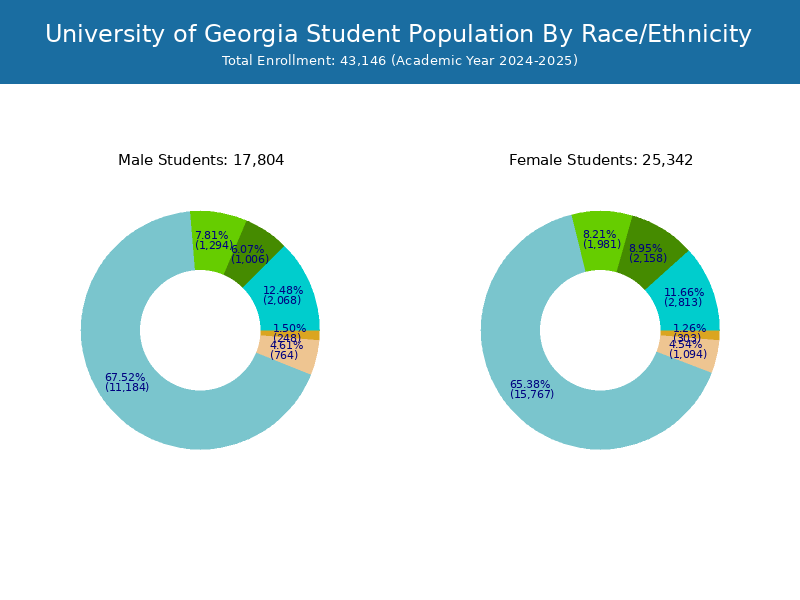
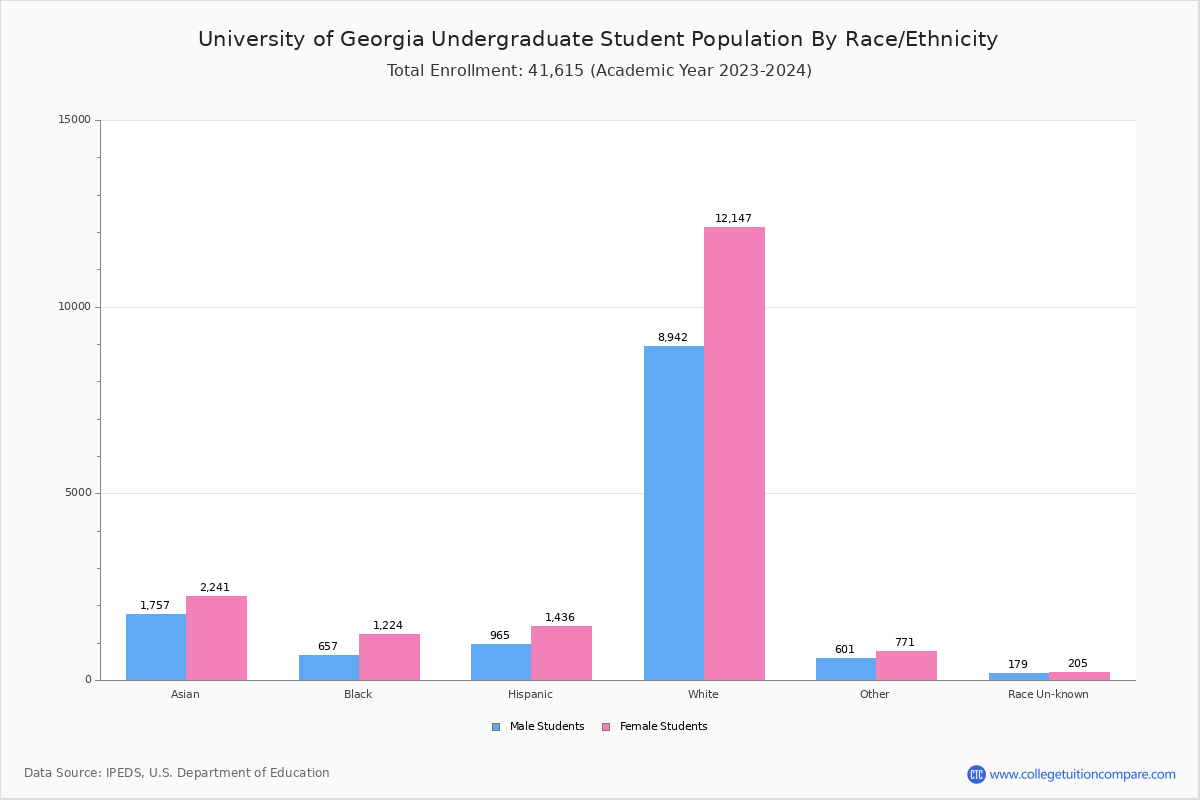
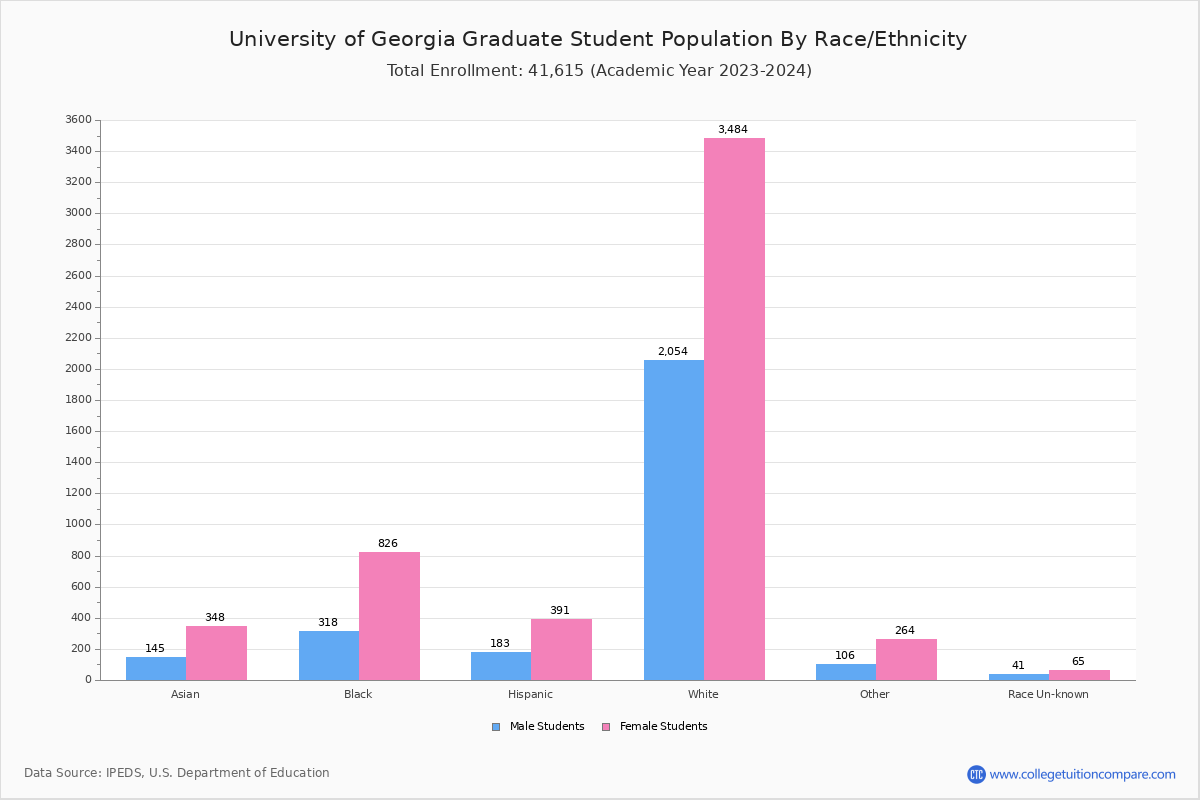
Student Distribution by Race/Ethnicity
By race/ethnicity, 26,416 White, 3,072 Black, and 4,206 Asian students out of a total of 40,607 are attending at University of Georgia. Comprehensive enrollment statistic data by race/ethnicity is shown in the next chart (Academic year 2022-2023 data).
| Race | Total | Men | Women |
|---|---|---|---|
| American Indian or Native American | 39 | 18 | 21 |
| Asian | 4,206 | 1,842 | 2,364 |
| Black | 3,072 | 986 | 2,086 |
| Hispanic | 2,704 | 1,062 | 1,642 |
| Native Hawaiian or Other Pacific Islanders | 18 | 11 | 7 |
| White | 26,416 | 10,854 | 15,562 |
| Two or more races | 1,621 | 619 | 1,002 |
| Race Unknown | 478 | 220 | 258 |
| Race | Total | Men | Women |
|---|---|---|---|
| American Indian or Native American | 19 | 10 | 9 |
| Asian | 3,711 | 1,678 | 2,033 |
| Black | 1,910 | 674 | 1,236 |
| Hispanic | 2,244 | 914 | 1,330 |
| Native Hawaiian or Other Pacific Islanders | 17 | 10 | 7 |
| White | 20,793 | 8,732 | 12,061 |
| Two or more races | 1,286 | 521 | 765 |
| Race Unknown | 367 | 175 | 192 |
| Race | Total | Men | Women |
|---|---|---|---|
| American Indian or Native American | 1 | 1 | 0 |
| Asian | 177 | 92 | 85 |
| Black | 112 | 56 | 56 |
| Hispanic | 176 | 95 | 81 |
| Native Hawaiian or Other Pacific Islanders | 0 | 0 | 0 |
| White | 1,214 | 636 | 578 |
| Two or more races | 87 | 44 | 43 |
| Race Unknown | 13 | 6 | 7 |
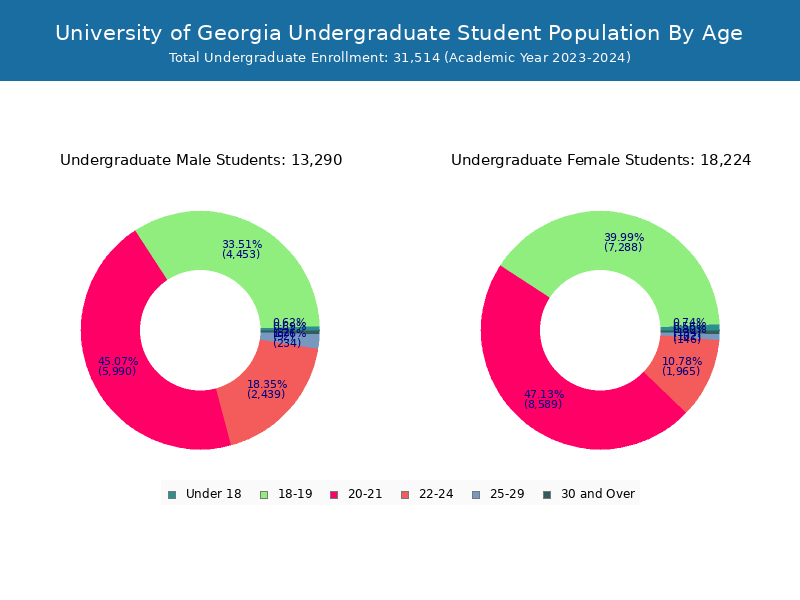
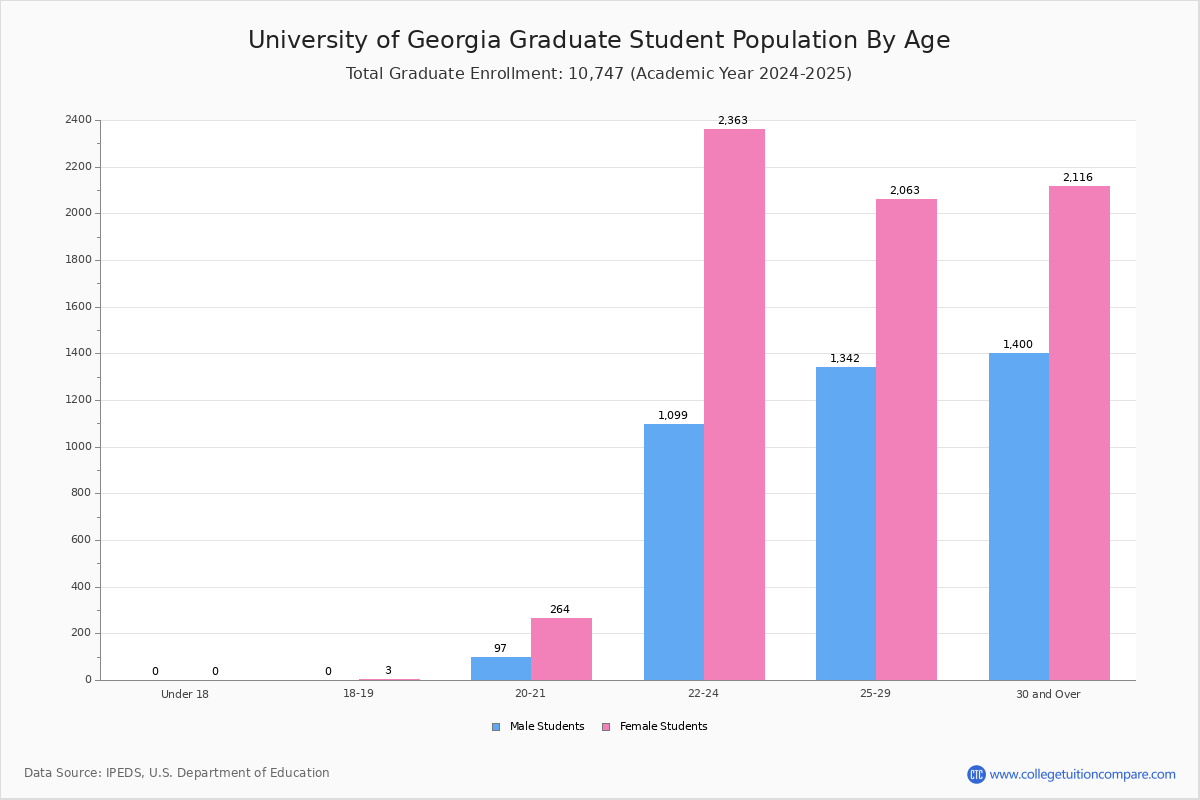
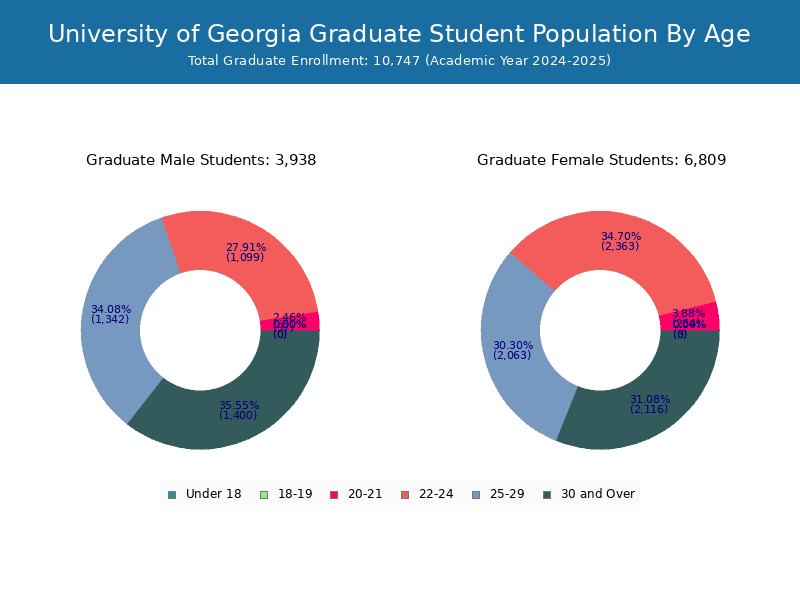
Student Age Distribution
By age, UGA has 160 students under 18 years old and 82 students over 65 years old. There are 33,606 students under 25 years old, and 7,001 students over 25 years old out of 40,607 total students.
In undergraduate programs, 160 students are younger than 18 and 35 students are older than 65. UGA has 30,157 undergraduate students aged under 25 and 557 students aged 25 and over.
It has 3,449 graduate students aged under 25 and 6,444 students aged 25 and over.
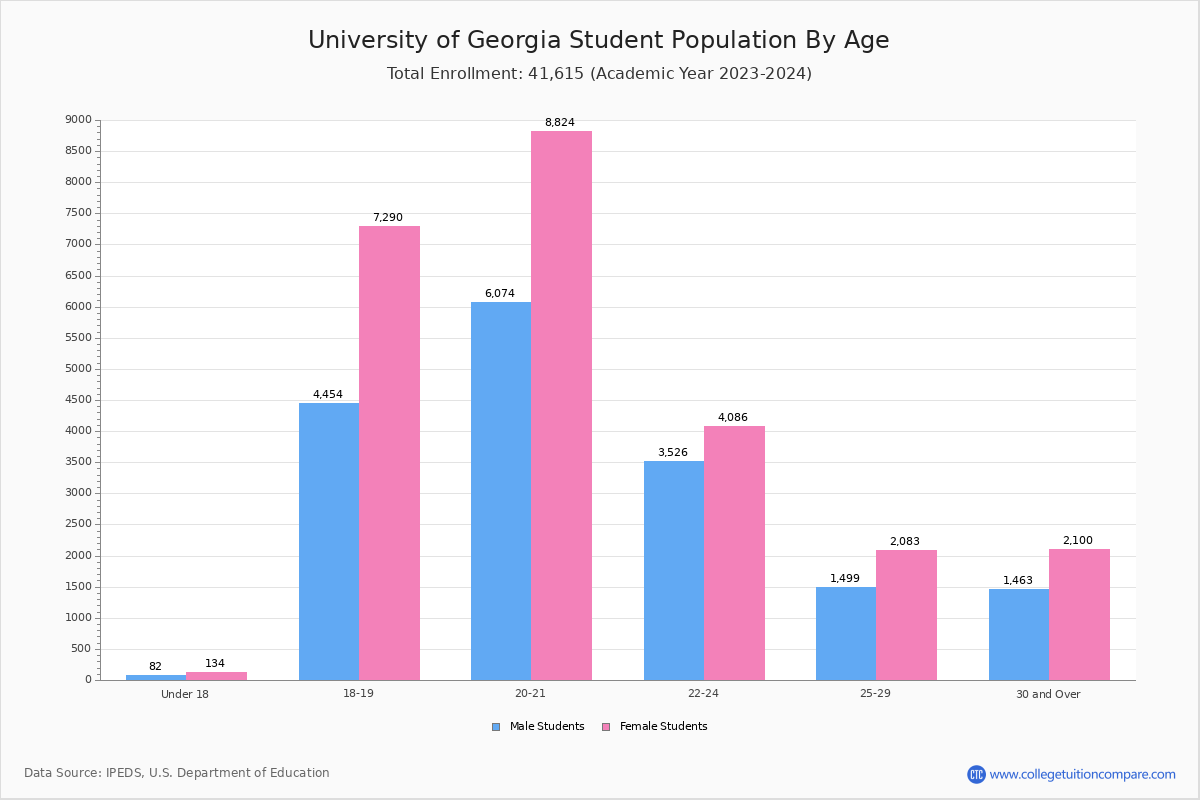
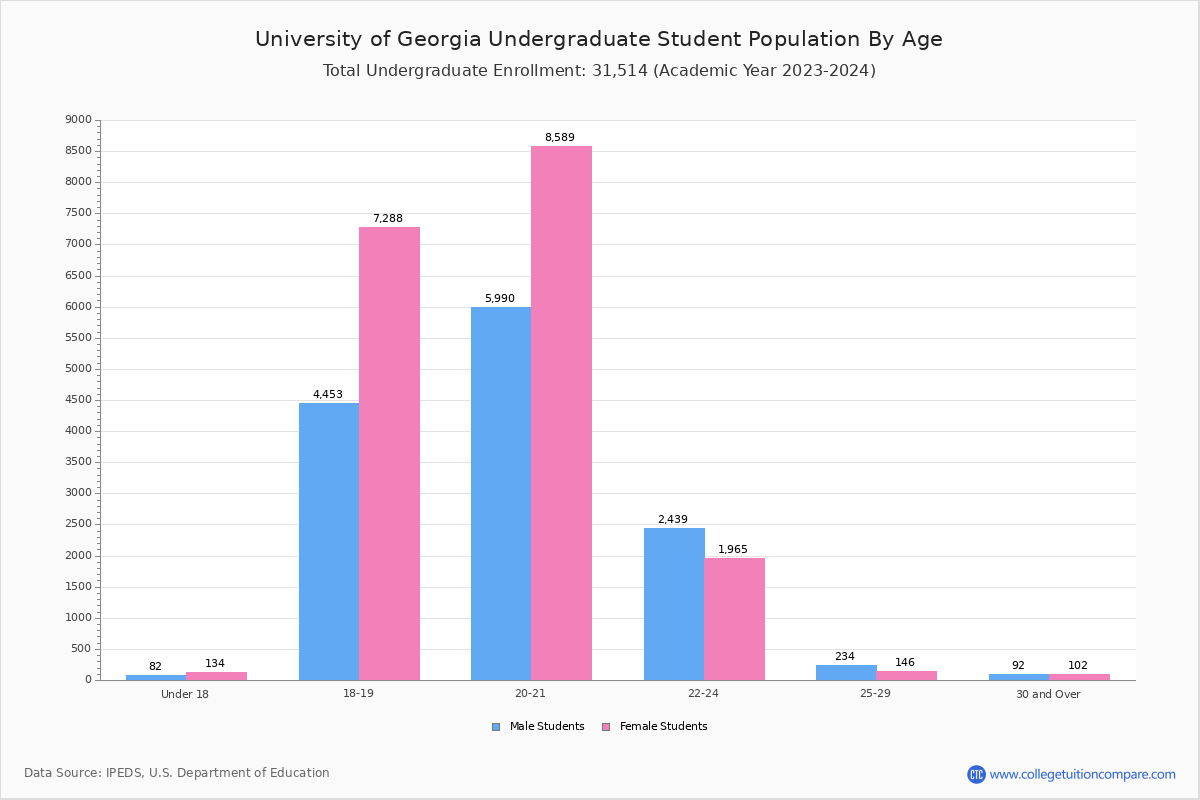
| Age | Total | Men | Women |
|---|---|---|---|
| Under 18 | 160 | 106 | 54 |
| 18-19 | 11,450 | 7,235 | 4,215 |
| 20-21 | 14,427 | 8,509 | 5,918 |
| 22-24 | 7,569 | 4,044 | 3,525 |
| 25-29 | 3,522 | 1,997 | 1,525 |
| 30-34 | 1,546 | 872 | 674 |
| 35-39 | 763 | 453 | 310 |
| 40-49 | 759 | 490 | 269 |
| 50-64 | 329 | 212 | 117 |
| Over 65 | 82 | 48 | 34 |
| Age | Total | Men | Women |
|---|---|---|---|
| Under 18 | 160 | 106 | 54 |
| 18-19 | 11,446 | 7,231 | 4,215 |
| 20-21 | 14,146 | 8,311 | 5,835 |
| 22-24 | 4,405 | 1,963 | 2,442 |
| 25-29 | 375 | 128 | 247 |
| 30-34 | 63 | 30 | 33 |
| 35-39 | 38 | 17 | 21 |
| 40-49 | 27 | 14 | 13 |
| 50-64 | 19 | 10 | 9 |
| Over 65 | 35 | 21 | 14 |
| Age | Total | Men | Women |
|---|
Online Student Enrollment
Distance learning, also called online education, is very attractive to students, especially who want to continue education and work in field. At University of Georgia, 1,166 students are enrolled exclusively in online courses and 6,766 students are enrolled in some online courses.
903 students lived in Georgia or jurisdiction in which the school is located are enrolled exclusively in online courses and 263 students live in other State or outside of the United States.
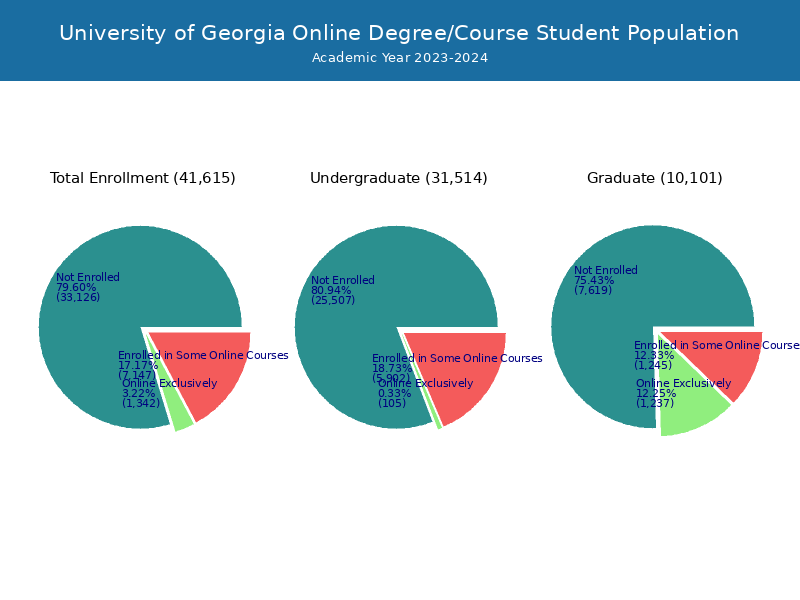
| All Students | Enrolled Exclusively Online Courses | Enrolled in Some Online Courses | |
|---|---|---|---|
| All Students | 40,607 | 1,166 | 6,766 |
| Undergraduate | 30,714 | 106 | 5,614 |
| Graduate | 9,893 | 1,060 | 1,152 |
| Georgia Residents | Other States in U.S. | Outside of U.S. | |
|---|---|---|---|
| All Students | 903 | 242 | 21 |
| Undergraduate | 98 | 4 | 4 |
| Graduate | 805 | 238 | 17 |
Transfer-in Students (Undergraduate)
Among 30,714 enrolled in undergraduate programs, 1,807 students have transferred-in from other institutions. The percentage of transfer-in students is 5.88%.1,677 students have transferred in as full-time status and 130 students transferred in as part-time status.
| Number of Students | |
|---|---|
| Regular Full-time | 27,146 |
| Transfer-in Full-time | 1,677 |
| Regular Part-time | 1,761 |
| Transfer-in Part-time | 130 |