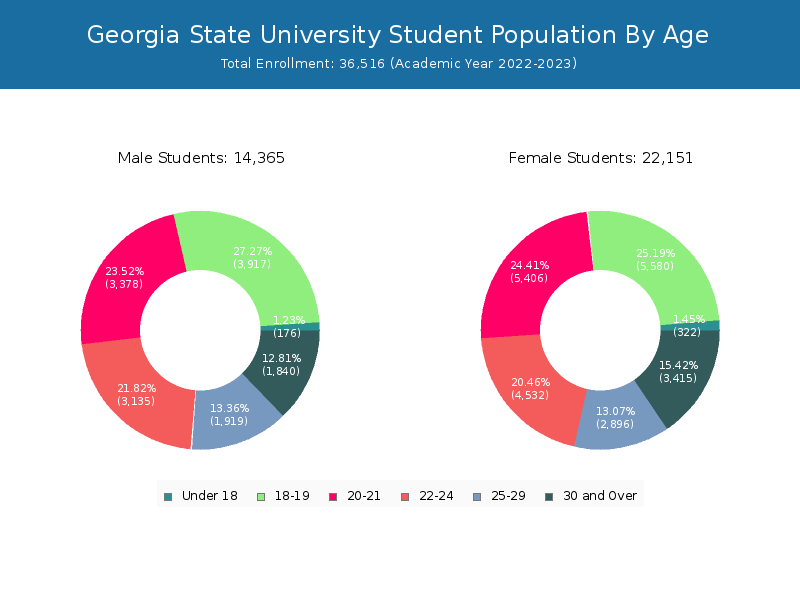
Student Population by Gender
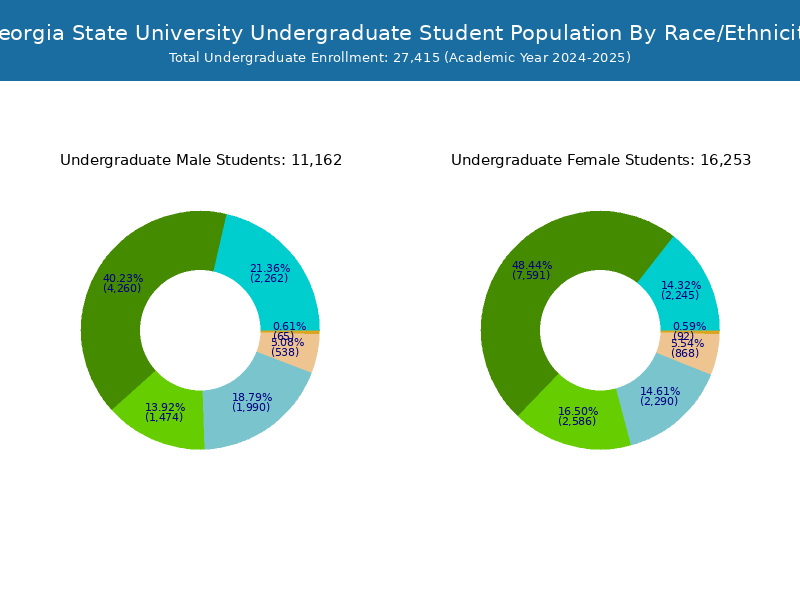
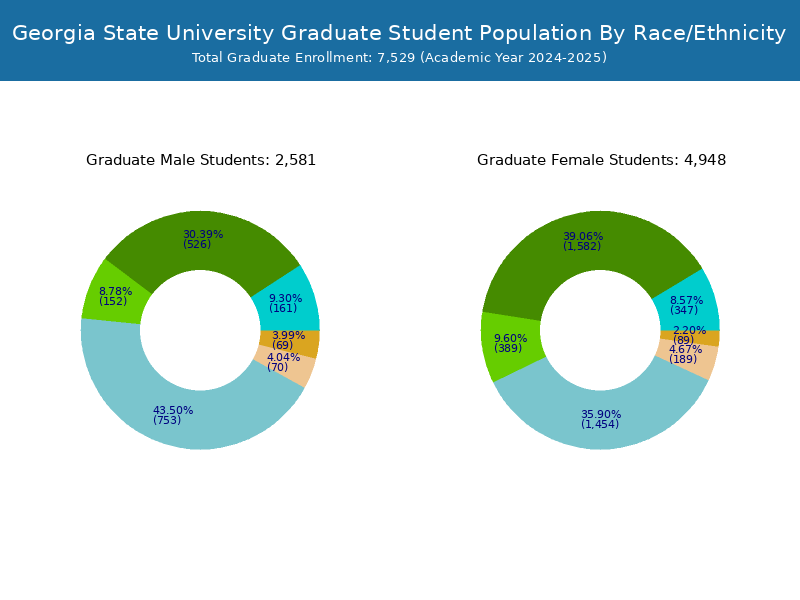
Georgia State University has a total of 36,516 enrolled students for the academic year 2022-2023. 28,924 students have enrolled in undergraduate programs and 7,592 students joined graduate programs.
By gender, 14,365 male and 22,151 female students (the male-female ratio is 39:61) are attending the school. The gender distribution is based on the 2022-2023 data.
| Total | Undergraduate | Graduate | |
|---|---|---|---|
| Total | 36,516 | 28,924 | 7,592 |
| Men | 14,365 | 11,671 | 2,694 |
| Women | 22,151 | 17,253 | 4,898 |
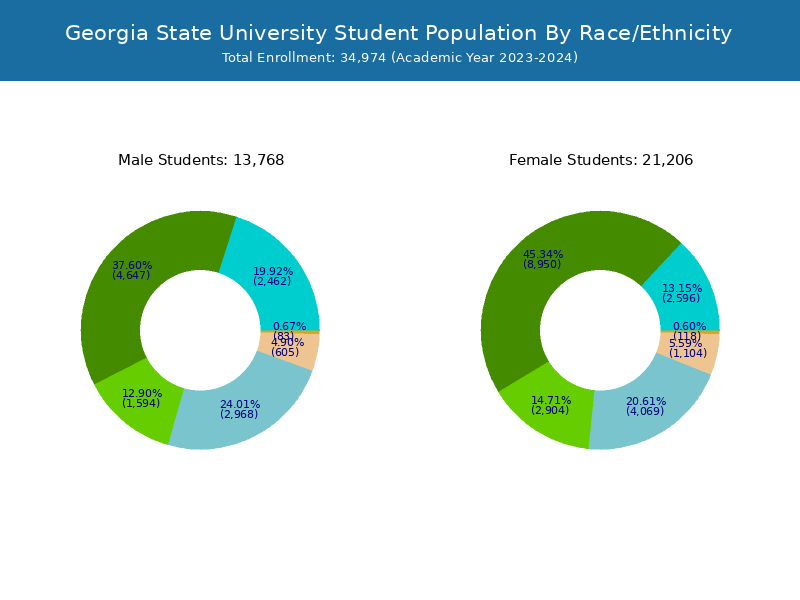
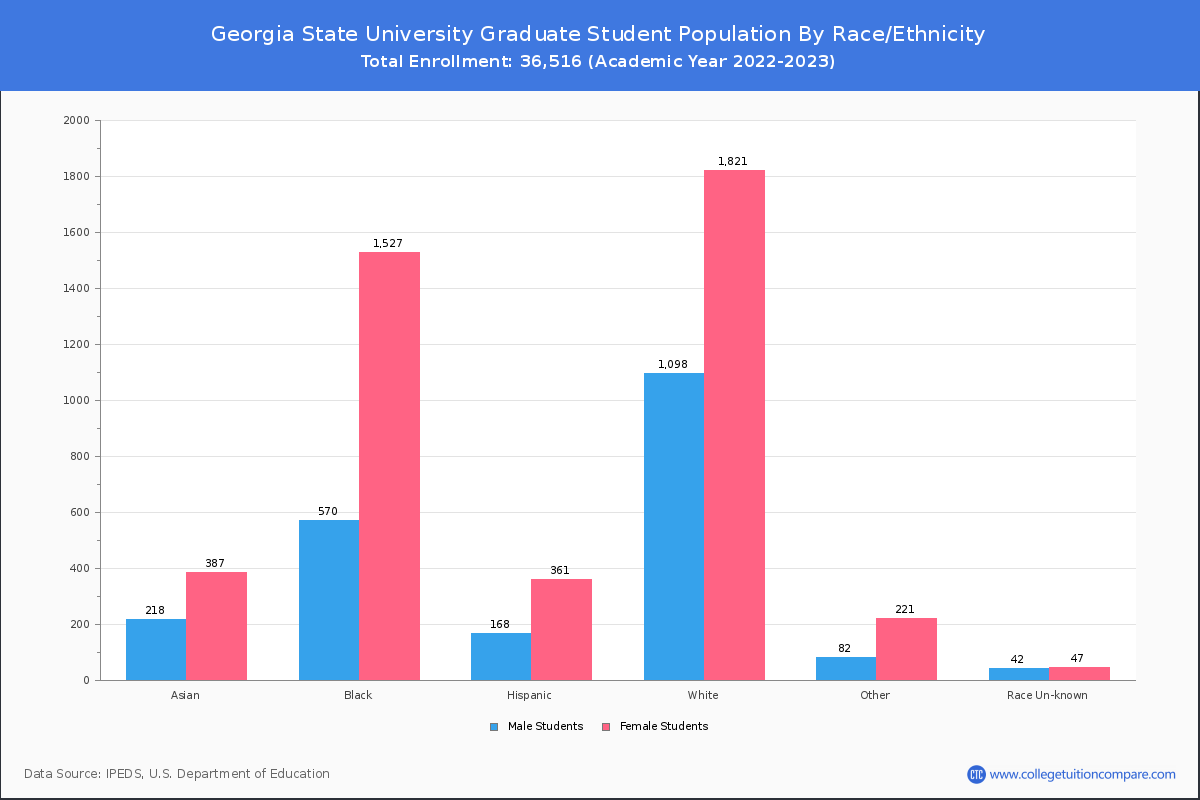
Student Distribution by Race/Ethnicity
By race/ethnicity, 7,830 White, 14,256 Black, and 5,062 Asian students out of a total of 36,516 are attending at Georgia State University. Comprehensive enrollment statistic data by race/ethnicity is shown in the next chart (Academic year 2022-2023 data).


| Race | Total | Men | Women |
|---|---|---|---|
| American Indian or Native American | 34 | 12 | 22 |
| Asian | 5,062 | 2,491 | 2,571 |
| Black | 14,256 | 4,796 | 9,460 |
| Hispanic | 4,572 | 1,640 | 2,932 |
| Native Hawaiian or Other Pacific Islanders | 21 | 9 | 12 |
| White | 7,830 | 3,403 | 4,427 |
| Two or more races | 1,821 | 609 | 1,212 |
| Race Unknown | 221 | 101 | 120 |
| Race | Total | Men | Women |
|---|---|---|---|
| American Indian or Native American | 24 | 8 | 16 |
| Asian | 4,561 | 2,317 | 2,244 |
| Black | 12,271 | 4,296 | 7,975 |
| Hispanic | 4,058 | 1,483 | 2,575 |
| Native Hawaiian or Other Pacific Islanders | 15 | 9 | 6 |
| White | 5,279 | 2,484 | 2,795 |
| Two or more races | 1,556 | 537 | 1,019 |
| Race Unknown | 156 | 68 | 88 |
| Race | Total | Men | Women |
|---|---|---|---|
| American Indian or Native American | 4 | 2 | 2 |
| Asian | 124 | 70 | 54 |
| Black | 624 | 207 | 417 |
| Hispanic | 181 | 65 | 116 |
| Native Hawaiian or Other Pacific Islanders | 2 | 1 | 1 |
| White | 299 | 129 | 170 |
| Two or more races | 87 | 30 | 57 |
| Race Unknown | 2 | 2 | 0 |
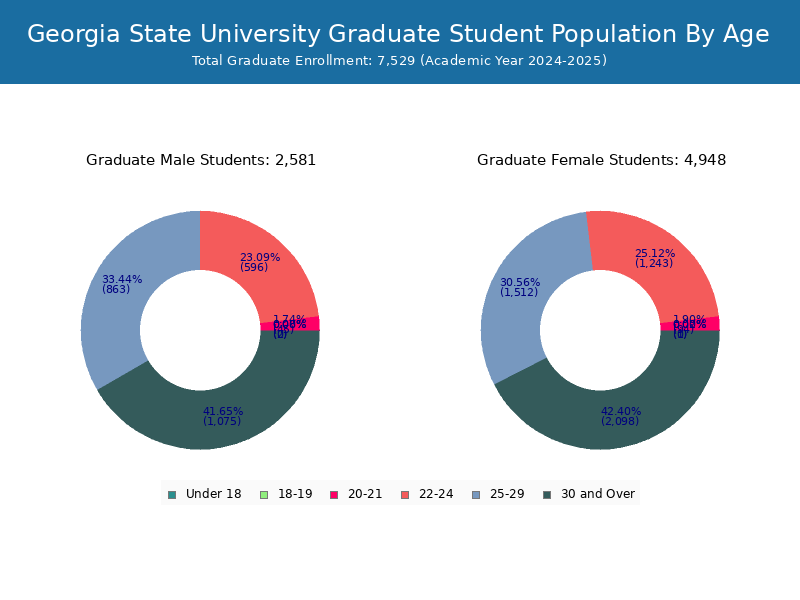
Student Age Distribution
By age, Georgia State has 498 students under 18 years old and 182 students over 65 years old. There are 26,446 students under 25 years old, and 10,070 students over 25 years old out of 36,516 total students.
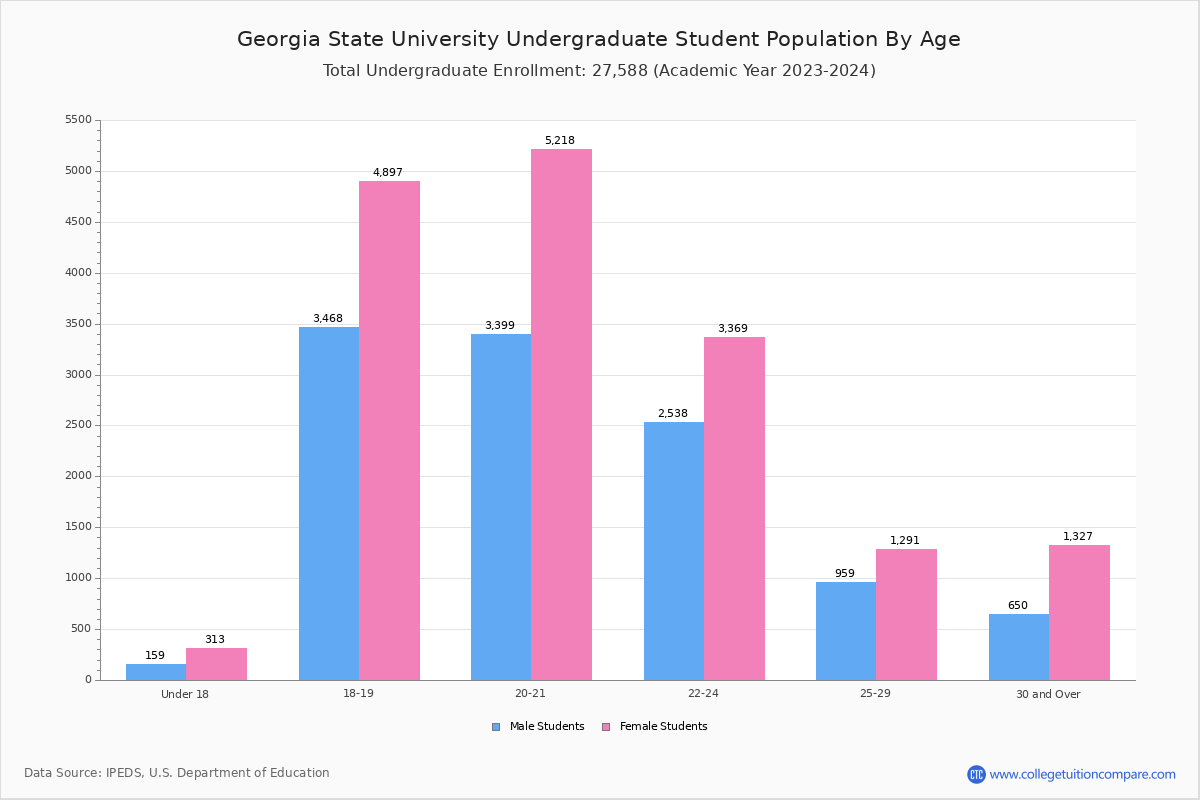
In undergraduate programs, 498 students are younger than 18 and 113 students are older than 65. Georgia State has 24,556 undergraduate students aged under 25 and 4,368 students aged 25 and over.
It has 1,890 graduate students aged under 25 and 5,702 students aged 25 and over.
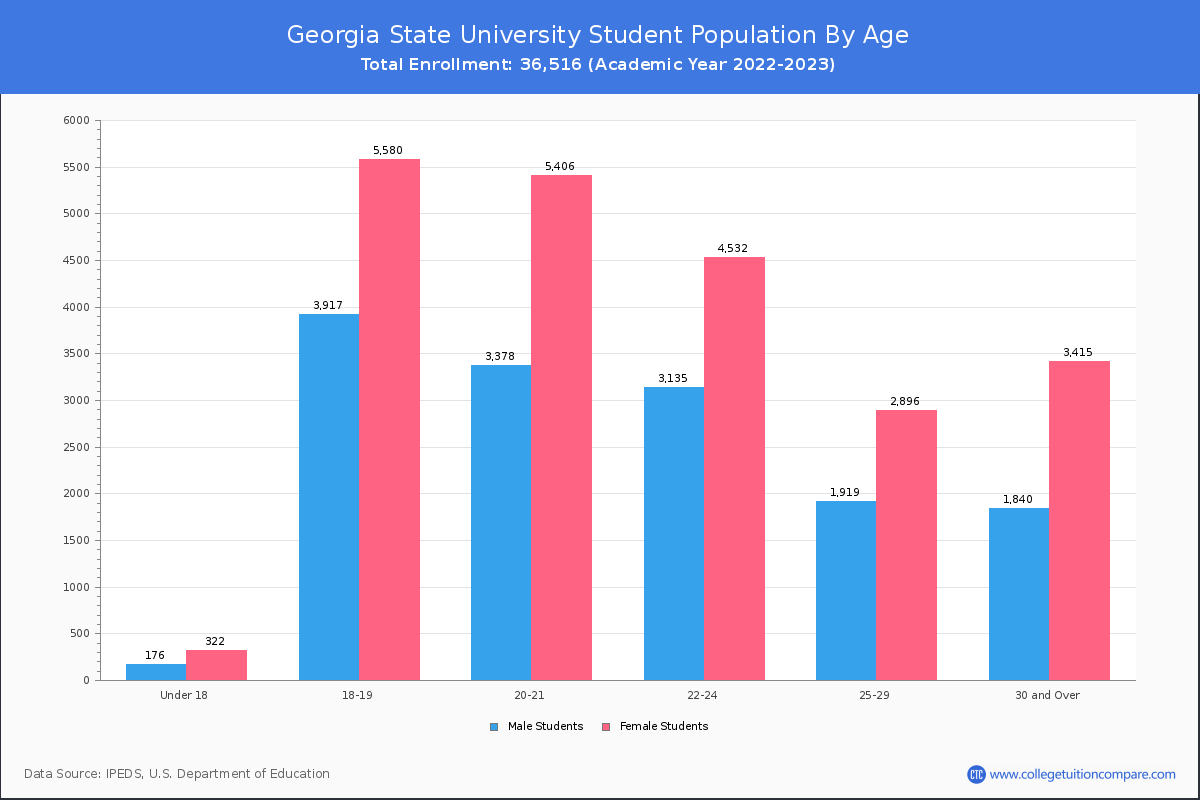
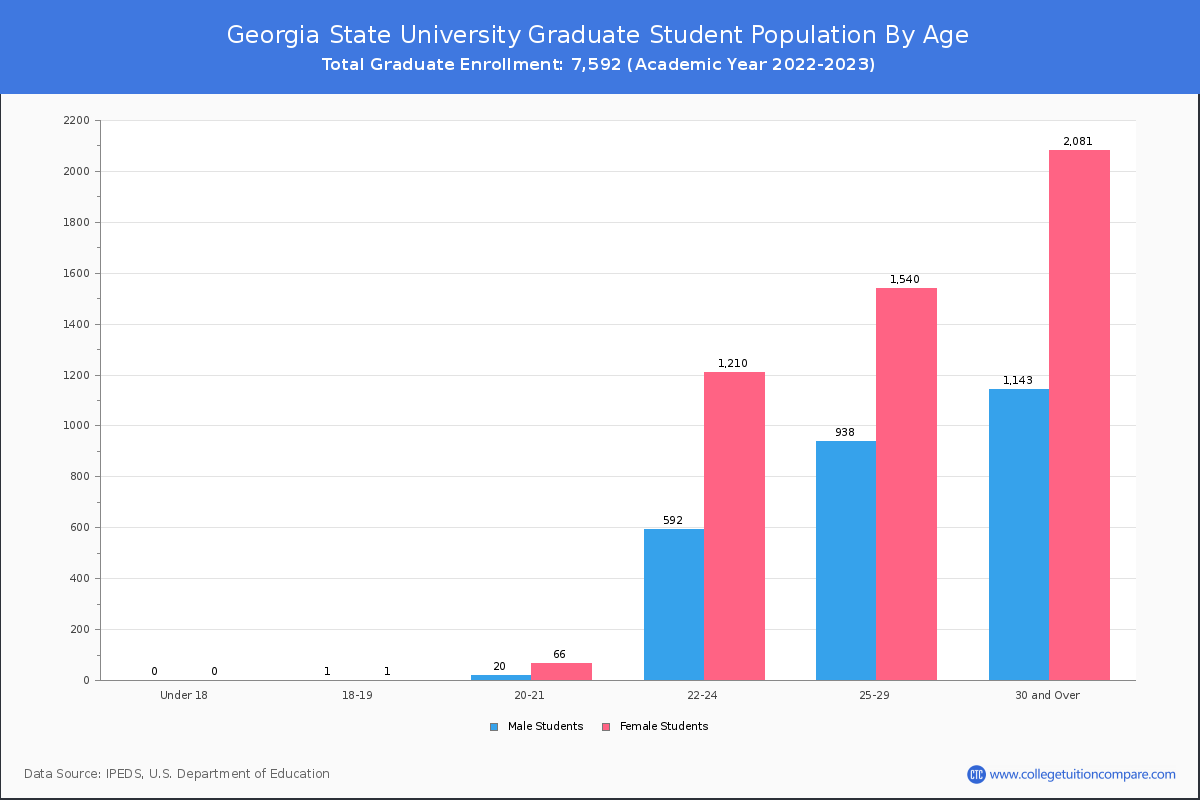
| Age | Total | Men | Women |
|---|---|---|---|
| Under 18 | 498 | 322 | 176 |
| 18-19 | 9,497 | 5,580 | 3,917 |
| 20-21 | 8,784 | 5,406 | 3,378 |
| 22-24 | 7,667 | 4,532 | 3,135 |
| 25-29 | 4,815 | 2,896 | 1,919 |
| 30-34 | 2,143 | 1,299 | 844 |
| 35-39 | 1,110 | 723 | 387 |
| 40-49 | 1,194 | 829 | 365 |
| 50-64 | 626 | 458 | 168 |
| Over 65 | 182 | 106 | 76 |
| Age | Total | Men | Women |
|---|---|---|---|
| Under 18 | 498 | 322 | 176 |
| 18-19 | 9,495 | 5,579 | 3,916 |
| 20-21 | 8,698 | 5,340 | 3,358 |
| 22-24 | 5,865 | 3,322 | 2,543 |
| 25-29 | 2,337 | 1,356 | 981 |
| 30-34 | 865 | 528 | 337 |
| 35-39 | 429 | 285 | 144 |
| 40-49 | 409 | 290 | 119 |
| 50-64 | 215 | 164 | 51 |
| Over 65 | 113 | 67 | 46 |
| Age | Total | Men | Women |
|---|
Online Student Enrollment
Distance learning, also called online education, is very attractive to students, especially who want to continue education and work in field. At Georgia State University, 4,715 students are enrolled exclusively in online courses and 19,798 students are enrolled in some online courses.
4,388 students lived in Georgia or jurisdiction in which the school is located are enrolled exclusively in online courses and 327 students live in other State or outside of the United States.
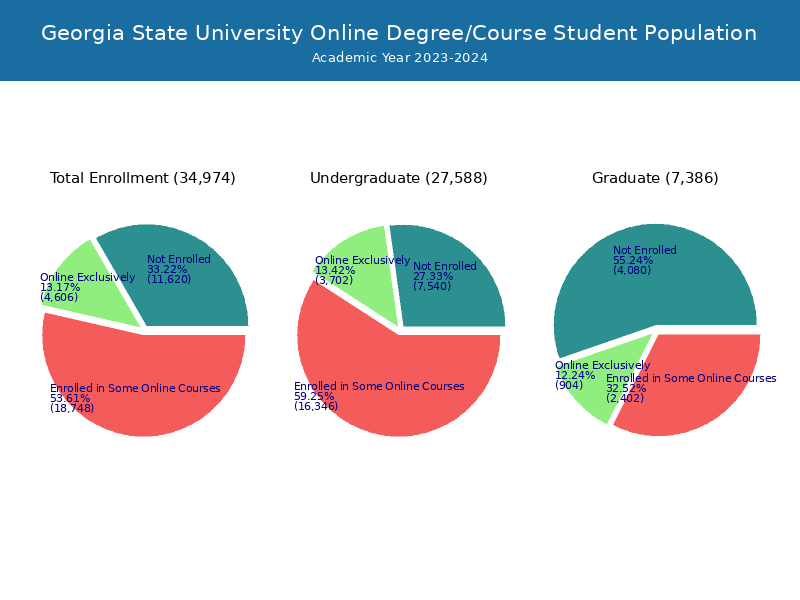
| All Students | Enrolled Exclusively Online Courses | Enrolled in Some Online Courses | |
|---|---|---|---|
| All Students | 36,516 | 4,715 | 19,798 |
| Undergraduate | 28,924 | 3,727 | 17,428 |
| Graduate | 7,592 | 988 | 2,370 |
| Georgia Residents | Other States in U.S. | Outside of U.S. | |
|---|---|---|---|
| All Students | 4,388 | 251 | 76 |
| Undergraduate | 3,466 | 195 | 66 |
| Graduate | 922 | 56 | 10 |
Transfer-in Students (Undergraduate)
Among 28,924 enrolled in undergraduate programs, 1,408 students have transferred-in from other institutions. The percentage of transfer-in students is 4.87%.993 students have transferred in as full-time status and 415 students transferred in as part-time status.
| Number of Students | |
|---|---|
| Regular Full-time | 20,611 |
| Transfer-in Full-time | 993 |
| Regular Part-time | 6,905 |
| Transfer-in Part-time | 415 |