Student Population by Gender
Georgetown University has a total of 20,984 enrolled students for the academic year 2022-2023. 7,900 students have enrolled in undergraduate programs and 13,084 students joined graduate programs.
By gender, 9,469 male and 11,515 female students (the male-female ratio is 45:55) are attending the school. The gender distribution is based on the 2022-2023 data.
| Total | Undergraduate | Graduate | |
|---|---|---|---|
| Total | 20,984 | 7,900 | 13,084 |
| Men | 9,469 | 3,519 | 5,950 |
| Women | 11,515 | 4,381 | 7,134 |
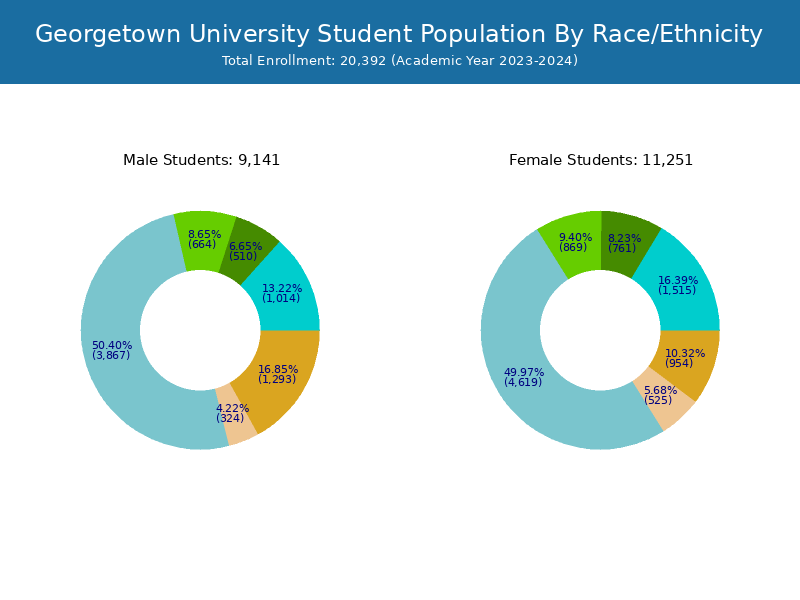
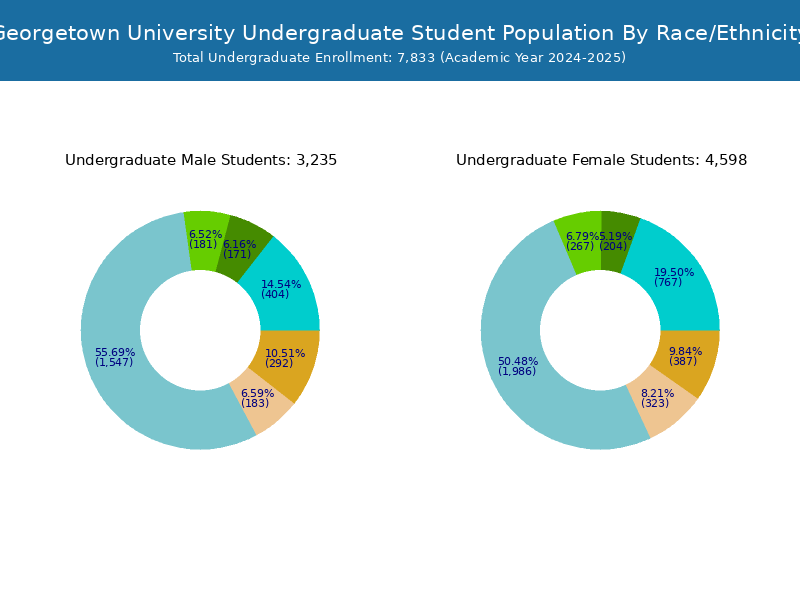
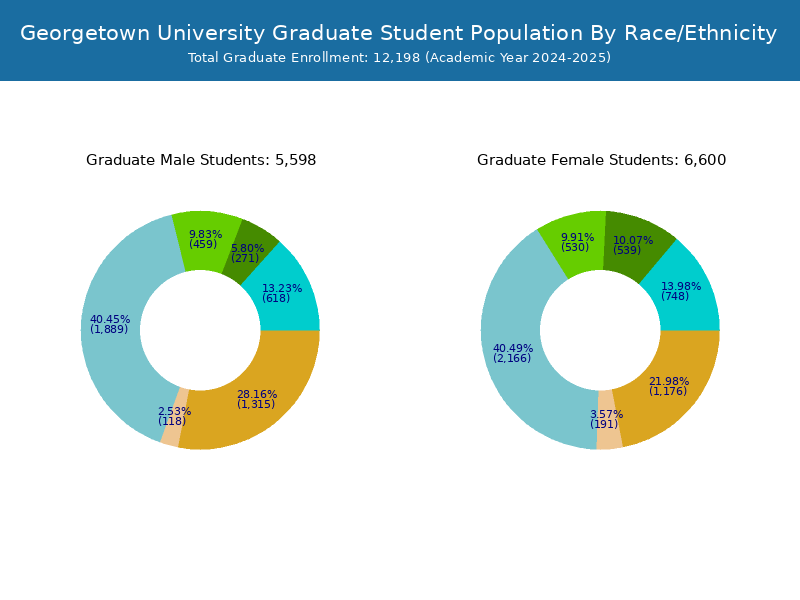
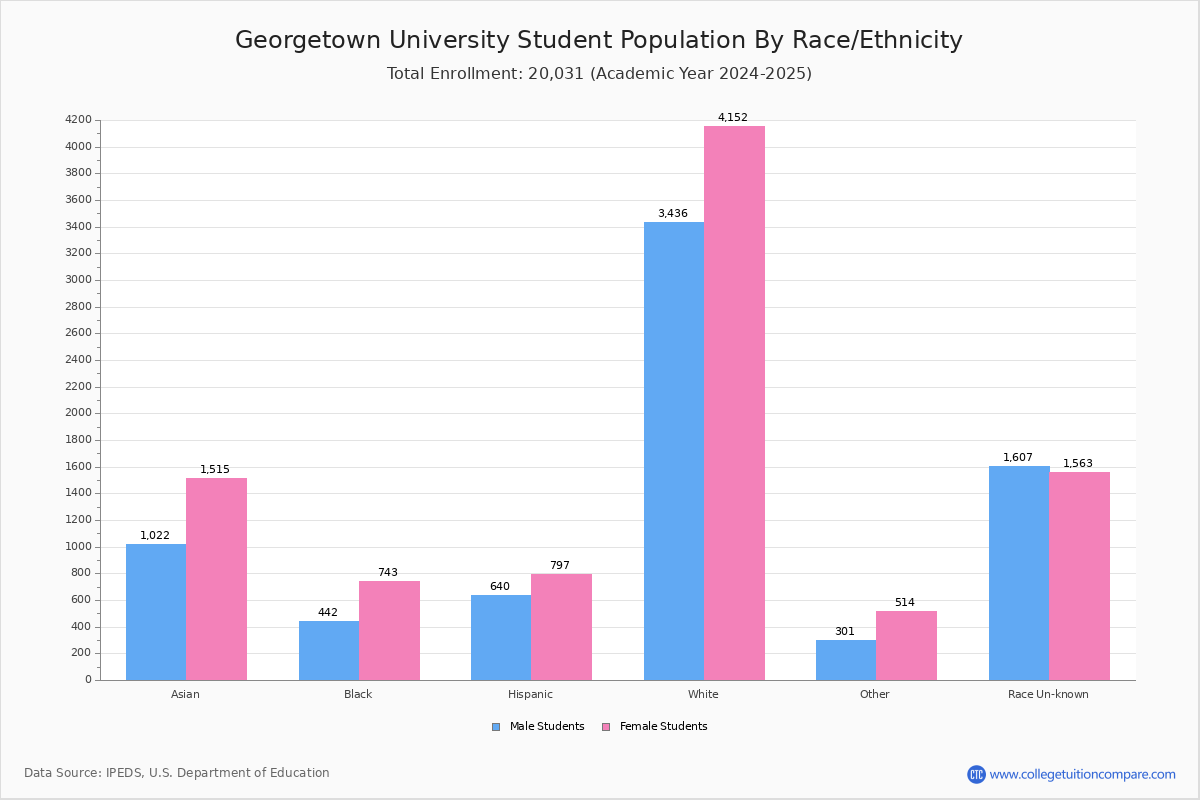
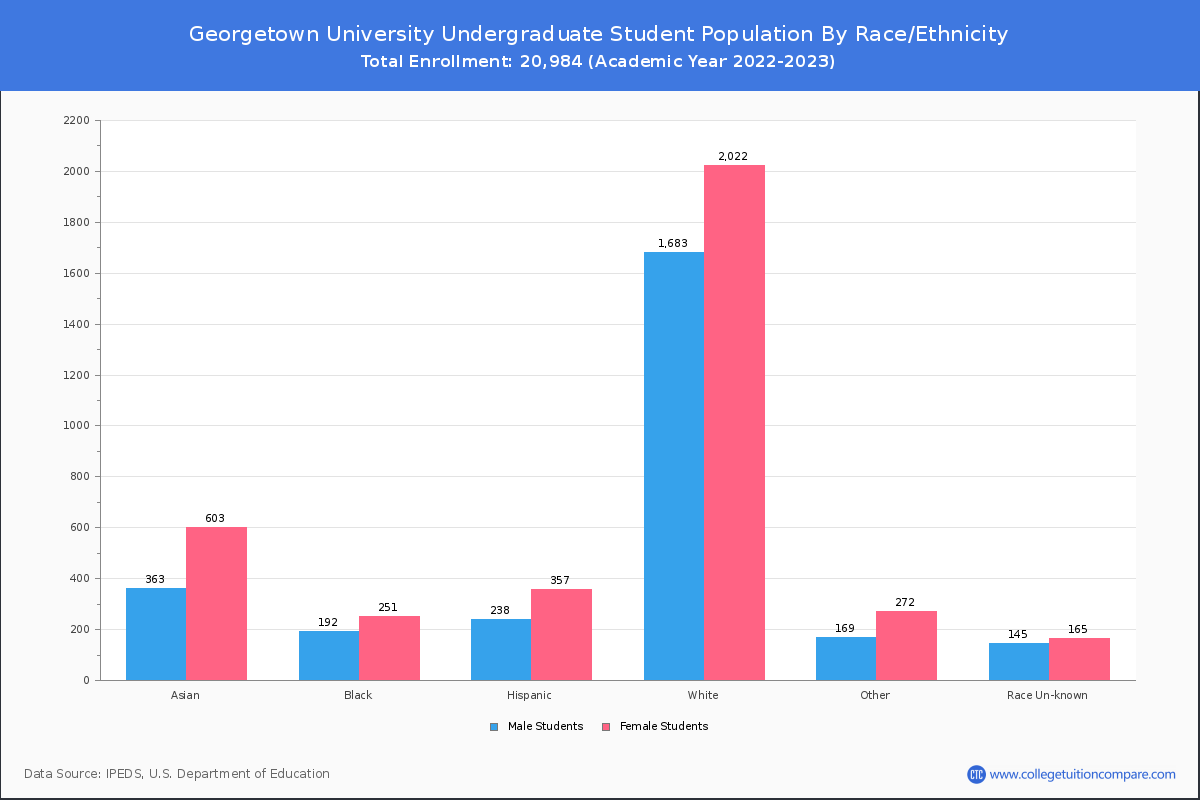
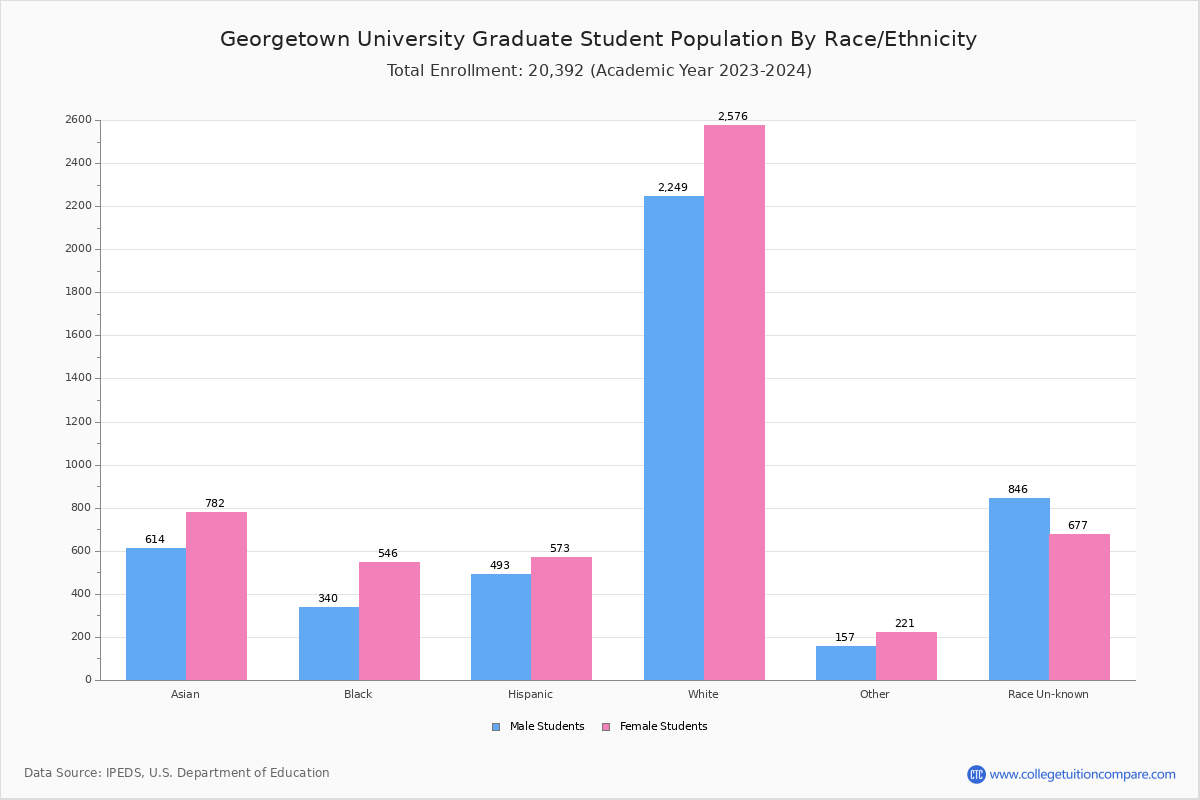
Student Distribution by Race/Ethnicity
By race/ethnicity, 9,268 White, 1,385 Black, and 2,402 Asian students out of a total of 20,984 are attending at Georgetown University. Comprehensive enrollment statistic data by race/ethnicity is shown in the next chart (Academic year 2022-2023 data).
| Race | Total | Men | Women |
|---|---|---|---|
| American Indian or Native American | 22 | 8 | 14 |
| Asian | 2,402 | 962 | 1,440 |
| Black | 1,385 | 553 | 832 |
| Hispanic | 1,730 | 741 | 989 |
| Native Hawaiian or Other Pacific Islanders | 26 | 15 | 11 |
| White | 9,268 | 4,259 | 5,009 |
| Two or more races | 839 | 319 | 520 |
| Race Unknown | 1,820 | 1,149 | 671 |
| Race | Total | Men | Women |
|---|---|---|---|
| American Indian or Native American | 6 | 2 | 4 |
| Asian | 1,043 | 392 | 651 |
| Black | 380 | 162 | 218 |
| Hispanic | 528 | 195 | 333 |
| Native Hawaiian or Other Pacific Islanders | 10 | 5 | 5 |
| White | 3,720 | 1,664 | 2,056 |
| Two or more races | 434 | 159 | 275 |
| Race Unknown | 666 | 505 | 161 |
| Race | Total | Men | Women |
|---|---|---|---|
| American Indian or Native American | 0 | 0 | 0 |
| Asian | 14 | 4 | 10 |
| Black | 7 | 4 | 3 |
| Hispanic | 4 | 1 | 3 |
| Native Hawaiian or Other Pacific Islanders | 0 | 0 | 0 |
| White | 63 | 28 | 35 |
| Two or more races | 12 | 3 | 9 |
| Race Unknown | 1 | 1 | 0 |
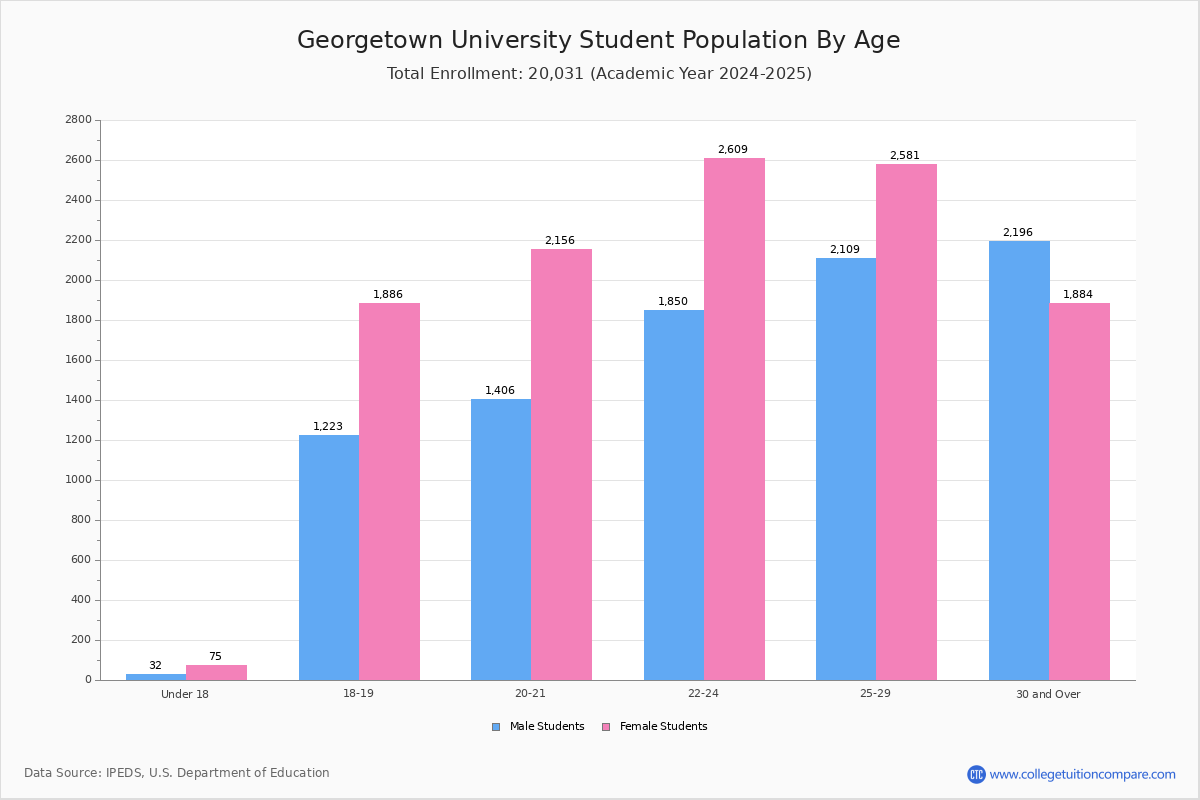
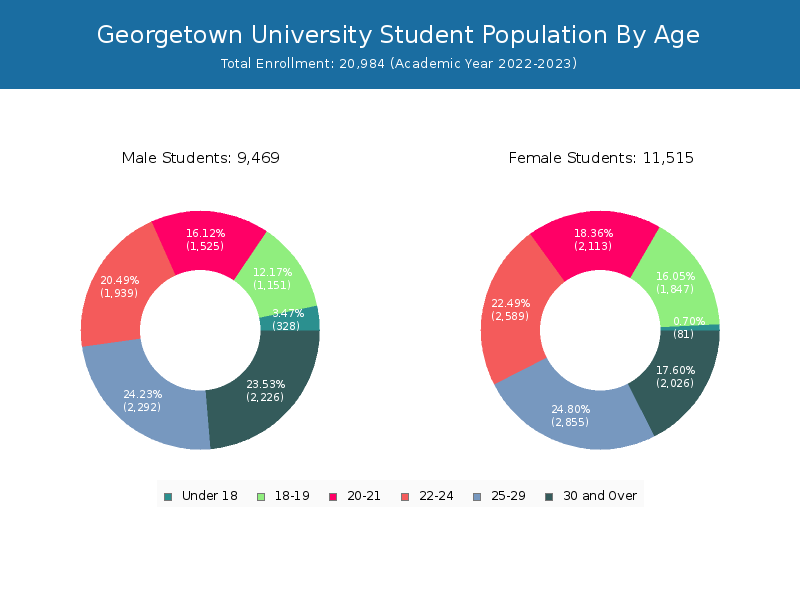
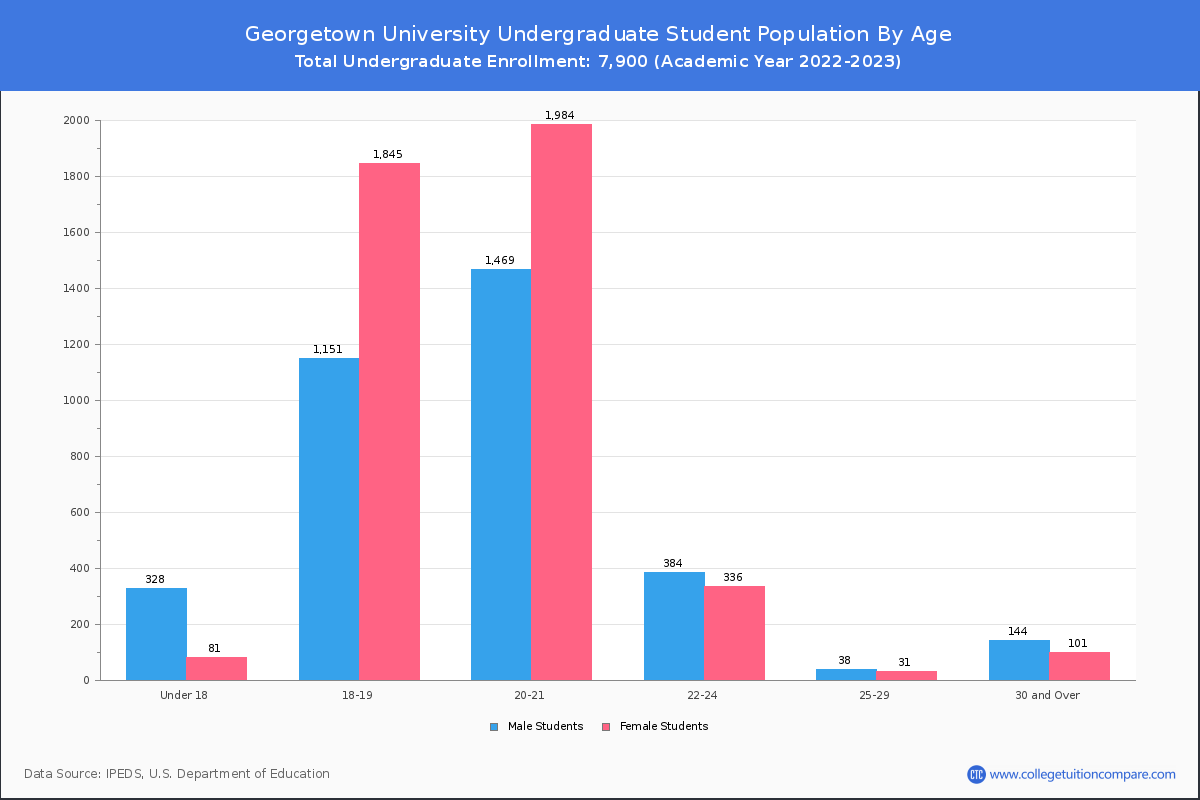
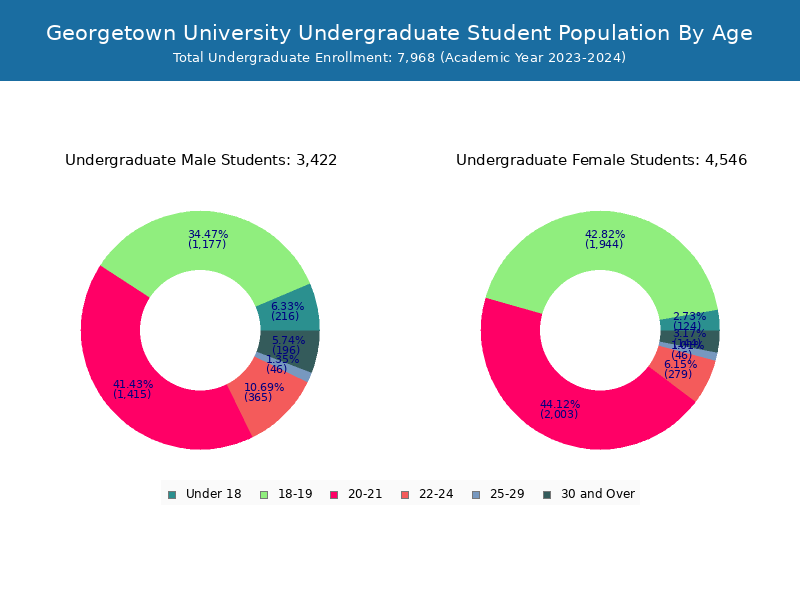
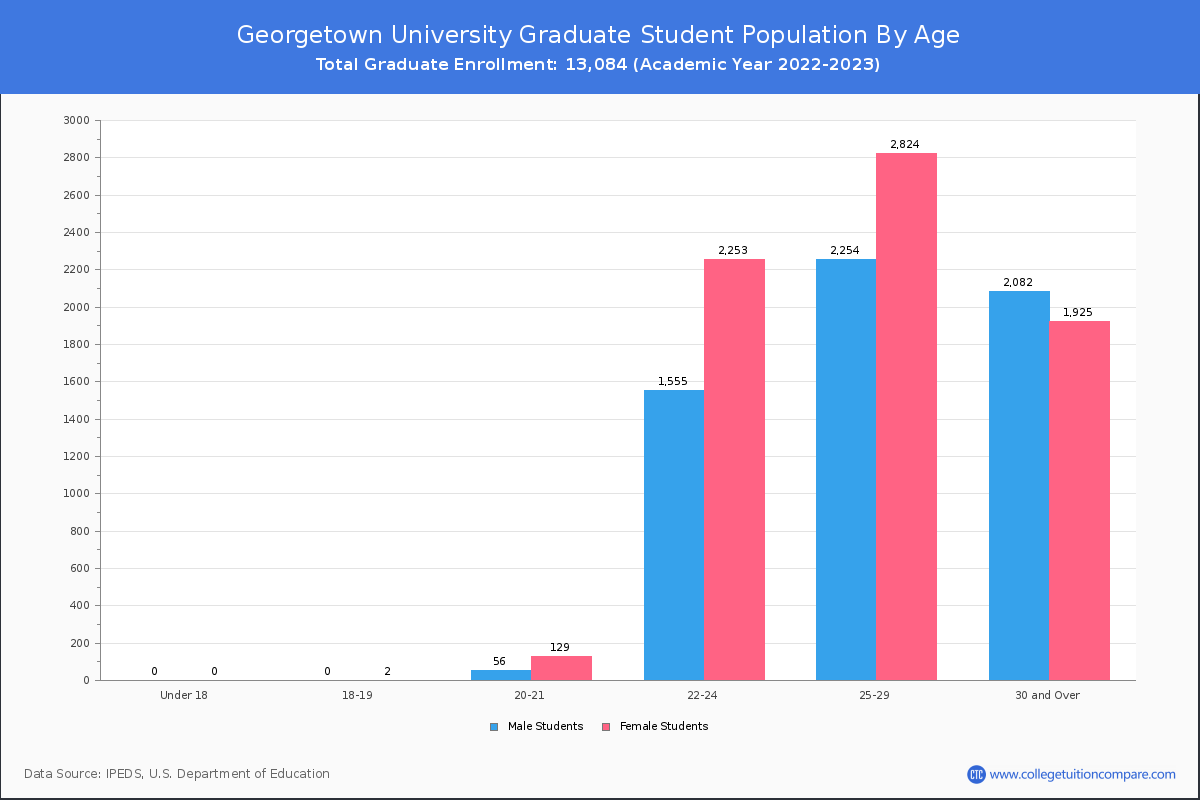
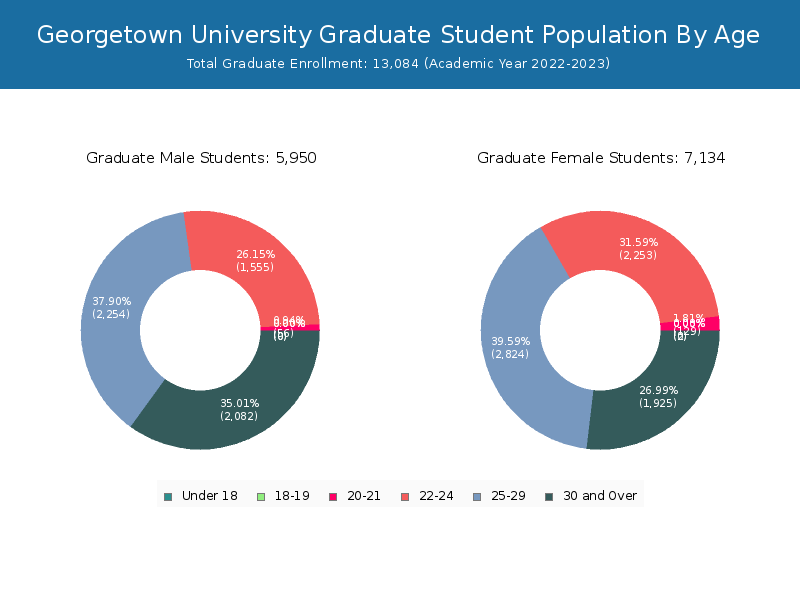
Student Age Distribution
By age, GU has 409 students under 18 years old and 119 students over 65 years old. There are 11,573 students under 25 years old, and 9,399 students over 25 years old out of 20,984 total students.
In undergraduate programs, 409 students are younger than 18 and 99 students are older than 65. GU has 7,578 undergraduate students aged under 25 and 314 students aged 25 and over.
It has 3,995 graduate students aged under 25 and 9,085 students aged 25 and over.
| Age | Total | Men | Women |
|---|---|---|---|
| Under 18 | 409 | 81 | 328 |
| 18-19 | 2,998 | 1,847 | 1,151 |
| 20-21 | 3,638 | 2,113 | 1,525 |
| 22-24 | 4,528 | 2,589 | 1,939 |
| 25-29 | 5,147 | 2,855 | 2,292 |
| 30-34 | 2,147 | 1,000 | 1,147 |
| 35-39 | 969 | 475 | 494 |
| 40-49 | 734 | 370 | 364 |
| 50-64 | 283 | 127 | 156 |
| Over 65 | 119 | 54 | 65 |
| Age | Total | Men | Women |
|---|---|---|---|
| Under 18 | 409 | 81 | 328 |
| 18-19 | 2,996 | 1,845 | 1,151 |
| 20-21 | 3,453 | 1,984 | 1,469 |
| 22-24 | 720 | 336 | 384 |
| 25-29 | 69 | 31 | 38 |
| 30-34 | 40 | 18 | 22 |
| 35-39 | 35 | 17 | 18 |
| 40-49 | 50 | 11 | 39 |
| 50-64 | 21 | 9 | 12 |
| Over 65 | 99 | 46 | 53 |
| Age | Total | Men | Women |
|---|
Online Student Enrollment
Distance learning, also called online education, is very attractive to students, especially who want to continue education and work in field. At Georgetown University, 3,558 students are enrolled exclusively in online courses and 1,382 students are enrolled in some online courses.
192 students lived in District of Columbia or jurisdiction in which the school is located are enrolled exclusively in online courses and 3,366 students live in other State or outside of the United States.
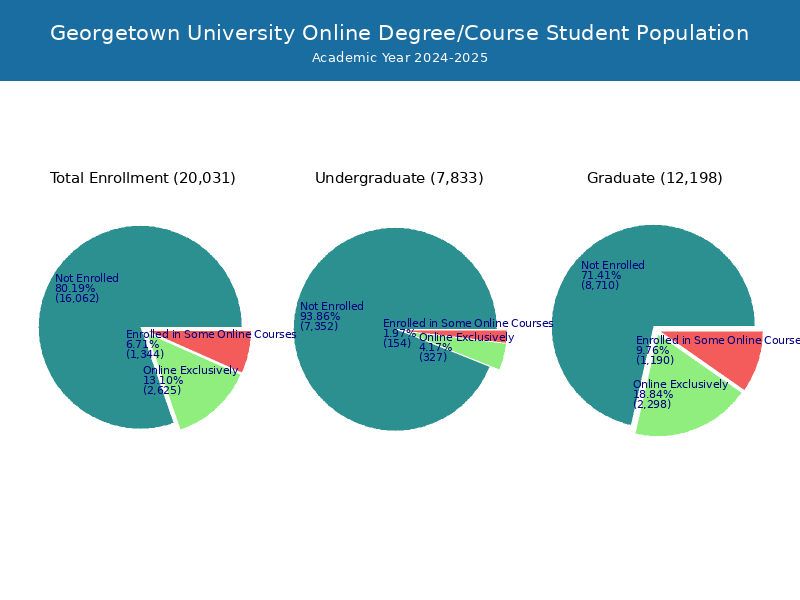
| All Students | Enrolled Exclusively Online Courses | Enrolled in Some Online Courses | |
|---|---|---|---|
| All Students | 20,984 | 3,558 | 1,382 |
| Undergraduate | 7,900 | 372 | 221 |
| Graduate | 13,084 | 3,186 | 1,161 |
| District of Columbia Residents | Other States in U.S. | Outside of U.S. | |
|---|---|---|---|
| All Students | 192 | 2,976 | 390 |
| Undergraduate | 8 | 39 | 325 |
| Graduate | 184 | 2,937 | 65 |
Transfer-in Students (Undergraduate)
Among 7,900 enrolled in undergraduate programs, 110 students have transferred-in from other institutions. The percentage of transfer-in students is 1.39%.
| Number of Students | |
|---|---|
| Regular Full-time | 7,077 |
| Transfer-in Full-time | 110 |