Student Population by Gender
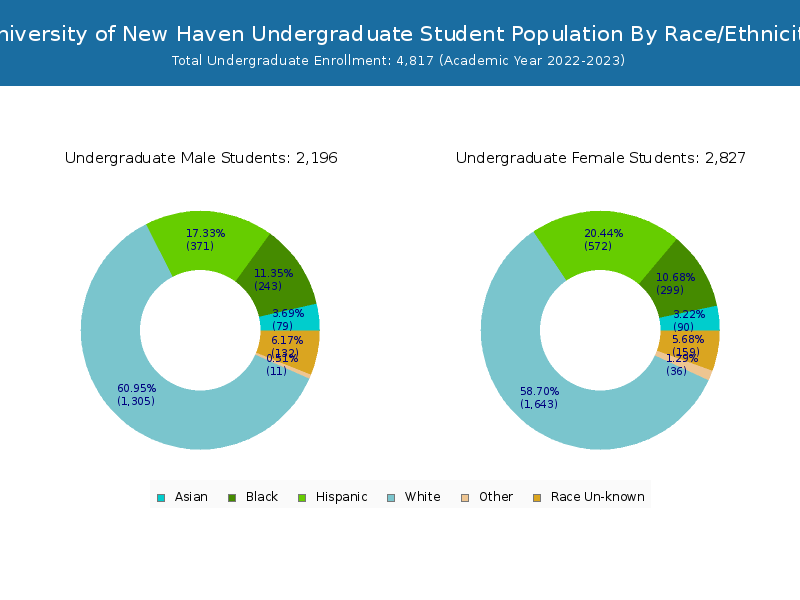
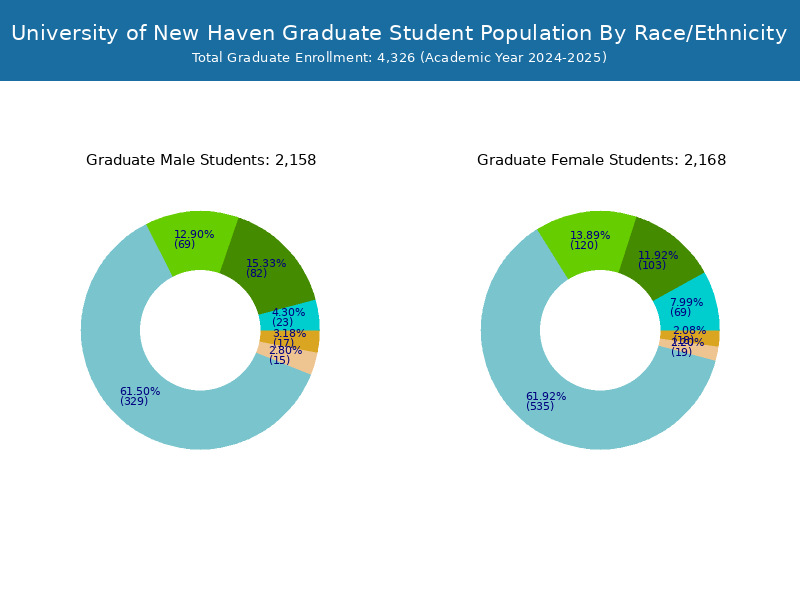
University of New Haven has a total of 8,819 enrolled students for the academic year 2022-2023. 4,817 students have enrolled in undergraduate programs and 4,002 students joined graduate programs.
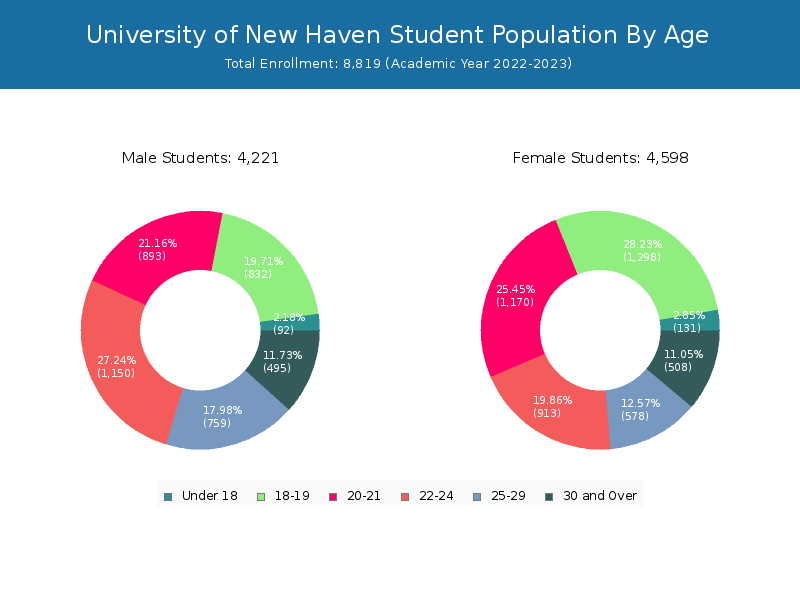
By gender, 4,221 male and 4,598 female students (the male-female ratio is 48:52) are attending the school. The gender distribution is based on the 2022-2023 data.
| Total | Undergraduate | Graduate | |
|---|---|---|---|
| Total | 8,819 | 4,817 | 4,002 |
| Men | 4,221 | 2,090 | 2,131 |
| Women | 4,598 | 2,727 | 1,871 |
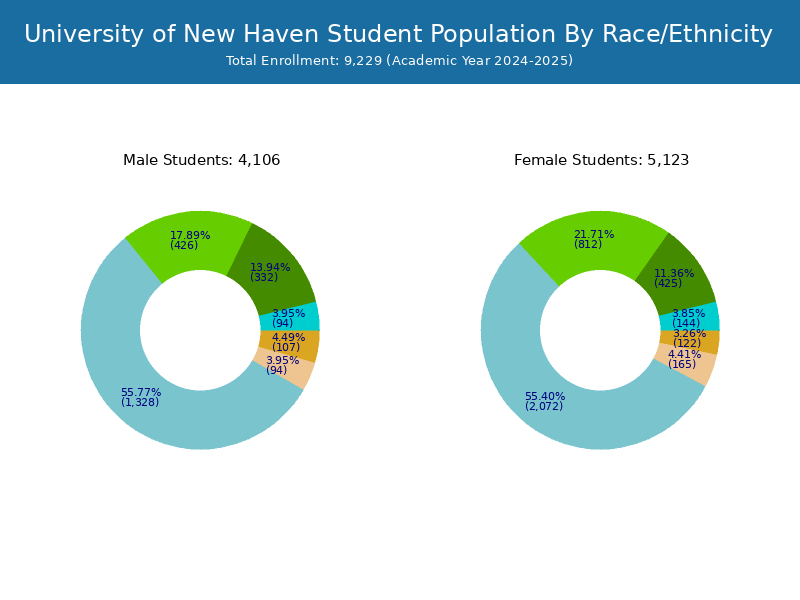
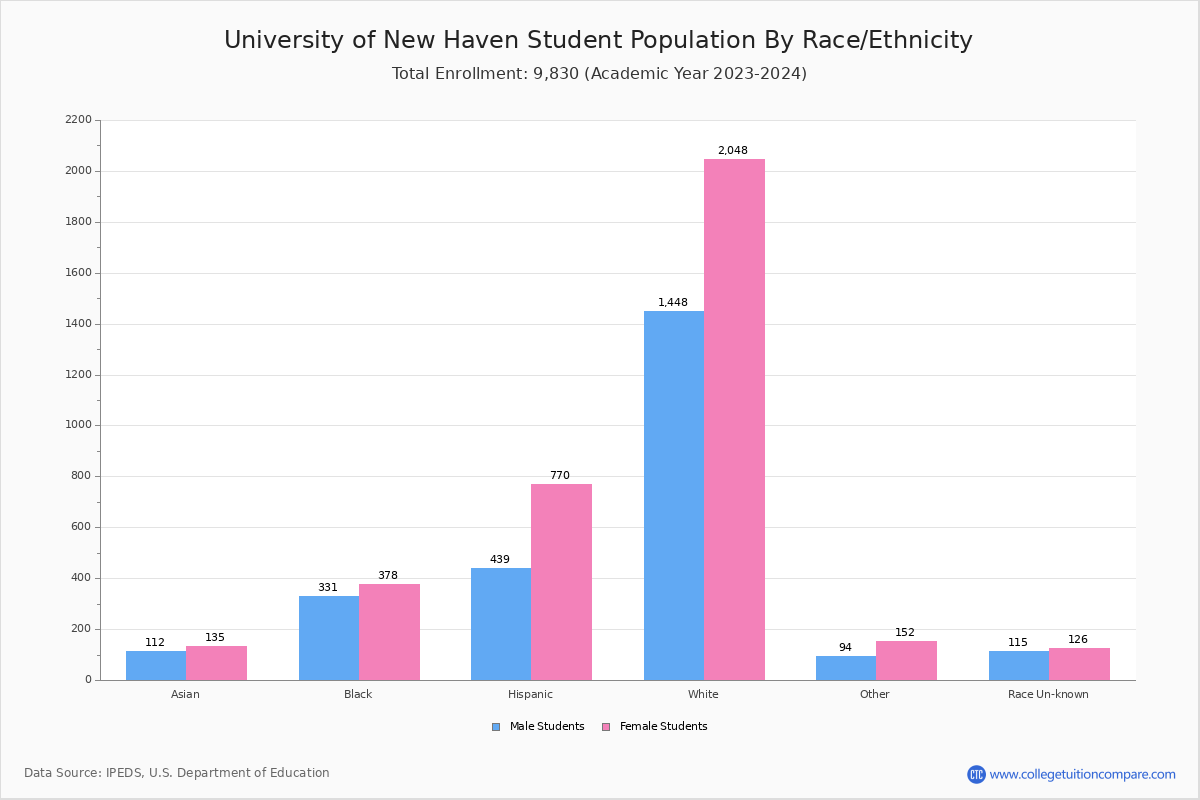
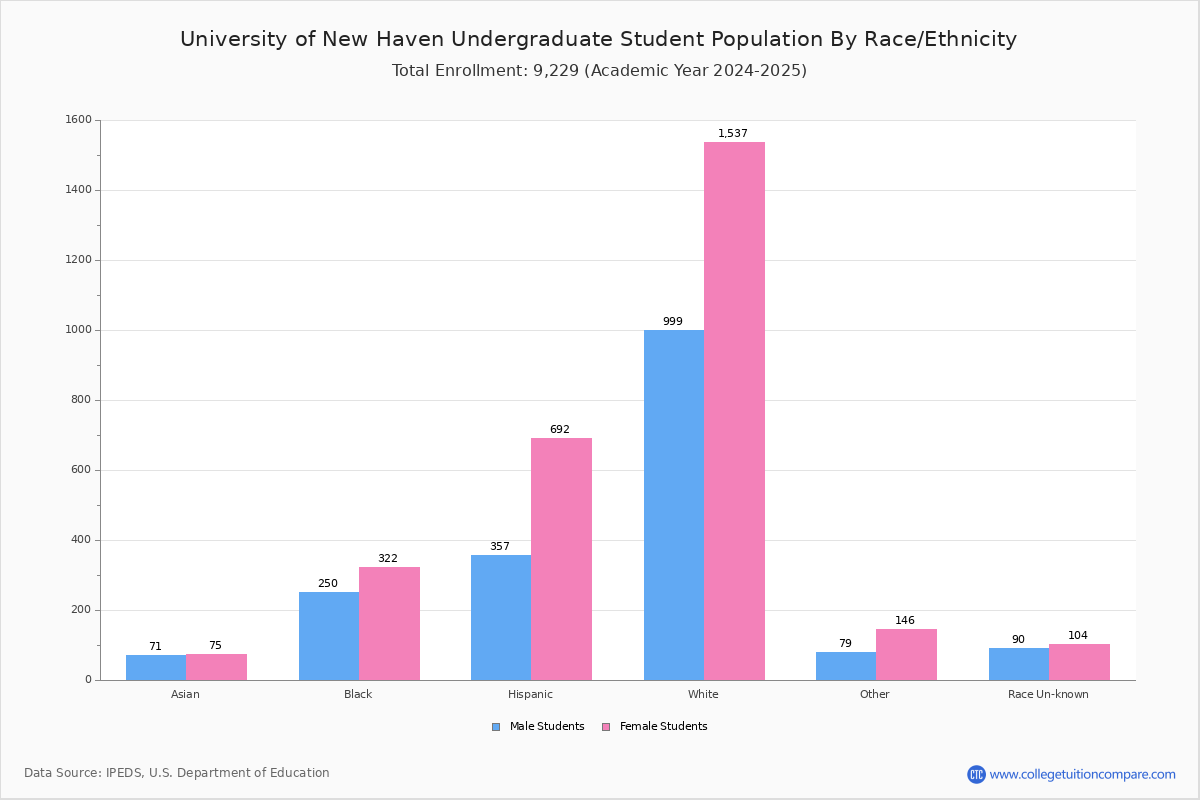
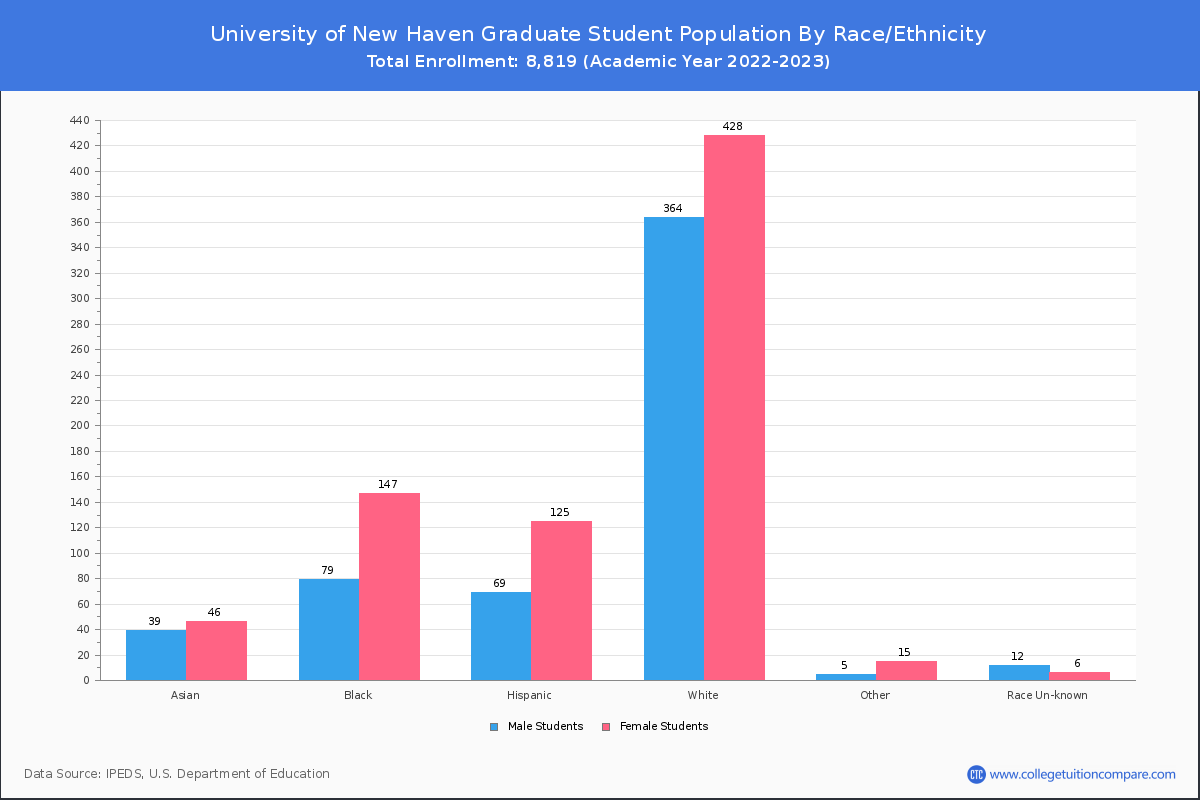
Student Distribution by Race/Ethnicity
By race/ethnicity, 3,632 White, 770 Black, and 242 Asian students out of a total of 8,819 are attending at University of New Haven. Comprehensive enrollment statistic data by race/ethnicity is shown in the next chart (Academic year 2022-2023 data).
| Race | Total | Men | Women |
|---|---|---|---|
| American Indian or Native American | 22 | 7 | 15 |
| Asian | 242 | 102 | 140 |
| Black | 770 | 353 | 417 |
| Hispanic | 1,118 | 425 | 693 |
| Native Hawaiian or Other Pacific Islanders | 1 | 0 | 1 |
| White | 3,632 | 1,555 | 2,077 |
| Two or more races | 90 | 22 | 68 |
| Race Unknown | 255 | 96 | 159 |
| Race | Total | Men | Women |
|---|---|---|---|
| American Indian or Native American | 12 | 5 | 7 |
| Asian | 160 | 77 | 83 |
| Black | 543 | 258 | 285 |
| Hispanic | 929 | 360 | 569 |
| Native Hawaiian or Other Pacific Islanders | 1 | 0 | 1 |
| White | 2,761 | 1,212 | 1,549 |
| Two or more races | 70 | 21 | 49 |
| Race Unknown | 229 | 88 | 141 |
| Race | Total | Men | Women |
|---|---|---|---|
| American Indian or Native American | 0 | 0 | 0 |
| Asian | 3 | 1 | 2 |
| Black | 21 | 14 | 7 |
| Hispanic | 46 | 17 | 29 |
| Native Hawaiian or Other Pacific Islanders | 0 | 0 | 0 |
| White | 114 | 53 | 61 |
| Two or more races | 6 | 2 | 4 |
| Race Unknown | 8 | 6 | 2 |
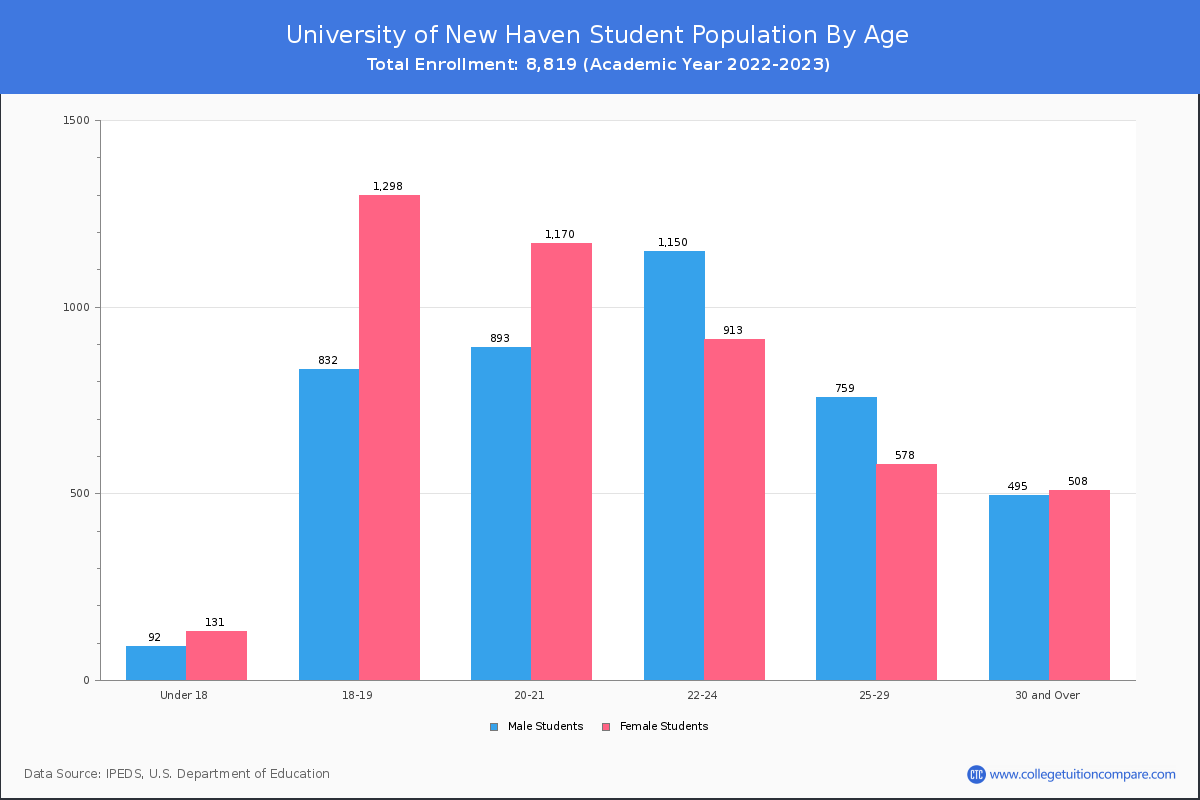
Student Age Distribution
By age, UNH has 223 students under 18 years old and 5 students over 65 years old. There are 6,479 students under 25 years old, and 2,340 students over 25 years old out of 8,819 total students.
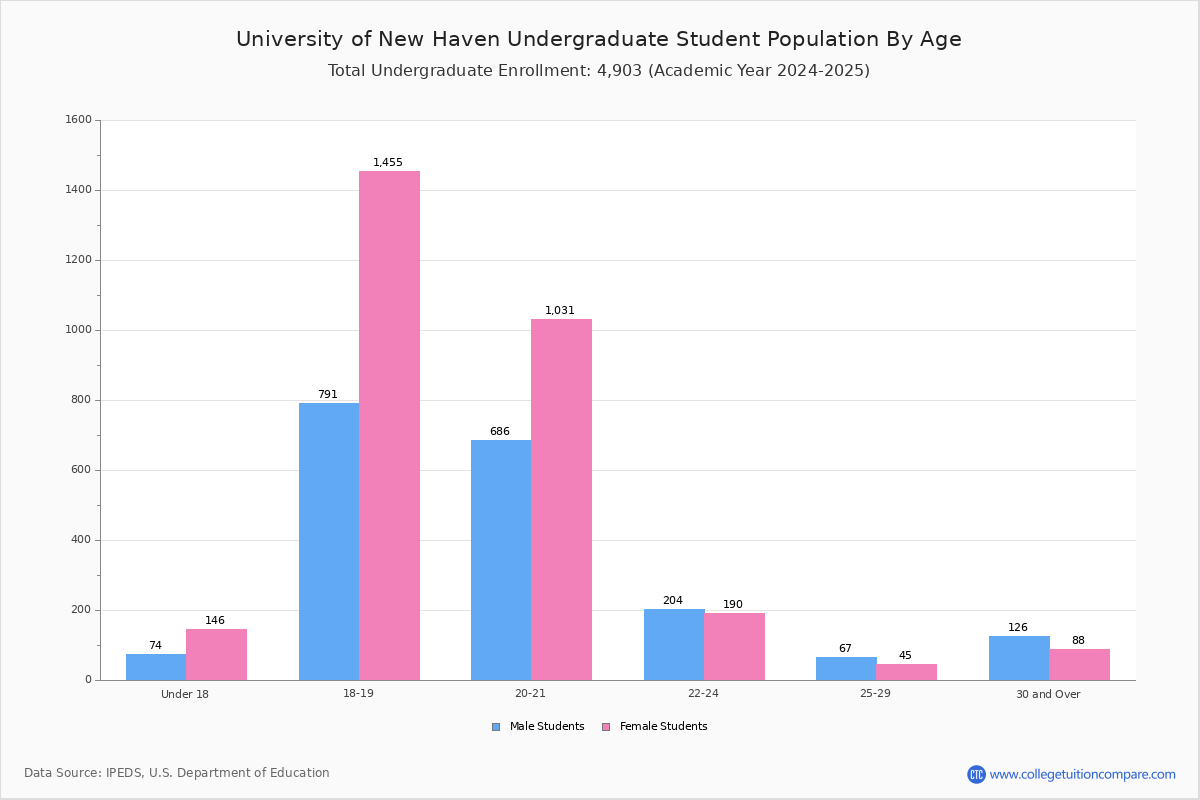
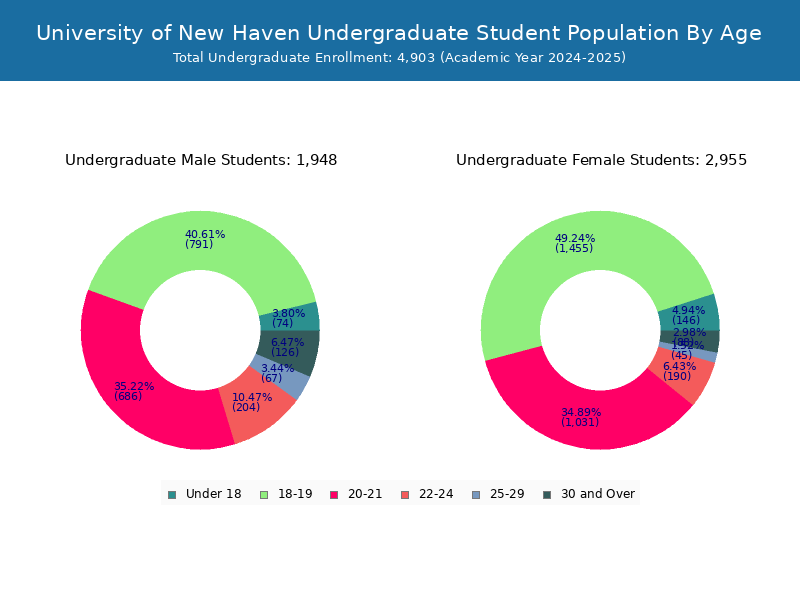
UNH has 4,530 undergraduate students aged under 25 and 287 students aged 25 and over.
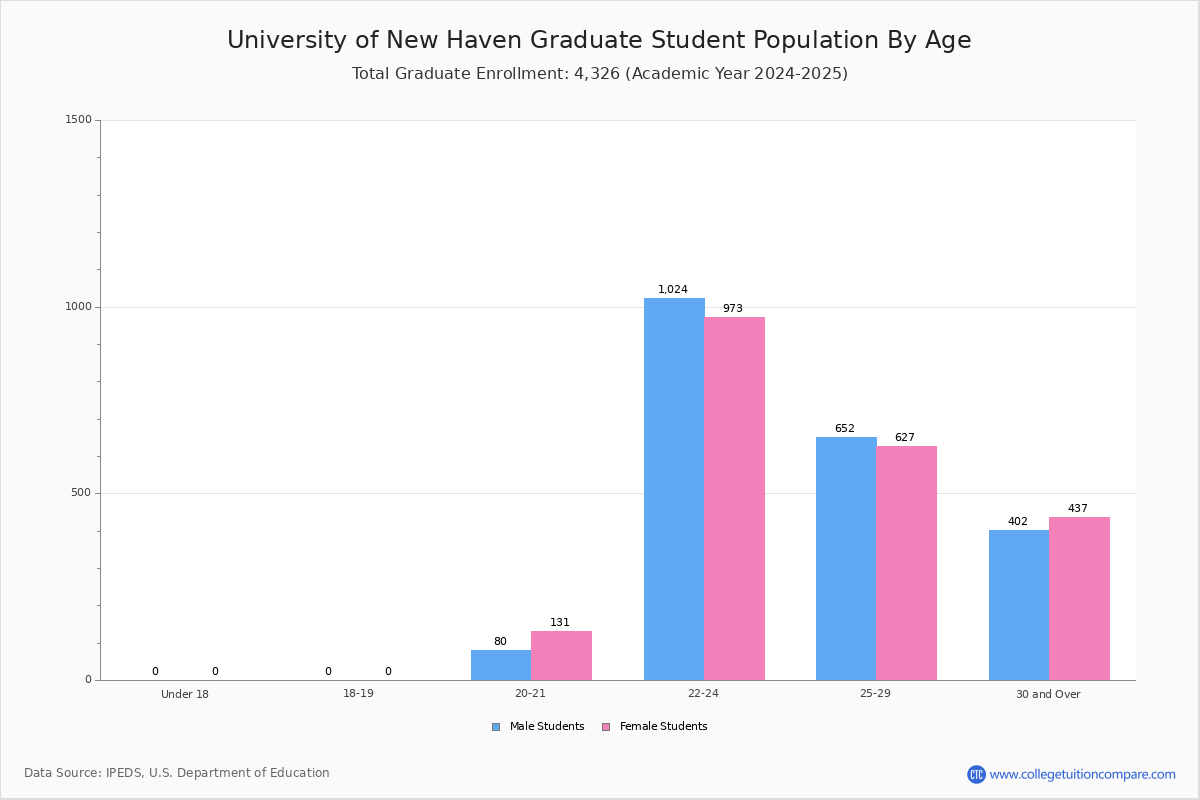
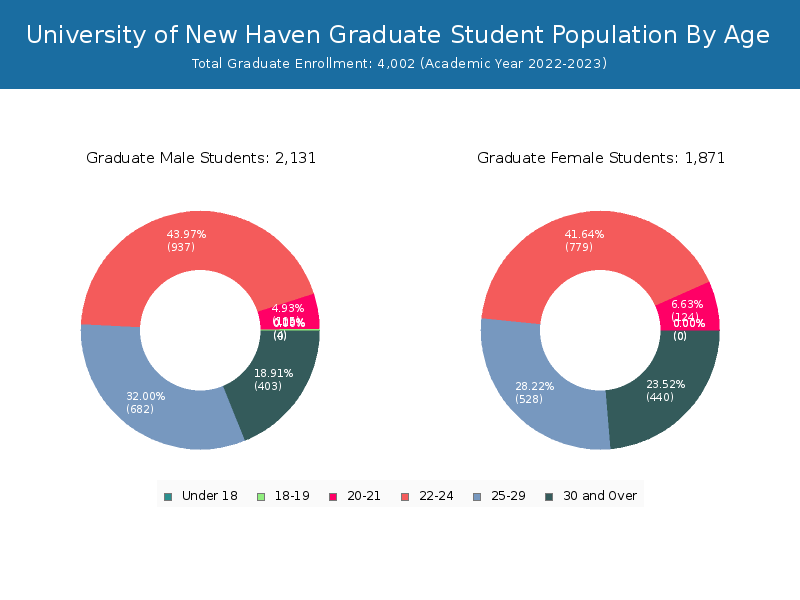
It has 1,949 graduate students aged under 25 and 2,053 students aged 25 and over.
| Age | Total | Men | Women |
|---|---|---|---|
| Under 18 | 223 | 131 | 92 |
| 18-19 | 2,130 | 1,298 | 832 |
| 20-21 | 2,063 | 1,170 | 893 |
| 22-24 | 2,063 | 913 | 1,150 |
| 25-29 | 1,337 | 578 | 759 |
| 30-34 | 432 | 208 | 224 |
| 35-39 | 237 | 112 | 125 |
| 40-49 | 218 | 121 | 97 |
| 50-64 | 111 | 64 | 47 |
| Over 65 | 5 | 3 | 2 |
| Age | Total | Men | Women |
|---|---|---|---|
| Under 18 | 223 | 131 | 92 |
| 18-19 | 2,126 | 1,298 | 828 |
| 20-21 | 1,834 | 1,046 | 788 |
| 22-24 | 347 | 134 | 213 |
| 25-29 | 127 | 50 | 77 |
| 30-34 | 65 | 25 | 40 |
| 35-39 | 45 | 21 | 24 |
| 40-49 | 31 | 12 | 19 |
| 50-64 | 19 | 10 | 9 |
| Age | Total | Men | Women |
|---|
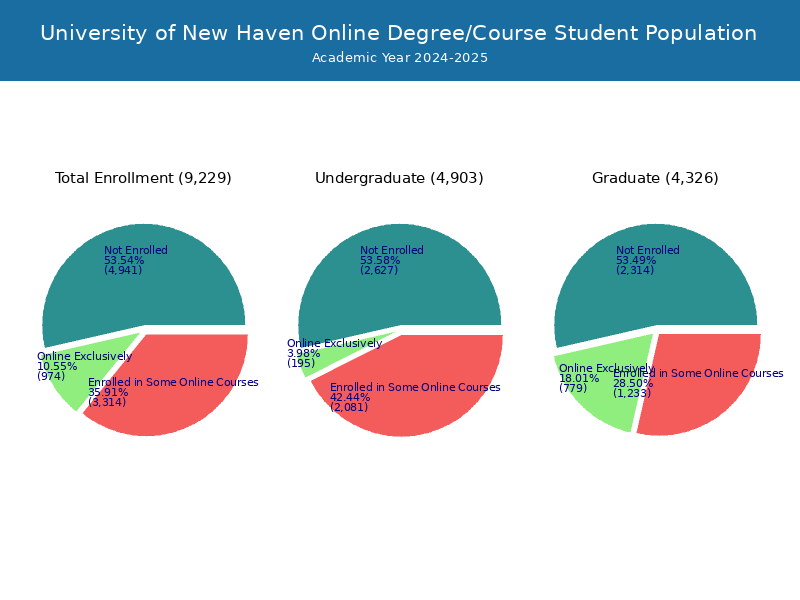
Online Student Enrollment
Distance learning, also called online education, is very attractive to students, especially who want to continue education and work in field. At University of New Haven, 1,035 students are enrolled exclusively in online courses and 4,668 students are enrolled in some online courses.
439 students lived in Connecticut or jurisdiction in which the school is located are enrolled exclusively in online courses and 596 students live in other State or outside of the United States.
| All Students | Enrolled Exclusively Online Courses | Enrolled in Some Online Courses | |
|---|---|---|---|
| All Students | 8,819 | 1,035 | 4,668 |
| Undergraduate | 4,817 | 191 | 3,144 |
| Graduate | 4,002 | 844 | 1,524 |
| Connecticut Residents | Other States in U.S. | Outside of U.S. | |
|---|---|---|---|
| All Students | 439 | 567 | 29 |
| Undergraduate | 77 | 114 | 0 |
| Graduate | 362 | 453 | 29 |
Transfer-in Students (Undergraduate)
Among 4,817 enrolled in undergraduate programs, 205 students have transferred-in from other institutions. The percentage of transfer-in students is 4.26%.173 students have transferred in as full-time status and 32 students transferred in as part-time status.
| Number of Students | |
|---|---|
| Regular Full-time | 4,311 |
| Transfer-in Full-time | 173 |
| Regular Part-time | 301 |
| Transfer-in Part-time | 32 |