Student Population by Gender
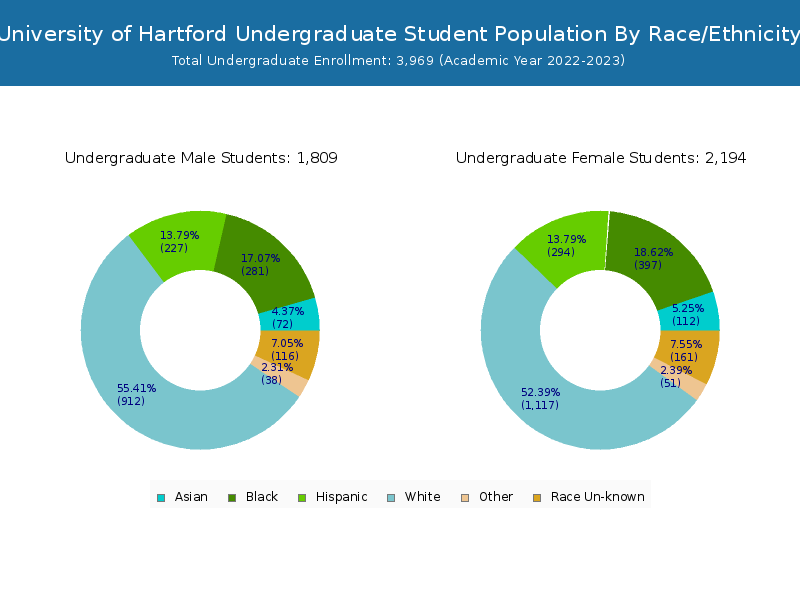
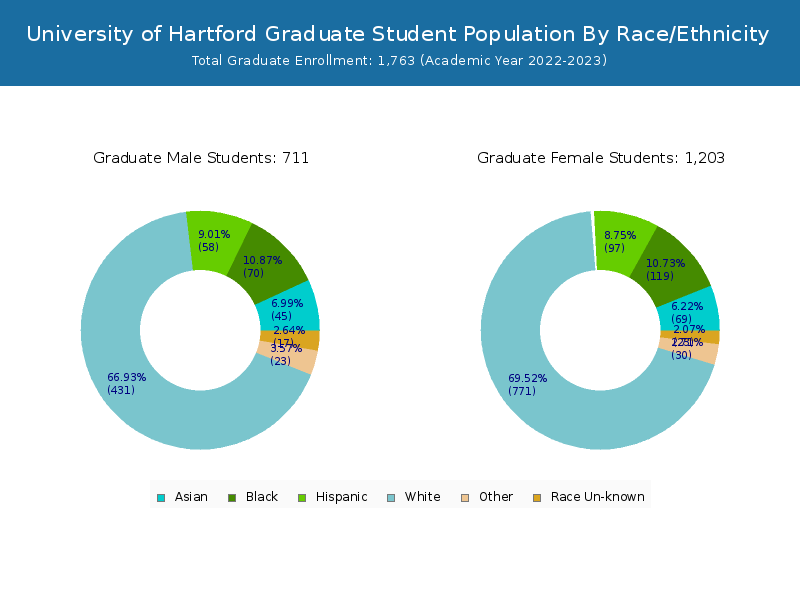
University of Hartford has a total of 5,732 enrolled students for the academic year 2022-2023. 3,969 students have enrolled in undergraduate programs and 1,763 students joined graduate programs.
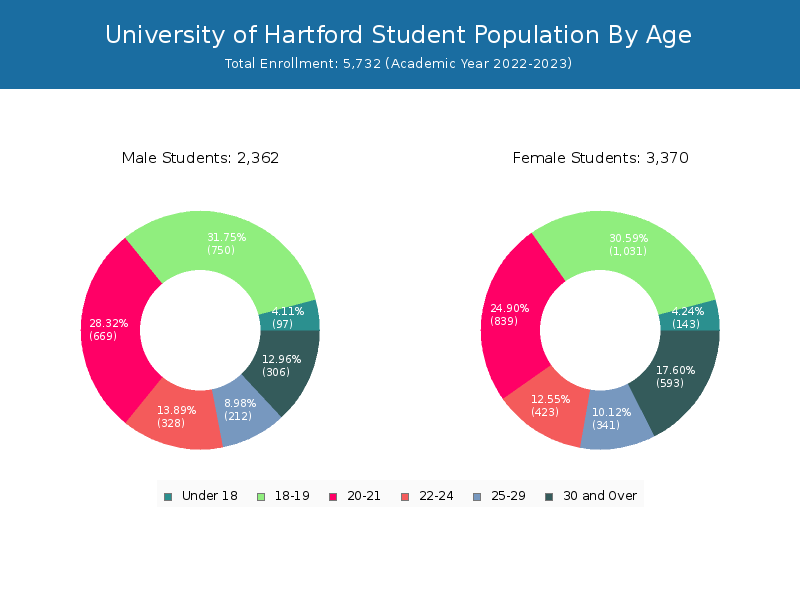
By gender, 2,362 male and 3,370 female students (the male-female ratio is 41:59) are attending the school. The gender distribution is based on the 2022-2023 data.
| Total | Undergraduate | Graduate | |
|---|---|---|---|
| Total | 5,732 | 3,969 | 1,763 |
| Men | 2,362 | 1,739 | 623 |
| Women | 3,370 | 2,230 | 1,140 |
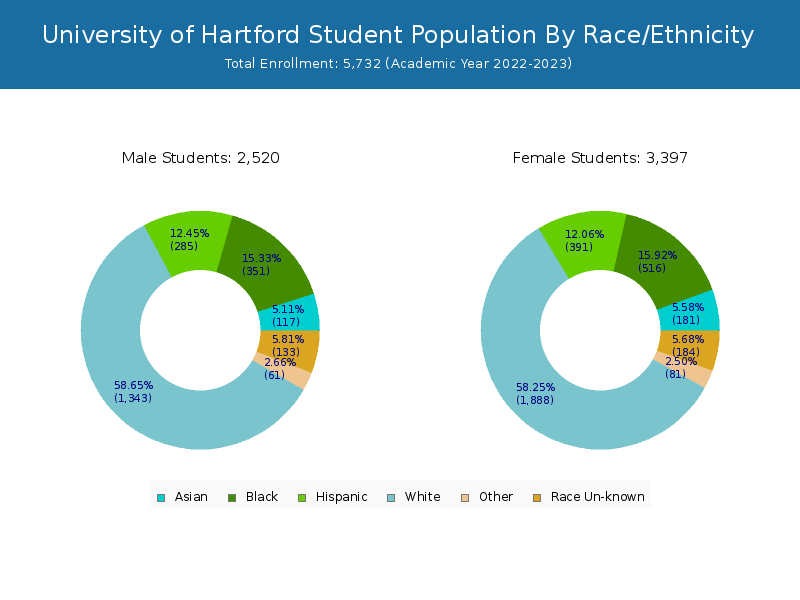
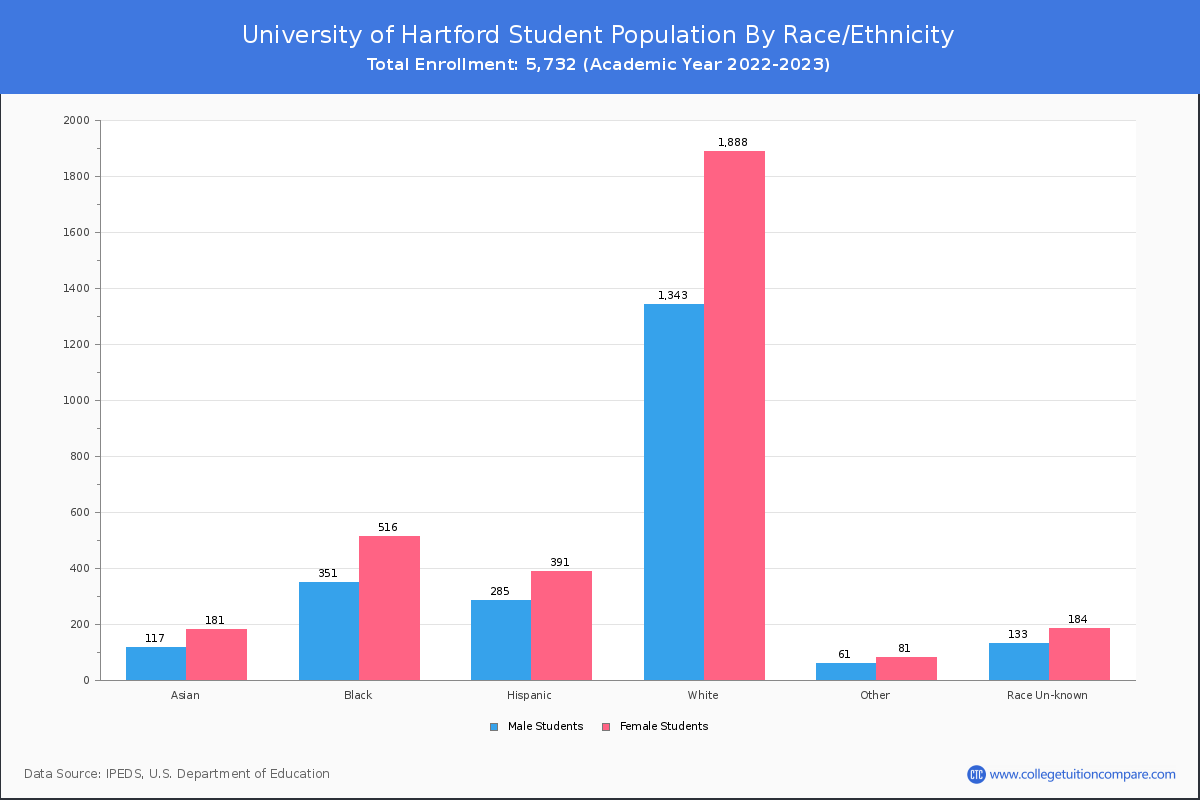
Student Distribution by Race/Ethnicity
By race/ethnicity, 3,050 White, 830 Black, and 271 Asian students out of a total of 5,732 are attending at University of Hartford. Comprehensive enrollment statistic data by race/ethnicity is shown in the next chart (Academic year 2022-2023 data).
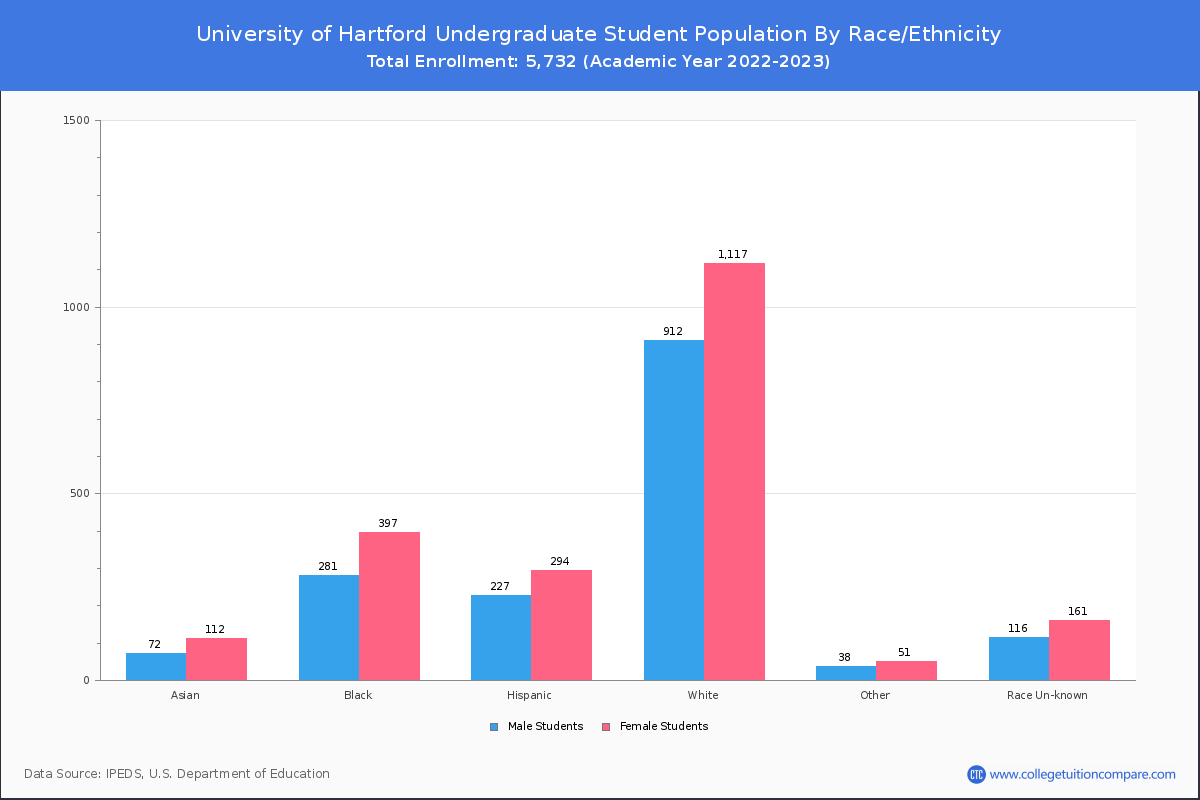
| Race | Total | Men | Women |
|---|---|---|---|
| American Indian or Native American | 18 | 6 | 12 |
| Asian | 271 | 103 | 168 |
| Black | 830 | 320 | 510 |
| Hispanic | 756 | 301 | 455 |
| Native Hawaiian or Other Pacific Islanders | 6 | 2 | 4 |
| White | 3,050 | 1,230 | 1,820 |
| Two or more races | 116 | 52 | 64 |
| Race Unknown | 286 | 108 | 178 |
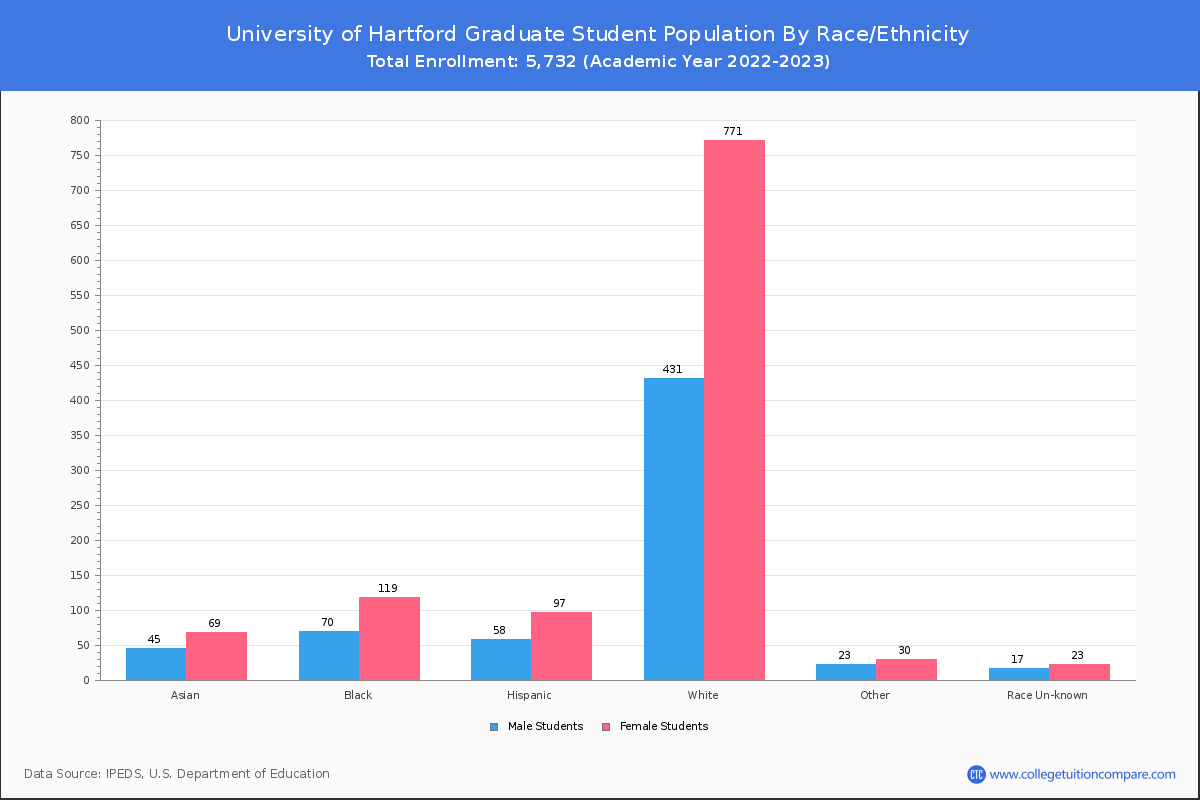
| Race | Total | Men | Women |
|---|---|---|---|
| American Indian or Native American | 17 | 5 | 12 |
| Asian | 167 | 65 | 102 |
| Black | 666 | 259 | 407 |
| Hispanic | 601 | 237 | 364 |
| Native Hawaiian or Other Pacific Islanders | 6 | 2 | 4 |
| White | 1,964 | 872 | 1,092 |
| Two or more races | 75 | 34 | 41 |
| Race Unknown | 259 | 103 | 156 |
| Race | Total | Men | Women |
|---|---|---|---|
| American Indian or Native American | 3 | 1 | 2 |
| Asian | 7 | 1 | 6 |
| Black | 16 | 6 | 10 |
| Hispanic | 20 | 4 | 16 |
| Native Hawaiian or Other Pacific Islanders | 0 | 0 | 0 |
| White | 74 | 34 | 40 |
| Two or more races | 1 | 1 | 0 |
| Race Unknown | 25 | 12 | 13 |
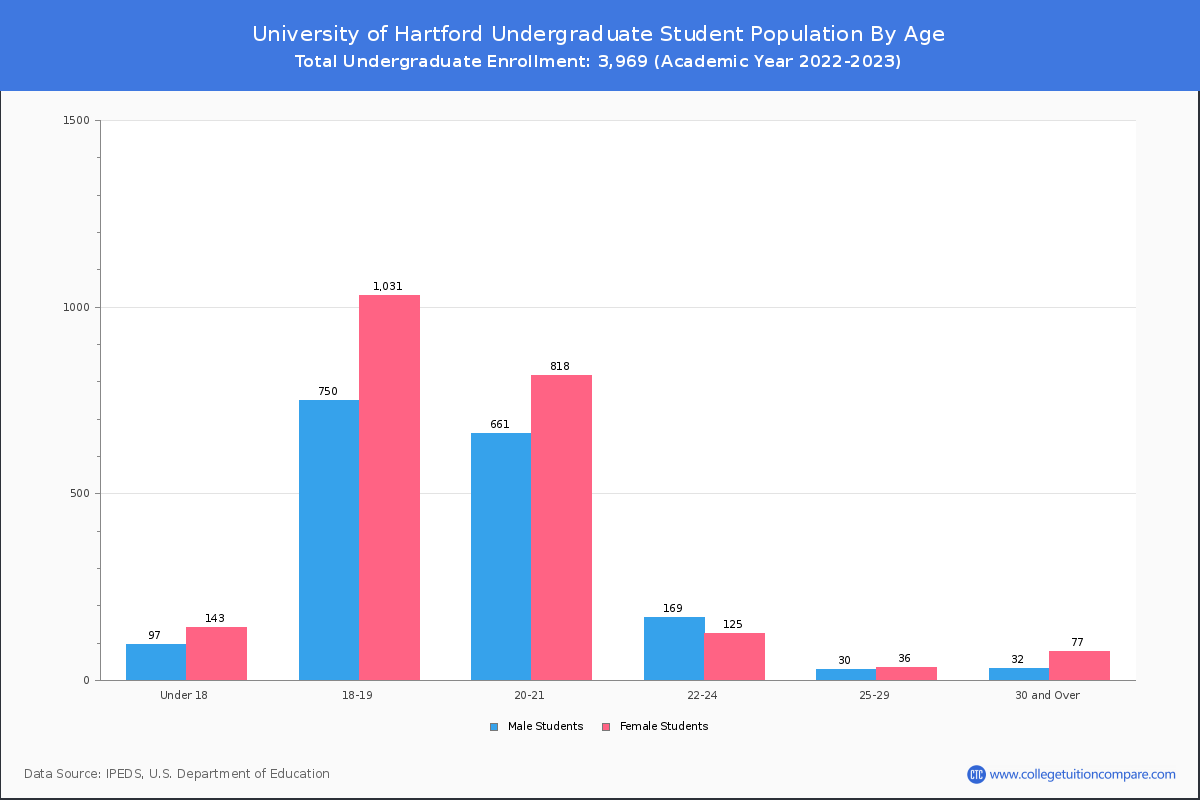
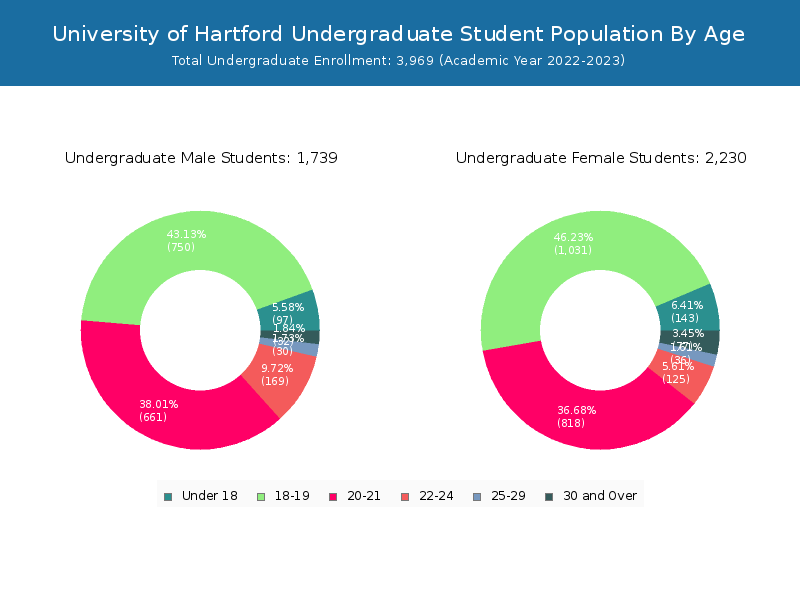
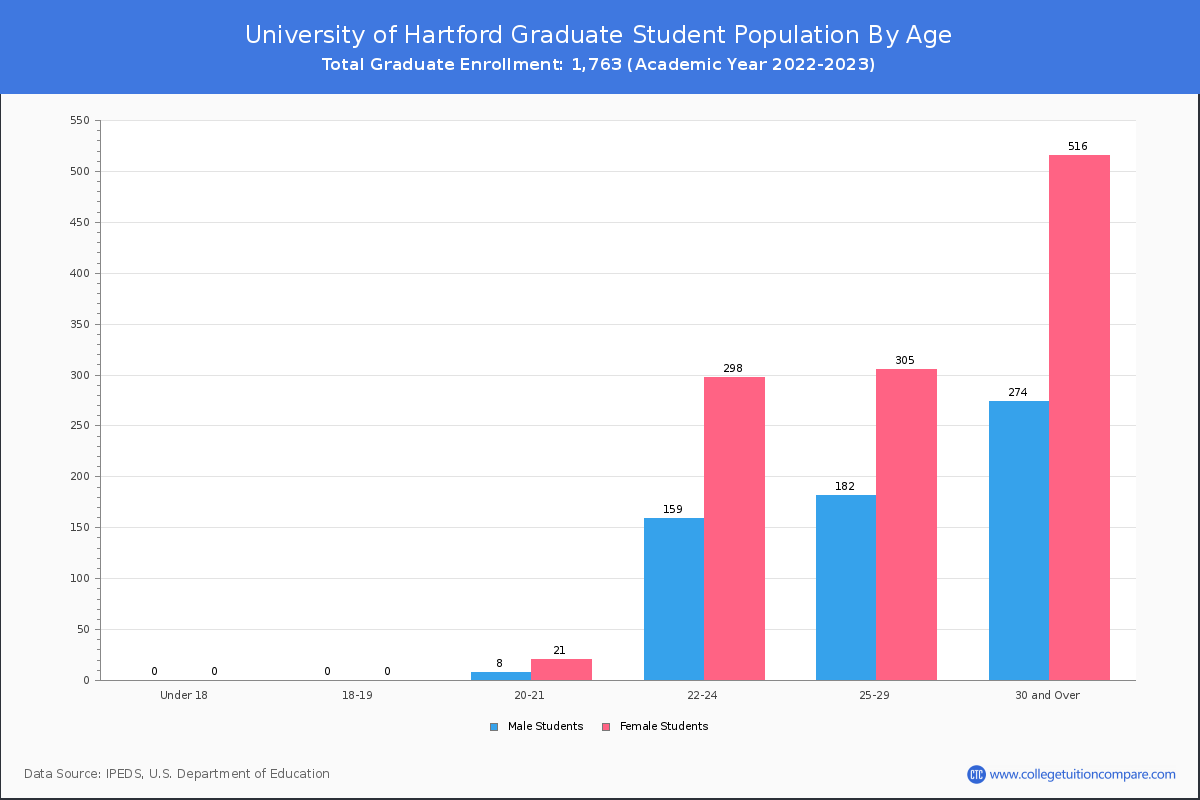
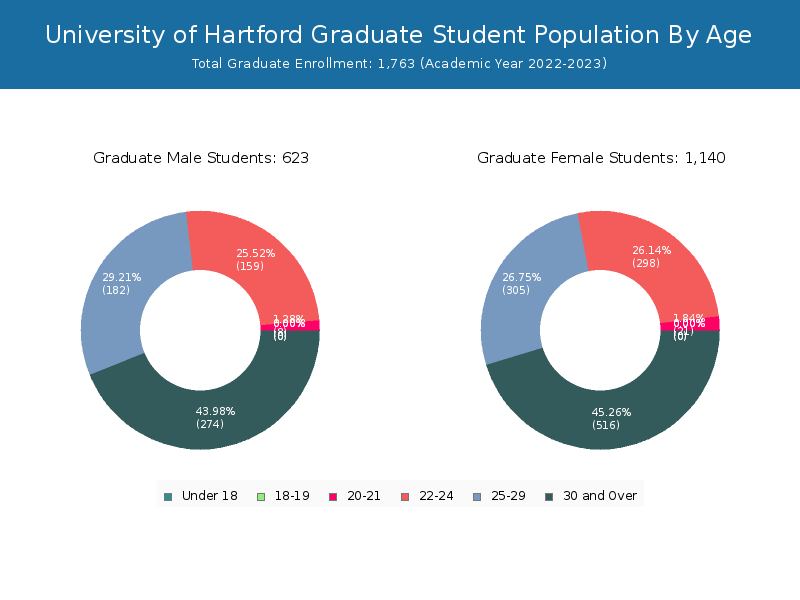
Student Age Distribution
By age, UHA has 240 students under 18 years old and 11 students over 65 years old. There are 4,280 students under 25 years old, and 1,452 students over 25 years old out of 5,732 total students.
In undergraduate programs, 240 students are younger than 18 and 7 students are older than 65. UHA has 3,794 undergraduate students aged under 25 and 175 students aged 25 and over.
It has 486 graduate students aged under 25 and 1,277 students aged 25 and over.
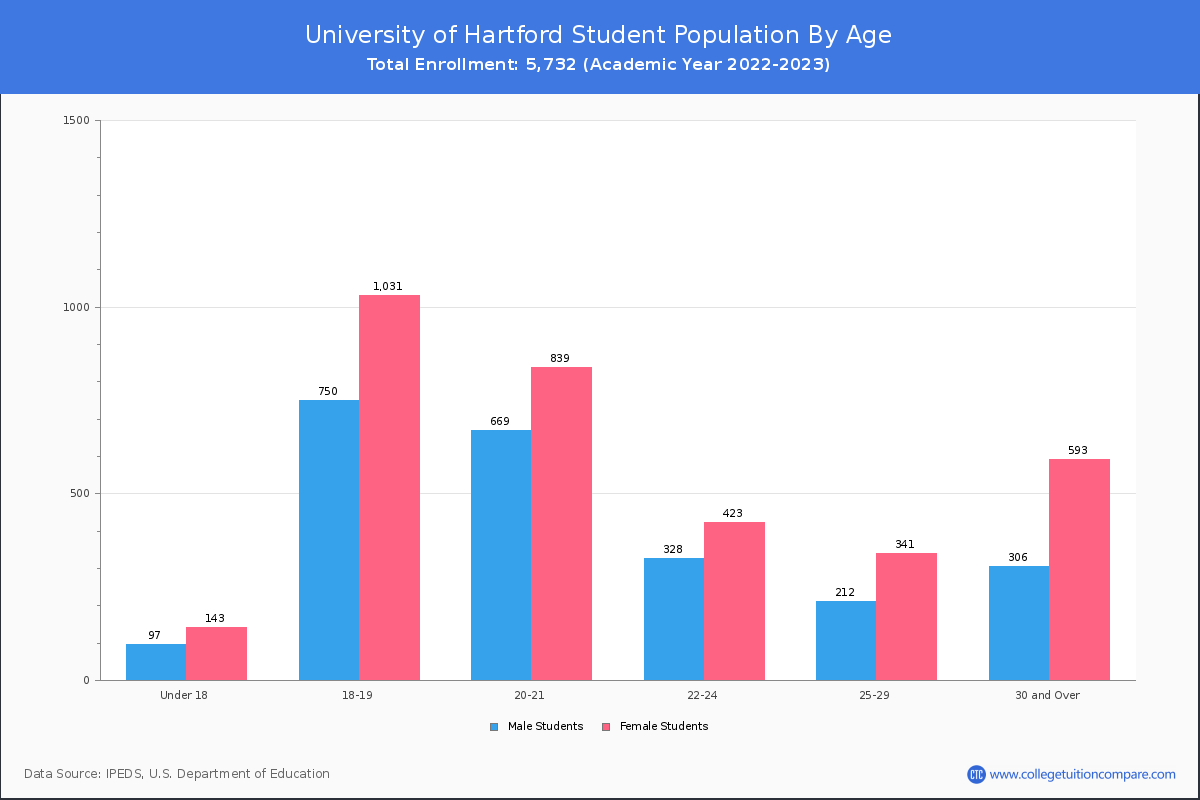
| Age | Total | Men | Women |
|---|---|---|---|
| Under 18 | 240 | 143 | 97 |
| 18-19 | 1,781 | 1,031 | 750 |
| 20-21 | 1,508 | 839 | 669 |
| 22-24 | 751 | 423 | 328 |
| 25-29 | 553 | 341 | 212 |
| 30-34 | 297 | 182 | 115 |
| 35-39 | 206 | 127 | 79 |
| 40-49 | 256 | 179 | 77 |
| 50-64 | 129 | 99 | 30 |
| Over 65 | 11 | 6 | 5 |
| Age | Total | Men | Women |
|---|---|---|---|
| Under 18 | 240 | 143 | 97 |
| 18-19 | 1,781 | 1,031 | 750 |
| 20-21 | 1,479 | 818 | 661 |
| 22-24 | 294 | 125 | 169 |
| 25-29 | 66 | 36 | 30 |
| 30-34 | 24 | 18 | 6 |
| 35-39 | 22 | 14 | 8 |
| 40-49 | 30 | 20 | 10 |
| 50-64 | 26 | 22 | 4 |
| Over 65 | 7 | 3 | 4 |
| Age | Total | Men | Women |
|---|
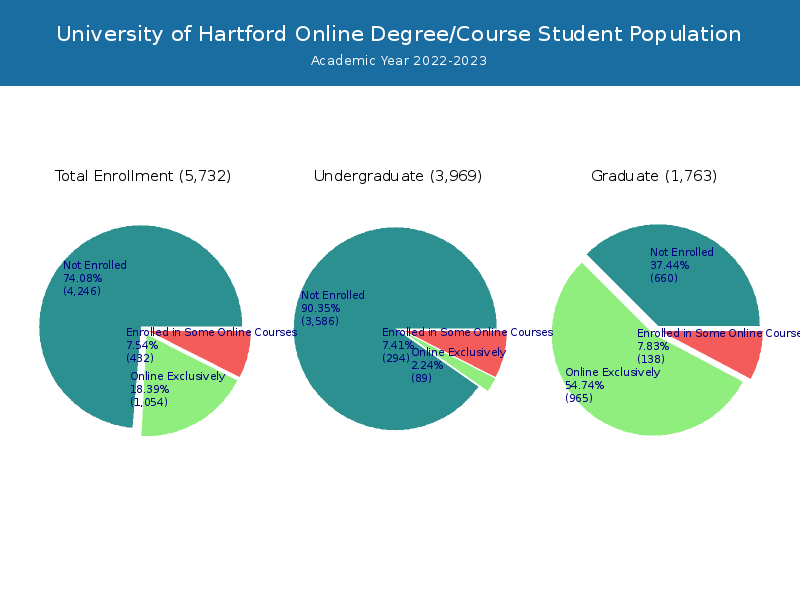
Online Student Enrollment
Distance learning, also called online education, is very attractive to students, especially who want to continue education and work in field. At University of Hartford, 1,054 students are enrolled exclusively in online courses and 432 students are enrolled in some online courses.
598 students lived in Connecticut or jurisdiction in which the school is located are enrolled exclusively in online courses and 456 students live in other State or outside of the United States.
| All Students | Enrolled Exclusively Online Courses | Enrolled in Some Online Courses | |
|---|---|---|---|
| All Students | 5,732 | 1,054 | 432 |
| Undergraduate | 3,969 | 89 | 294 |
| Graduate | 1,763 | 965 | 138 |
| Connecticut Residents | Other States in U.S. | Outside of U.S. | |
|---|---|---|---|
| All Students | 598 | 418 | 38 |
| Undergraduate | 56 | 33 | 0 |
| Graduate | 542 | 385 | 38 |
Transfer-in Students (Undergraduate)
Among 3,969 enrolled in undergraduate programs, 158 students have transferred-in from other institutions. The percentage of transfer-in students is 3.98%.121 students have transferred in as full-time status and 37 students transferred in as part-time status.
| Number of Students | |
|---|---|
| Regular Full-time | 3,559 |
| Transfer-in Full-time | 121 |
| Regular Part-time | 252 |
| Transfer-in Part-time | 37 |