Student Population by Gender
Fairfield University has a total of 6,019 enrolled students for the academic year 2022-2023. 4,757 students have enrolled in undergraduate programs and 1,262 students joined graduate programs.
By gender, 2,457 male and 3,562 female students (the male-female ratio is 41:59) are attending the school. The gender distribution is based on the 2022-2023 data.
| Total | Undergraduate | Graduate | |
|---|---|---|---|
| Total | 6,019 | 4,757 | 1,262 |
| Men | 2,457 | 2,016 | 441 |
| Women | 3,562 | 2,741 | 821 |
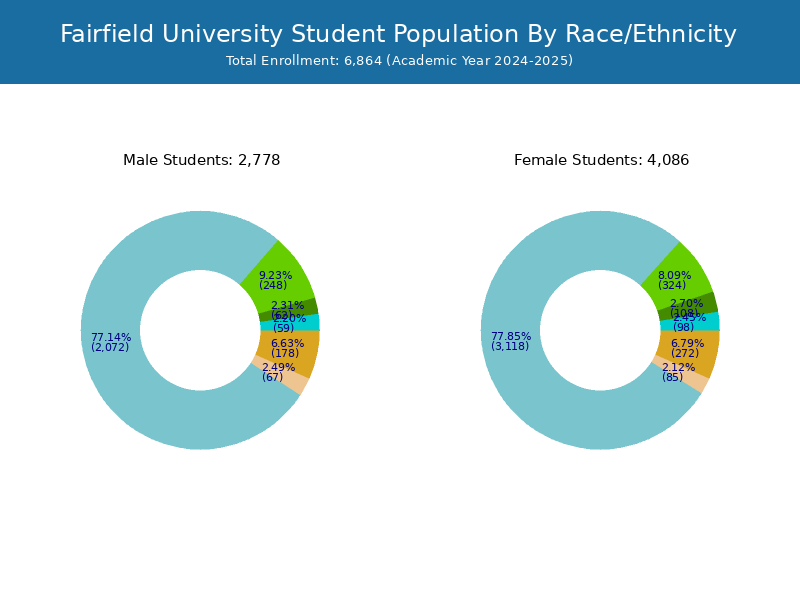
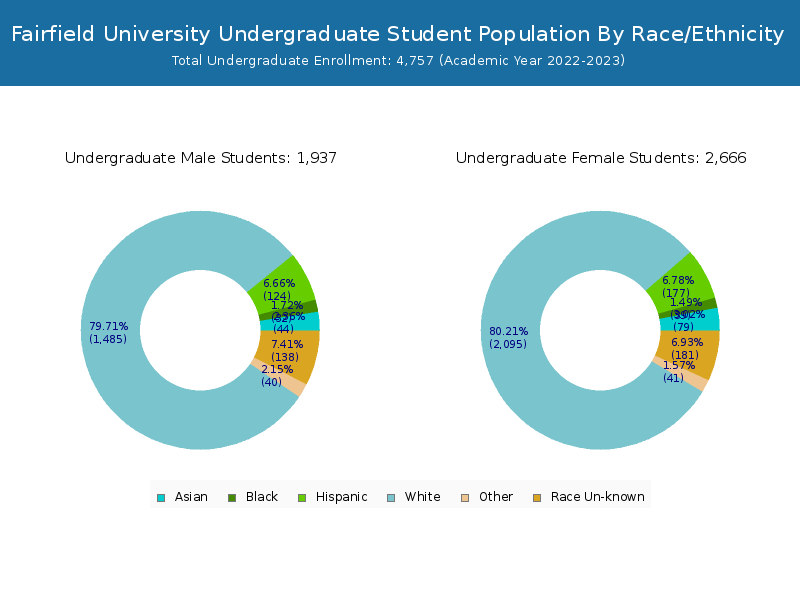
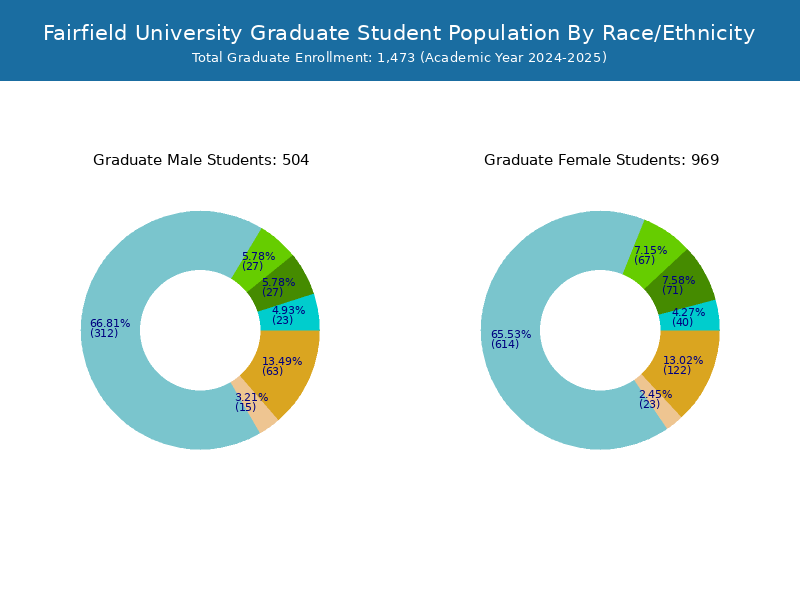
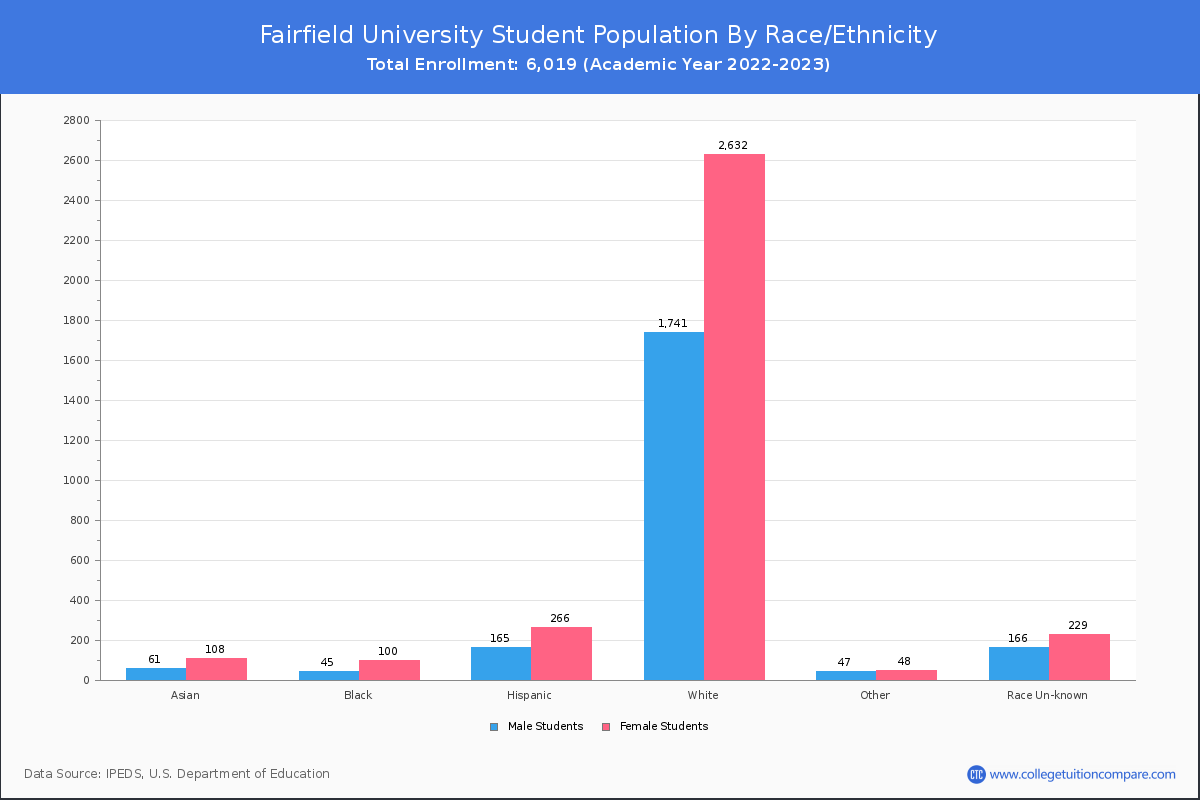
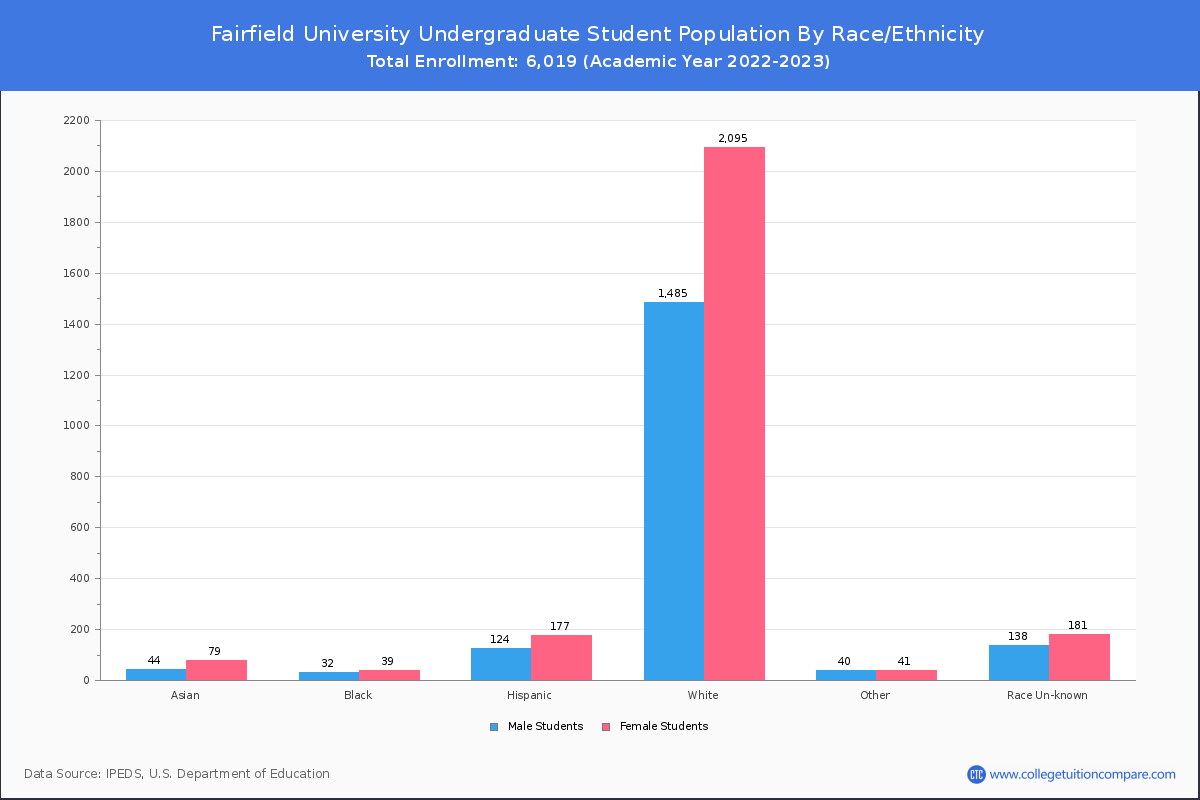
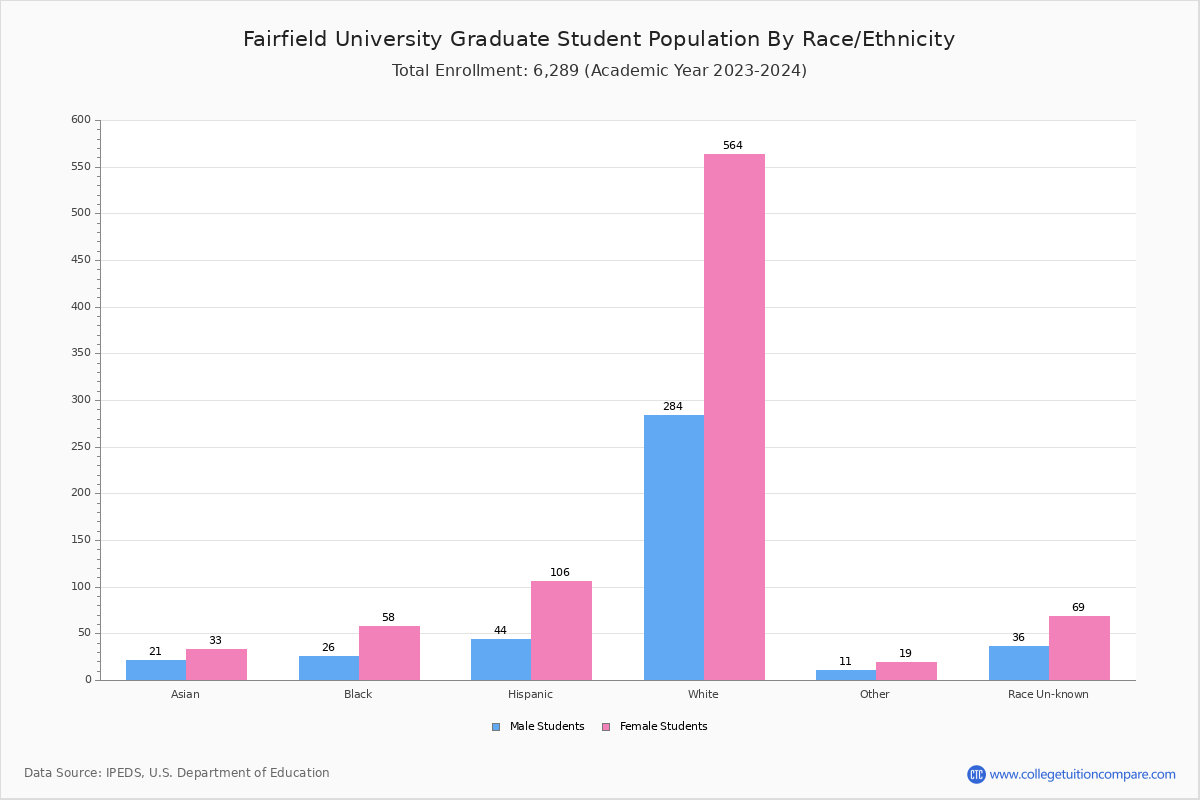
Student Distribution by Race/Ethnicity
By race/ethnicity, 4,637 White, 128 Black, and 141 Asian students out of a total of 6,019 are attending at Fairfield University. Comprehensive enrollment statistic data by race/ethnicity is shown in the next chart (Academic year 2022-2023 data).
| Race | Total | Men | Women |
|---|---|---|---|
| American Indian or Native American | 2 | 1 | 1 |
| Asian | 141 | 52 | 89 |
| Black | 128 | 41 | 87 |
| Hispanic | 448 | 176 | 272 |
| Native Hawaiian or Other Pacific Islanders | 1 | 1 | 0 |
| White | 4,637 | 1,871 | 2,766 |
| Two or more races | 110 | 52 | 58 |
| Race Unknown | 397 | 180 | 217 |
| Race | Total | Men | Women |
|---|---|---|---|
| American Indian or Native American | 2 | 1 | 1 |
| Asian | 99 | 32 | 67 |
| Black | 54 | 22 | 32 |
| Hispanic | 313 | 128 | 185 |
| Native Hawaiian or Other Pacific Islanders | 1 | 1 | 0 |
| White | 3,816 | 1,596 | 2,220 |
| Two or more races | 89 | 45 | 44 |
| Race Unknown | 283 | 140 | 143 |
| Race | Total | Men | Women |
|---|---|---|---|
| American Indian or Native American | 0 | 0 | 0 |
| Asian | 0 | 0 | 0 |
| Black | 0 | 0 | 0 |
| Hispanic | 1 | 1 | 0 |
| Native Hawaiian or Other Pacific Islanders | 0 | 0 | 0 |
| White | 8 | 3 | 5 |
| Two or more races | 0 | 0 | 0 |
| Race Unknown | 10 | 9 | 1 |
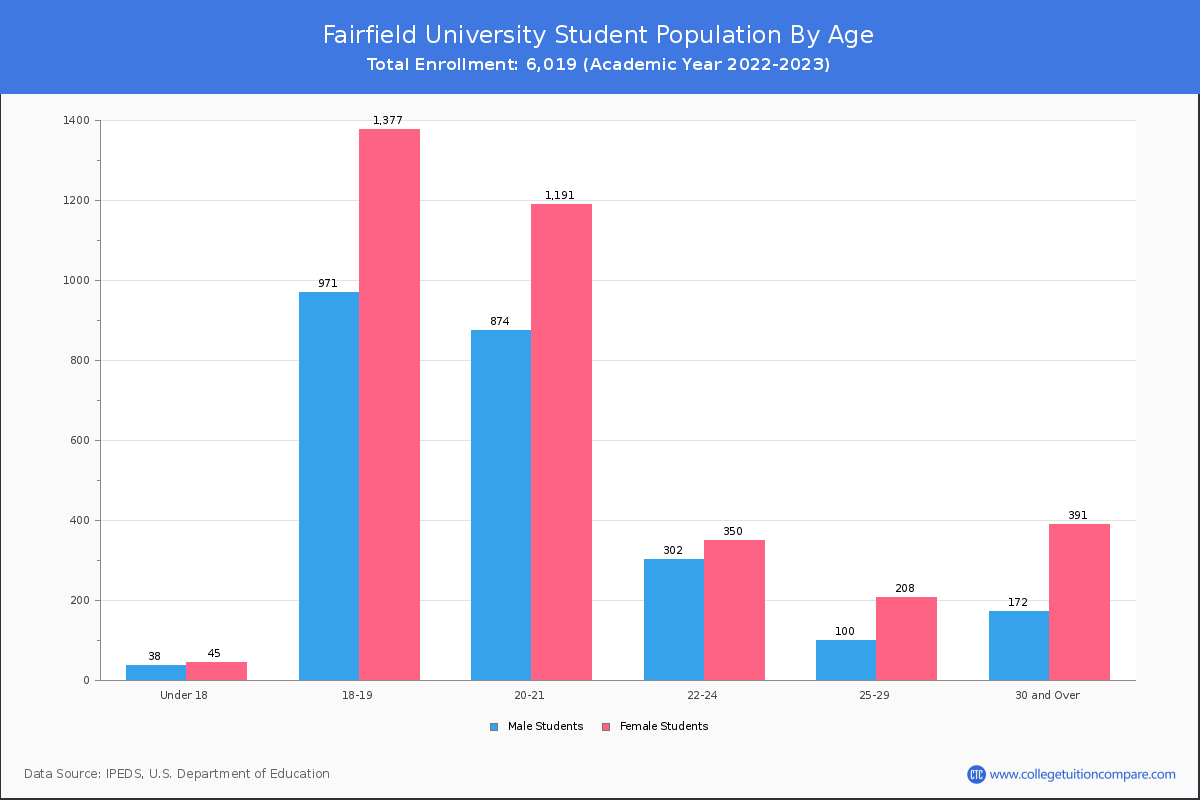
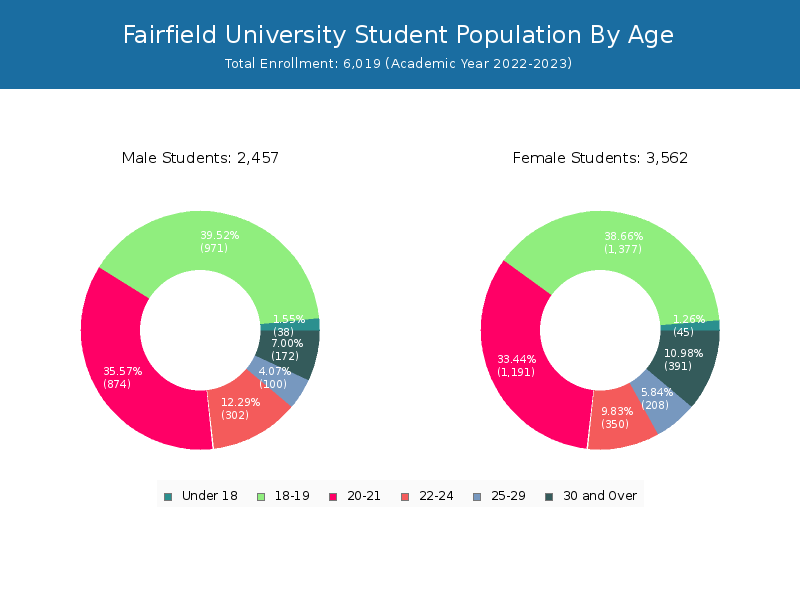
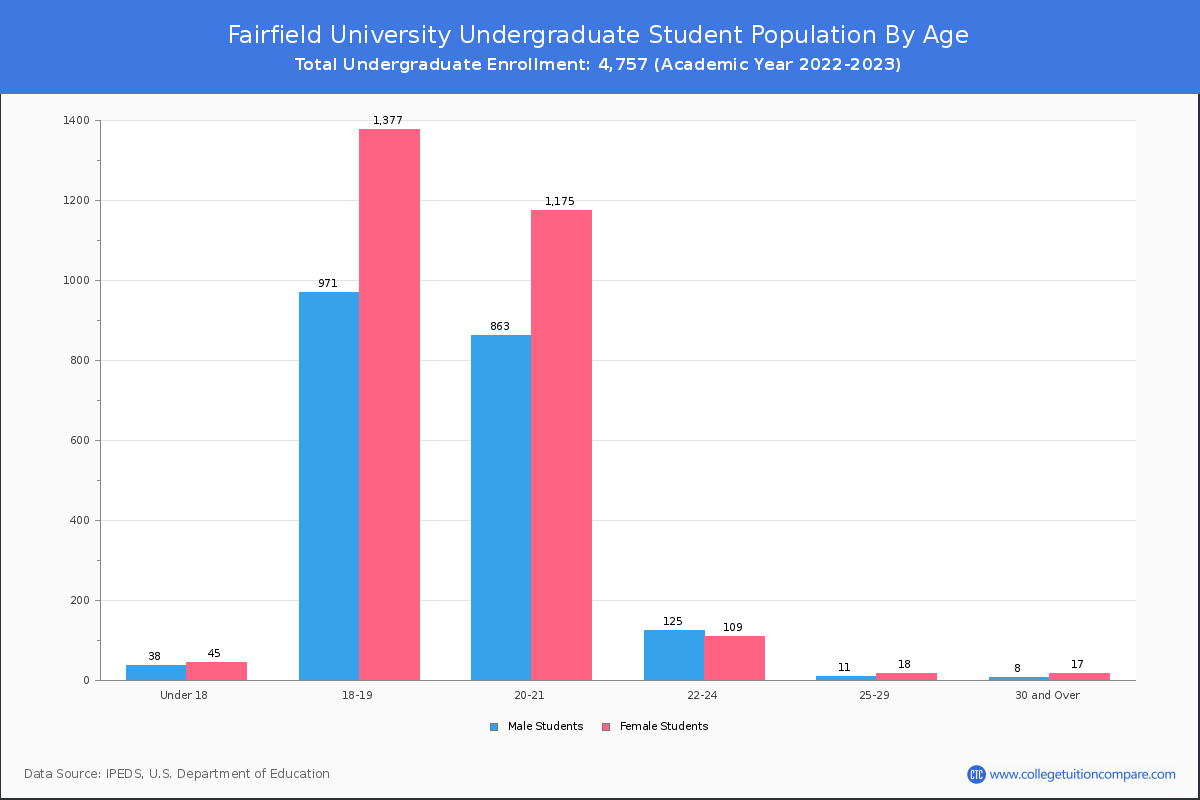
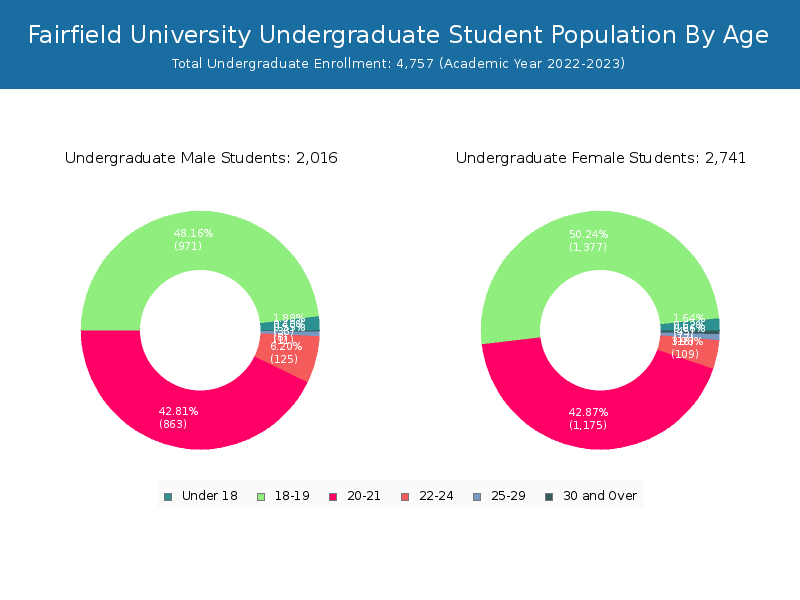
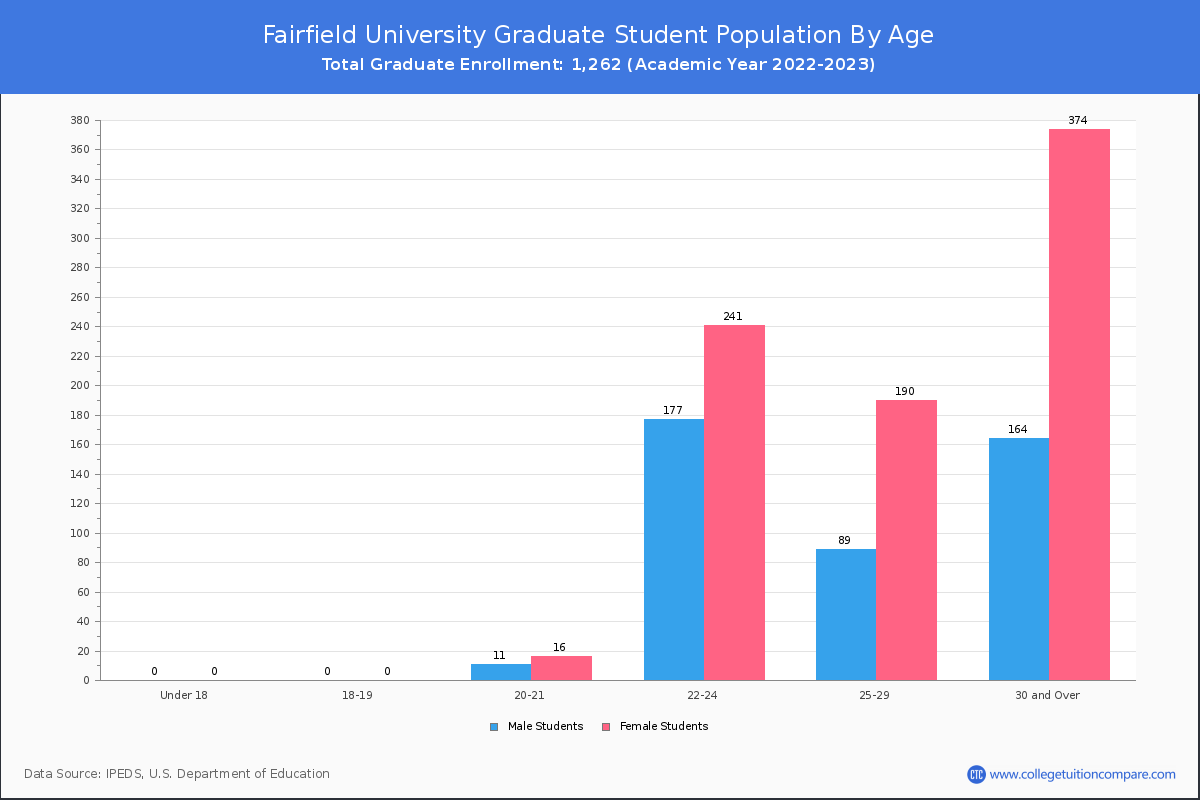
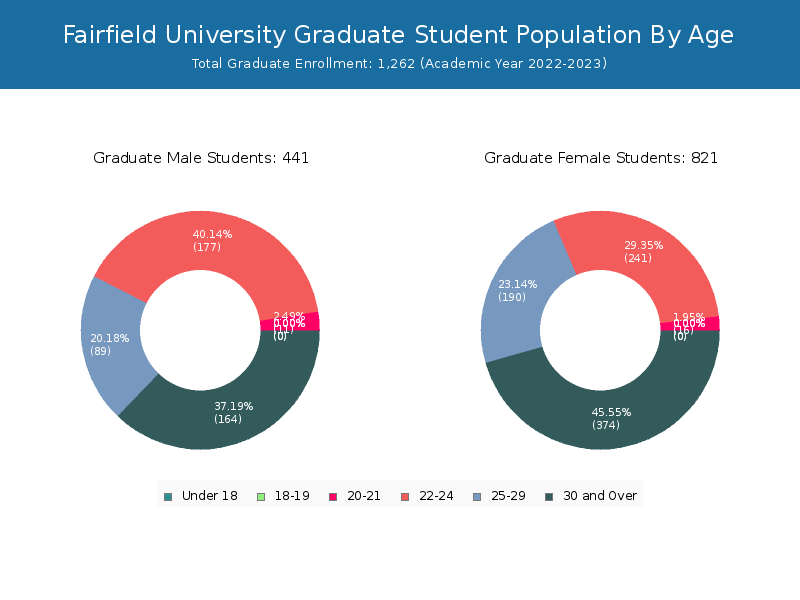
Student Age Distribution
By age, Fairfield has 83 students under 18 years old and 12 students over 65 years old. There are 5,148 students under 25 years old, and 871 students over 25 years old out of 6,019 total students.
In undergraduate programs, 83 students are younger than 18 and 2 students are older than 65. Fairfield has 4,703 undergraduate students aged under 25 and 54 students aged 25 and over.
It has 445 graduate students aged under 25 and 817 students aged 25 and over.
| Age | Total | Men | Women |
|---|---|---|---|
| Under 18 | 83 | 45 | 38 |
| 18-19 | 2,348 | 1,377 | 971 |
| 20-21 | 2,065 | 1,191 | 874 |
| 22-24 | 652 | 350 | 302 |
| 25-29 | 308 | 208 | 100 |
| 30-34 | 183 | 108 | 75 |
| 35-39 | 108 | 76 | 32 |
| 40-49 | 162 | 117 | 45 |
| 50-64 | 98 | 83 | 15 |
| Over 65 | 12 | 7 | 5 |
| Age | Total | Men | Women |
|---|---|---|---|
| Under 18 | 83 | 45 | 38 |
| 18-19 | 2,348 | 1,377 | 971 |
| 20-21 | 2,038 | 1,175 | 863 |
| 22-24 | 234 | 109 | 125 |
| 25-29 | 29 | 18 | 11 |
| 30-34 | 9 | 6 | 3 |
| 35-39 | 1 | 1 | 0 |
| 40-49 | 8 | 4 | 4 |
| 50-64 | 5 | 5 | 0 |
| Over 65 | 2 | 1 | 1 |
| Age | Total | Men | Women |
|---|
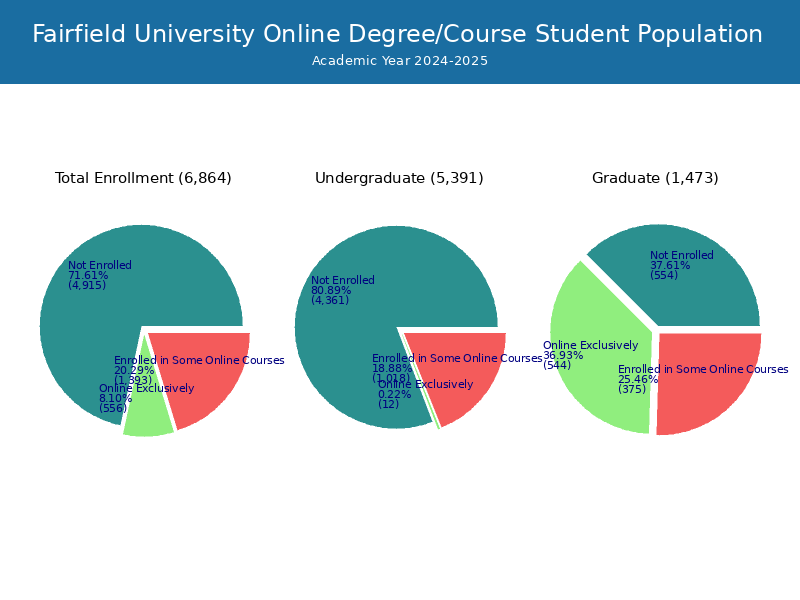
Online Student Enrollment
Distance learning, also called online education, is very attractive to students, especially who want to continue education and work in field. At Fairfield University, 176 students are enrolled exclusively in online courses and 1,067 students are enrolled in some online courses.
117 students lived in Connecticut or jurisdiction in which the school is located are enrolled exclusively in online courses and 59 students live in other State or outside of the United States.
| All Students | Enrolled Exclusively Online Courses | Enrolled in Some Online Courses | |
|---|---|---|---|
| All Students | 6,019 | 176 | 1,067 |
| Undergraduate | 4,757 | 14 | 846 |
| Graduate | 1,262 | 162 | 221 |
| Connecticut Residents | Other States in U.S. | Outside of U.S. | |
|---|---|---|---|
| All Students | 117 | 57 | 2 |
| Undergraduate | 12 | - | 2 |
| Graduate | 105 | 57 | 0 |
Transfer-in Students (Undergraduate)
Among 4,757 enrolled in undergraduate programs, 23 students have transferred-in from other institutions. The percentage of transfer-in students is 0.48%.
| Number of Students | |
|---|---|
| Regular Full-time | 4,632 |
| Transfer-in Full-time | 23 |