Student Population by Gender
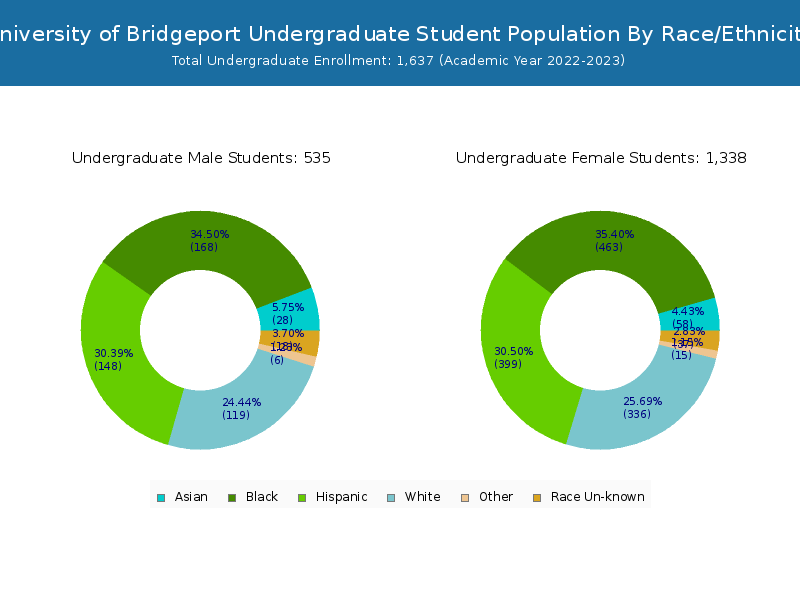
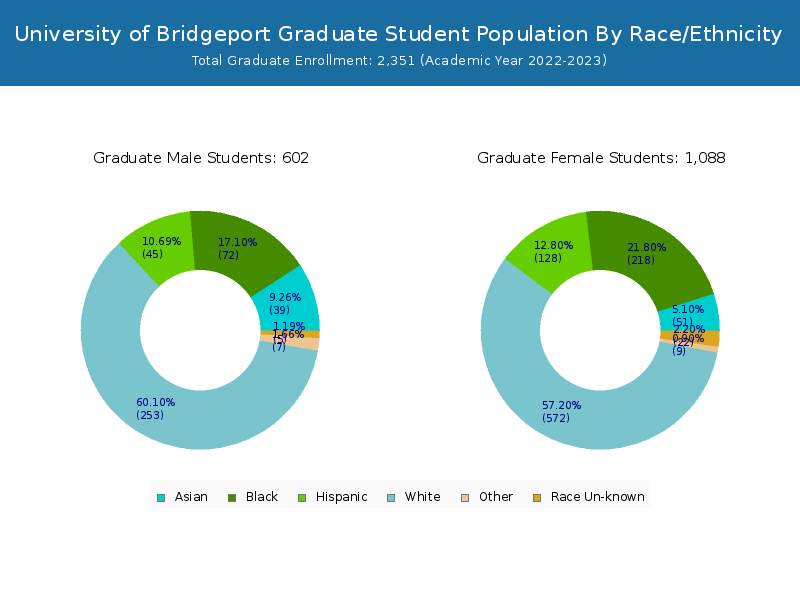
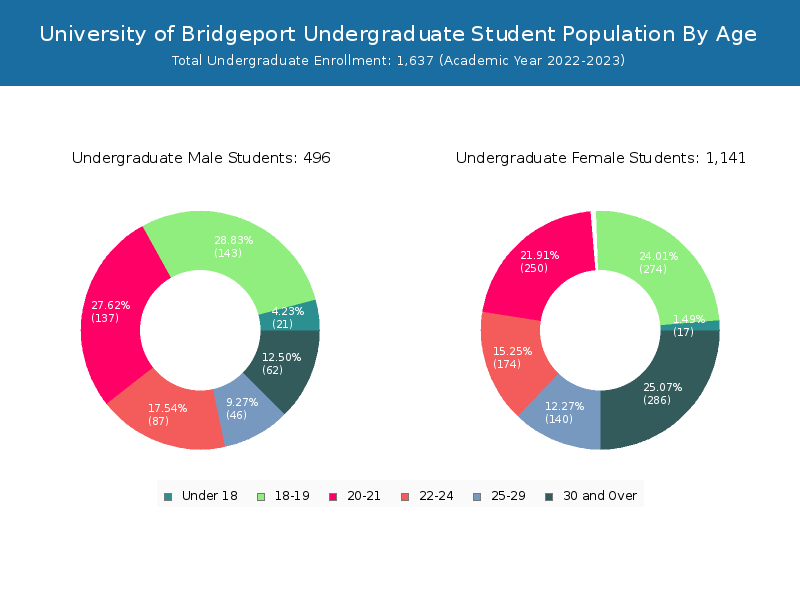
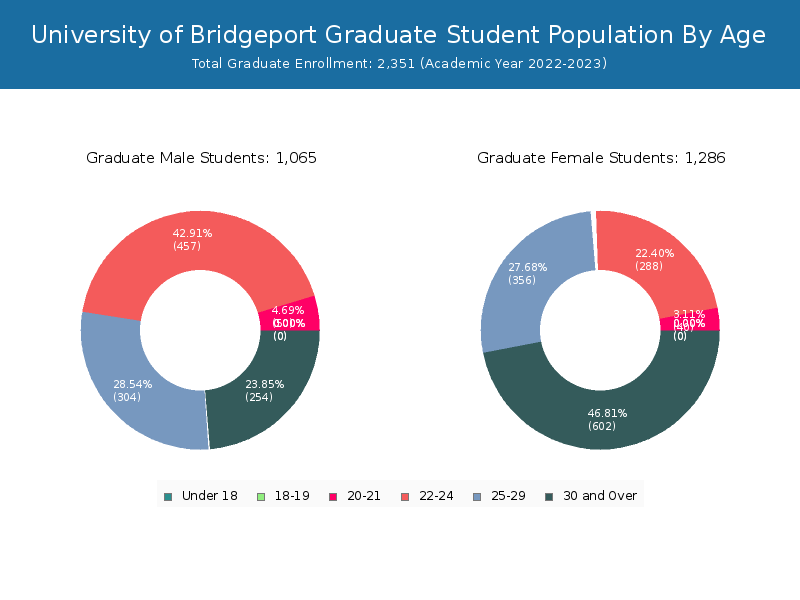
University of Bridgeport has a total of 3,988 enrolled students for the academic year 2022-2023. 1,637 students have enrolled in undergraduate programs and 2,351 students joined graduate programs.
By gender, 1,561 male and 2,427 female students (the male-female ratio is 39:61) are attending the school. The gender distribution is based on the 2022-2023 data.
| Total | Undergraduate | Graduate | |
|---|---|---|---|
| Total | 3,988 | 1,637 | 2,351 |
| Men | 1,561 | 496 | 1,065 |
| Women | 2,427 | 1,141 | 1,286 |
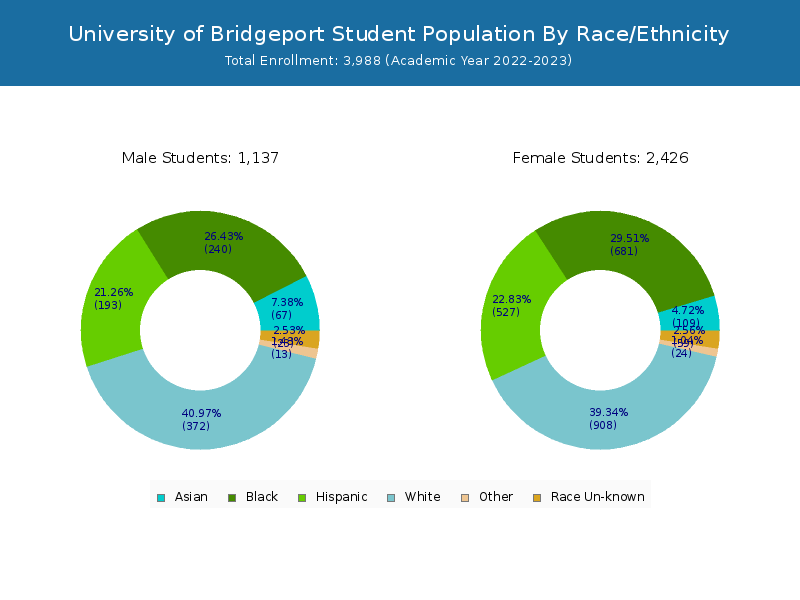
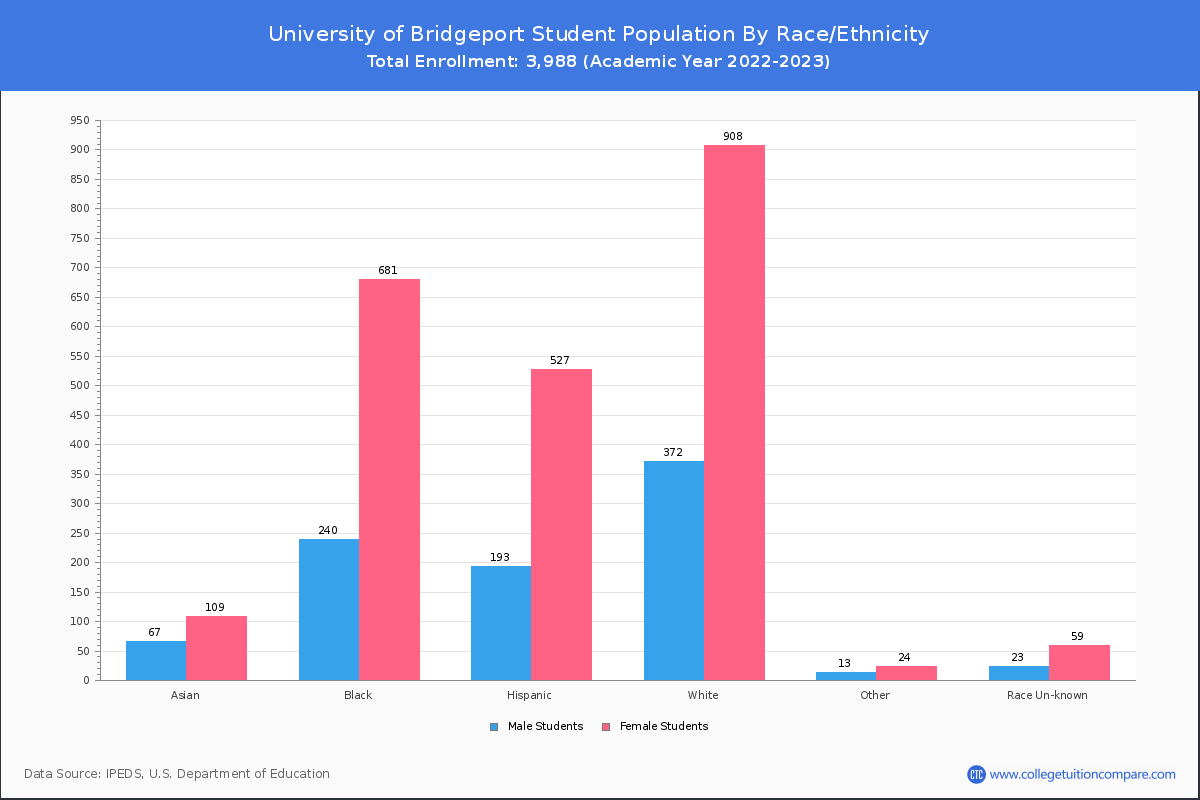
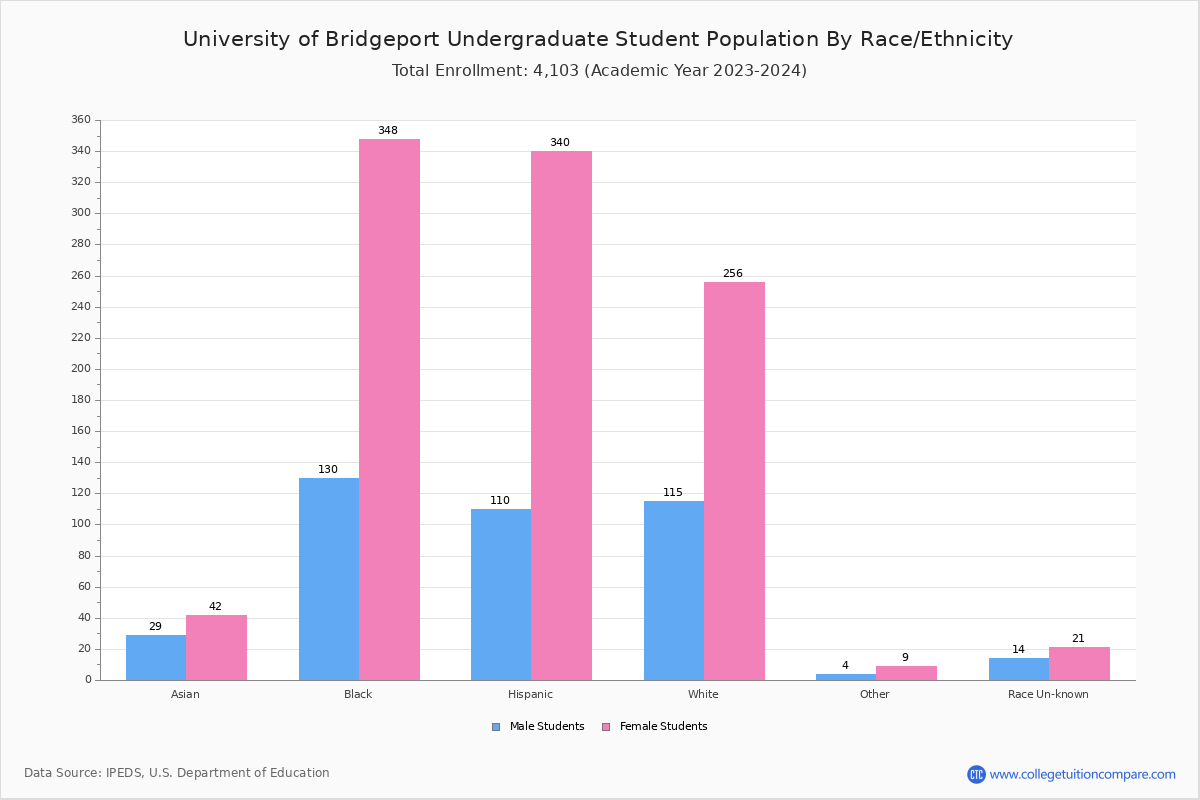
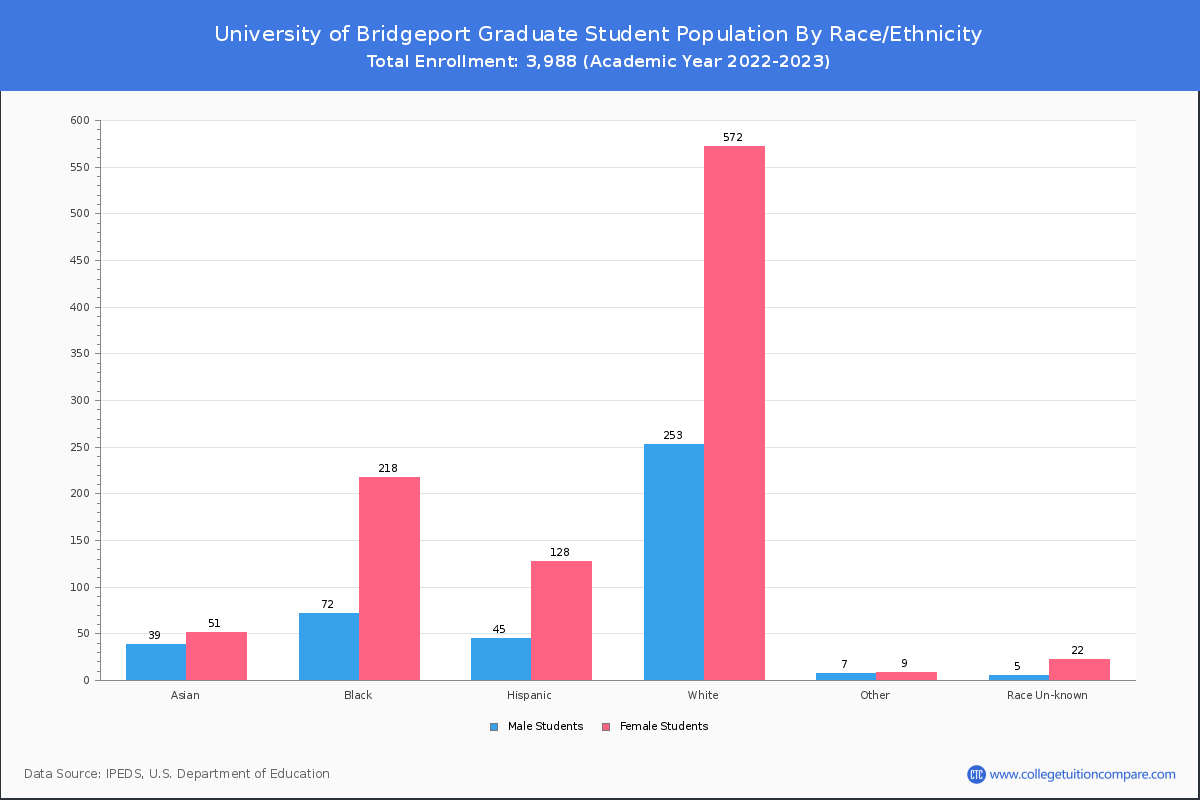
Student Distribution by Race/Ethnicity
By race/ethnicity, 1,091 White, 871 Black, and 143 Asian students out of a total of 3,988 are attending at University of Bridgeport. Comprehensive enrollment statistic data by race/ethnicity is shown in the next chart (Academic year 2022-2023 data).
| Race | Total | Men | Women |
|---|---|---|---|
| American Indian or Native American | 21 | 6 | 15 |
| Asian | 143 | 56 | 87 |
| Black | 871 | 221 | 650 |
| Hispanic | 661 | 161 | 500 |
| Native Hawaiian or Other Pacific Islanders | 0 | 0 | 0 |
| White | 1,091 | 329 | 762 |
| Two or more races | 26 | 12 | 14 |
| Race Unknown | 106 | 35 | 71 |
| Race | Total | Men | Women |
|---|---|---|---|
| American Indian or Native American | 11 | 3 | 8 |
| Asian | 65 | 24 | 41 |
| Black | 559 | 149 | 410 |
| Hispanic | 480 | 122 | 358 |
| Native Hawaiian or Other Pacific Islanders | 0 | 0 | 0 |
| White | 377 | 119 | 258 |
| Two or more races | 20 | 8 | 12 |
| Race Unknown | 54 | 26 | 28 |
| Race | Total | Men | Women |
|---|---|---|---|
| American Indian or Native American | 1 | 0 | 1 |
| Asian | 4 | 1 | 3 |
| Black | 60 | 13 | 47 |
| Hispanic | 49 | 7 | 42 |
| Native Hawaiian or Other Pacific Islanders | 0 | 0 | 0 |
| White | 43 | 9 | 34 |
| Two or more races | 2 | 0 | 2 |
| Race Unknown | 4 | 2 | 2 |
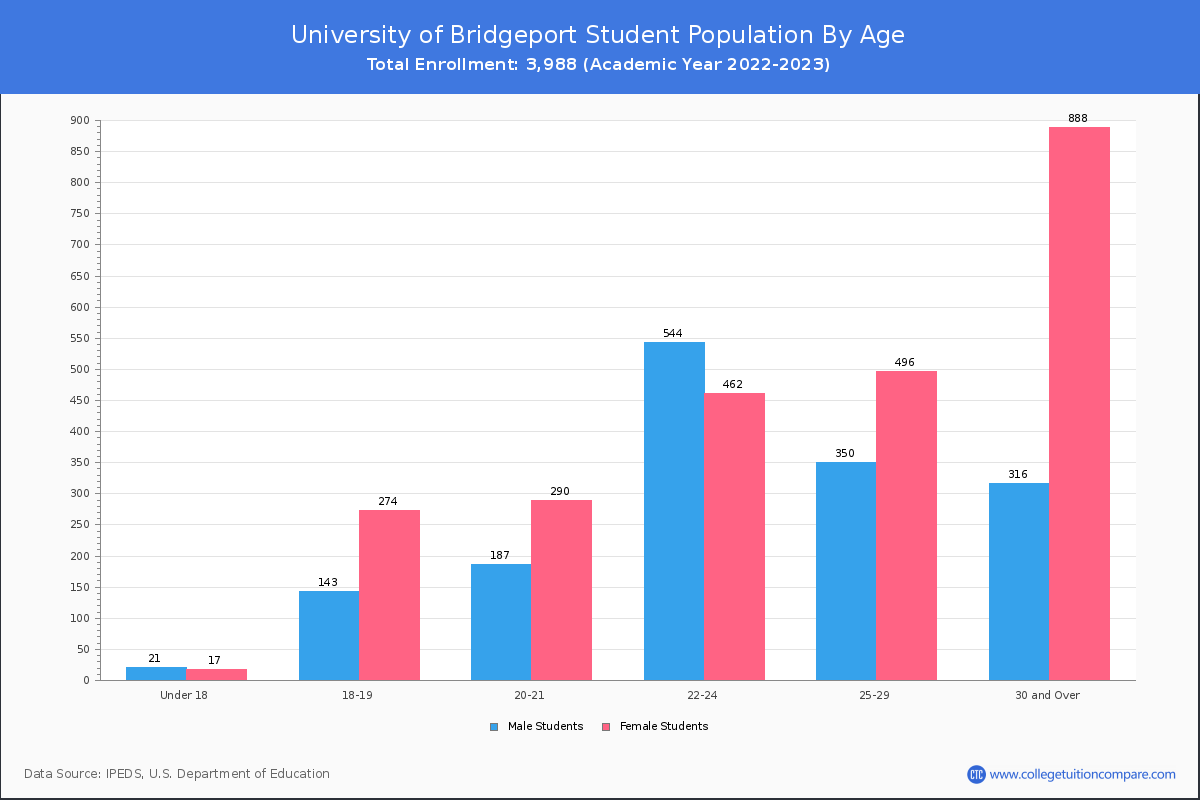
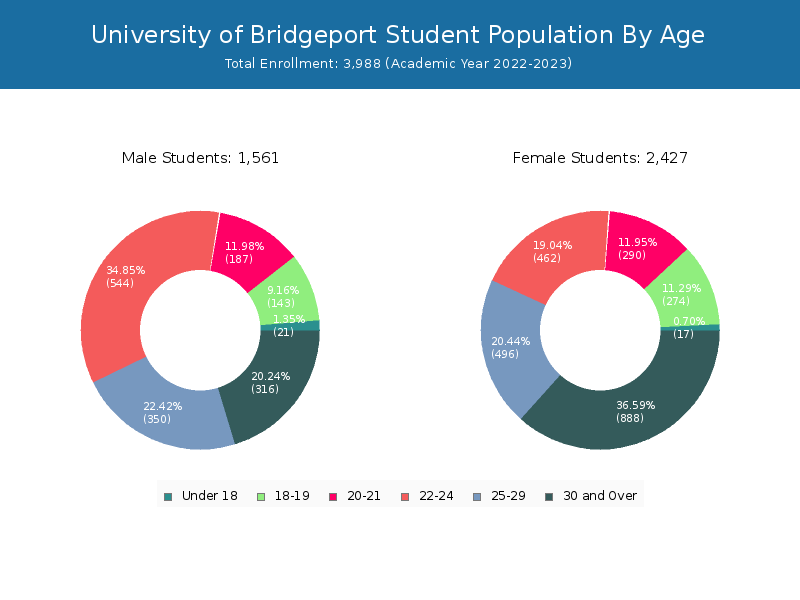
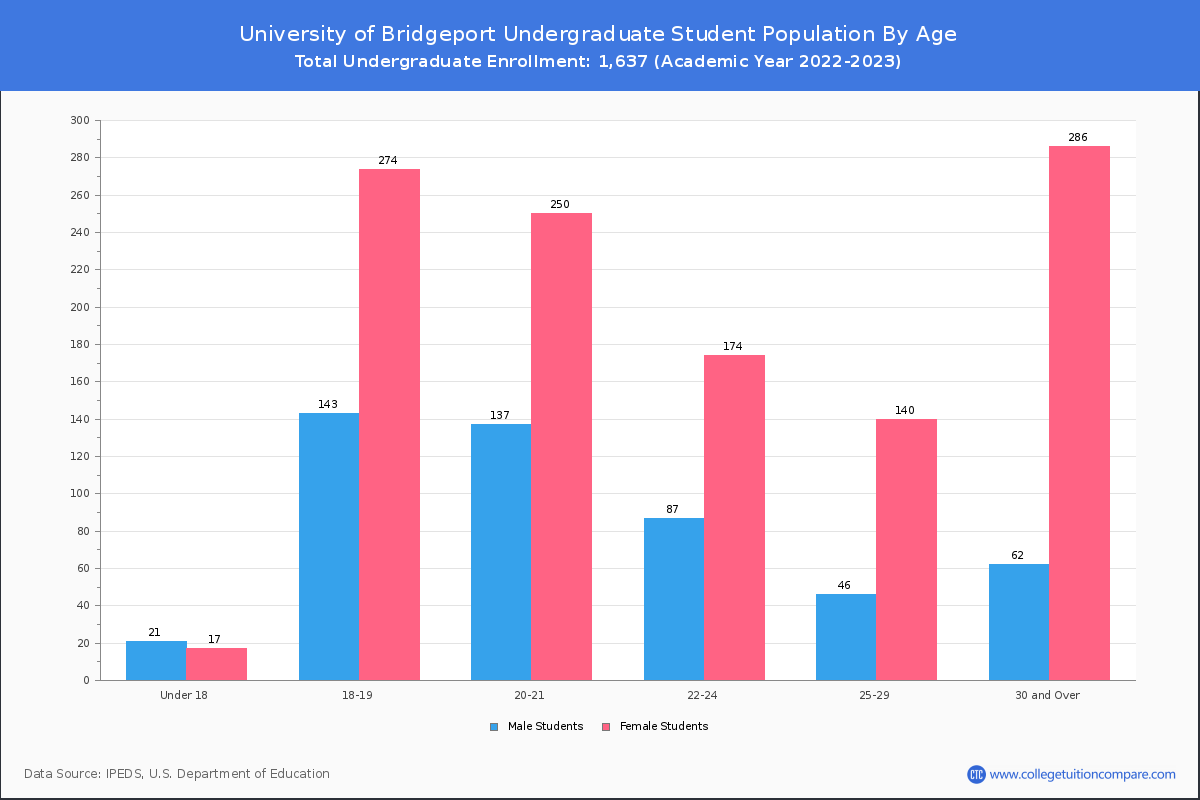
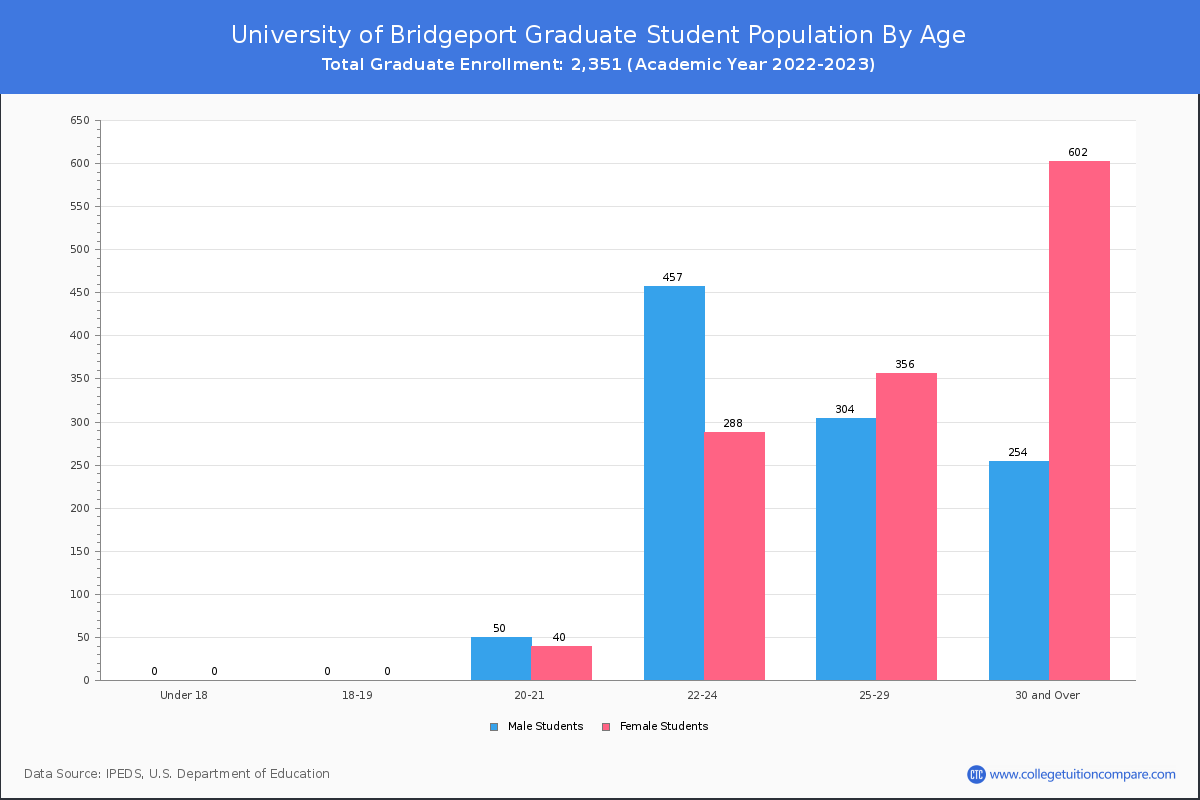
Student Age Distribution
By age, U of Bridgeport has 38 students under 18 years old and 13 students over 65 years old. There are 1,938 students under 25 years old, and 2,050 students over 25 years old out of 3,988 total students.
In undergraduate programs, 38 students are younger than 18 and 2 students are older than 65. U of Bridgeport has 1,103 undergraduate students aged under 25 and 534 students aged 25 and over.
It has 835 graduate students aged under 25 and 1,516 students aged 25 and over.
| Age | Total | Men | Women |
|---|---|---|---|
| Under 18 | 38 | 17 | 21 |
| 18-19 | 417 | 274 | 143 |
| 20-21 | 477 | 290 | 187 |
| 22-24 | 1,006 | 462 | 544 |
| 25-29 | 846 | 496 | 350 |
| 30-34 | 356 | 238 | 118 |
| 35-39 | 287 | 213 | 74 |
| 40-49 | 353 | 285 | 68 |
| 50-64 | 195 | 142 | 53 |
| Over 65 | 13 | 10 | 3 |
| Age | Total | Men | Women |
|---|---|---|---|
| Under 18 | 38 | 17 | 21 |
| 18-19 | 417 | 274 | 143 |
| 20-21 | 387 | 250 | 137 |
| 22-24 | 261 | 174 | 87 |
| 25-29 | 186 | 140 | 46 |
| 30-34 | 107 | 85 | 22 |
| 35-39 | 95 | 77 | 18 |
| 40-49 | 99 | 87 | 12 |
| 50-64 | 45 | 35 | 10 |
| Over 65 | 2 | 2 | 0 |
| Age | Total | Men | Women |
|---|
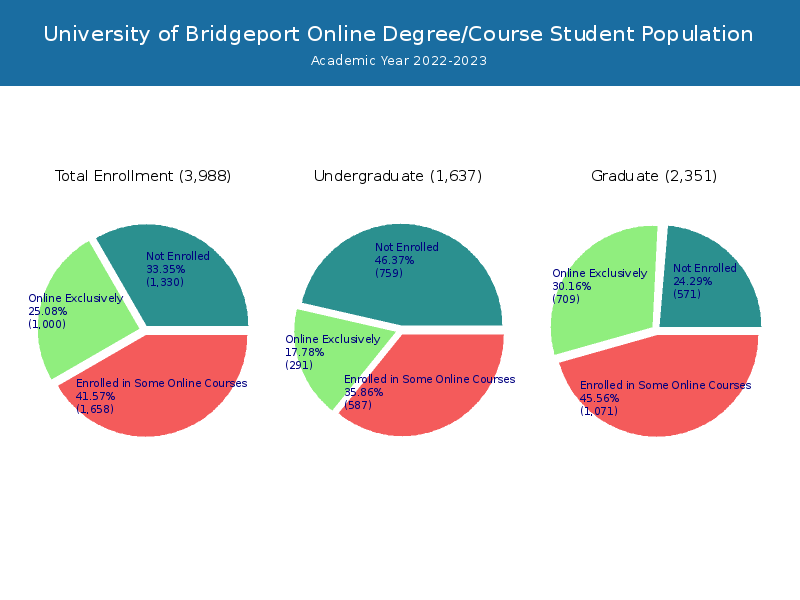
Online Student Enrollment
Distance learning, also called online education, is very attractive to students, especially who want to continue education and work in field. At University of Bridgeport, 1,000 students are enrolled exclusively in online courses and 1,658 students are enrolled in some online courses.
595 students lived in Connecticut or jurisdiction in which the school is located are enrolled exclusively in online courses and 405 students live in other State or outside of the United States.
| All Students | Enrolled Exclusively Online Courses | Enrolled in Some Online Courses | |
|---|---|---|---|
| All Students | 3,988 | 1,000 | 1,658 |
| Undergraduate | 1,637 | 291 | 587 |
| Graduate | 2,351 | 709 | 1,071 |
| Connecticut Residents | Other States in U.S. | Outside of U.S. | |
|---|---|---|---|
| All Students | 595 | 405 | 0 |
| Undergraduate | 238 | 53 | 0 |
| Graduate | 357 | 352 | 0 |
Transfer-in Students (Undergraduate)
Among 1,637 enrolled in undergraduate programs, 171 students have transferred-in from other institutions. The percentage of transfer-in students is 10.45%.139 students have transferred in as full-time status and 32 students transferred in as part-time status.
| Number of Students | |
|---|---|
| Regular Full-time | 1,200 |
| Transfer-in Full-time | 139 |
| Regular Part-time | 266 |
| Transfer-in Part-time | 32 |