Admission Statistics
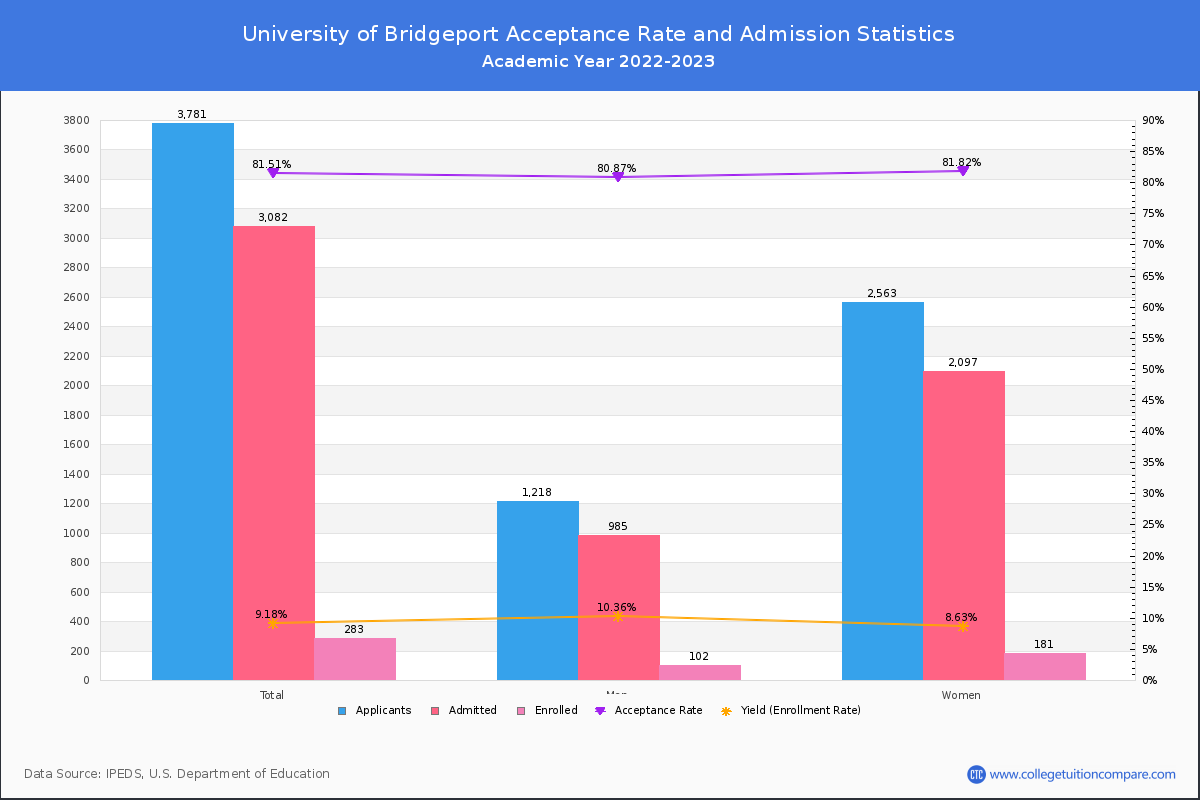
For the academic year 2022-23, the acceptance rate of University of Bridgeport is 81.51% and the yield (also known as enrollment rate) is 9.18%. 1,218 men and 2,563 women applied to U of Bridgeport and 985 men and 2,097 women students were accepted.
Among them, 102 men and 181 women were enrolled in the school (Fall 2022).
The following table and chart show the admission statistics including the number of applicants, acceptance rate, and yield at U of Bridgeport.
| Total | Men | Women | Another Gender | Gender Unknown | |
|---|---|---|---|---|---|
| Applicants | 3,781 | 1,218 | 2,563 | 0 | 0 |
| Admitted | 3,082 | 985 | 2,097 | 0 | 0 |
| Enrolled | 283 | 102 | 181 | 0 | 0 |
| Acceptance Rate | 81.51% | 80.87% | 81.82% | - | - |
| Yield | 9.18% | 10.36% | 8.63% | - | - |
Data source: IPEDS (Integrated Postsecondary Education Data System) (Last update: December 11, 2023)
SAT and ACT Score Distribution
In 2023, 20 students (14% of enrolled) have submitted their SAT scores
The median SAT score is 1,090 with 540 SAT EBRW and 550 SAT Math median scores. The 75th percentile SAT score of EBRW (Evidence-Based Reading / Writing) is 590 and the 25th percentile is 460. The SAT Math 75th percentile score is 570 and 25th percentile is 475 .
| 25th Percentile | 50th Percentile (Median) | 75th Percentile | |
|---|---|---|---|
| SAT Total | 935 | 1090 | 1160 |
| SAT Evidence-Based Reading and Writing | 460 | 540 | 590 |
| SAT Math | 475 | 550 | 570 |
| ACT Composite | 0 | 0 | 0 |
| ACT Math | 0 | 0 | 0 |
| ACT English | 0 | 0 | 0 |
Data source: IPEDS (Integrated Postsecondary Education Data System) (Last update: December 11, 2023)
First-year Enrollment by Gender and Enrolled Type
For the academic year 2022-23, total 283 first-year students enrolled in U of Bridgeport. The proportion of full-time students is 98.94% and part-time students is 1.06%.
By gender, the proportion of men students is 36.04% and women students is 63.96%.
The following table and chart visualize the first-year students by gender and enrolled type at U of Bridgeport.
| Total | Men | Women | Another Gender | Gender Unknown | |
|---|---|---|---|---|---|
| Total | 283 | 102 | 181 | 0 | 0 |
| Full-time | 280 | 102 | 178 | 0 | 0 |
| Part-time | 3 | 0 | 3 | 0 | 0 |
Data source: IPEDS (Integrated Postsecondary Education Data System) (Last update: December 11, 2023)
Application Requirements
It requires to submit High School GPA, High School Record (or Transcript), and English Proficiency Test to its applicants.
The SAT and ACT test score is not reqired, but considered in admission process at U of Bridgeport. The english proficiency test is reqired .
The next table summarizes the application requirements to apply University of Bridgeport.
For more admission information such as minimum GPA and deadlines, see its online application page .
| High School GPA | Required |
|---|---|
| High School Rank | Not Considered |
| High School Record (or Transcript) | Required |
| Completion of College Preparatory Program | Not Considered |
| Recommendations | Considered, if submitted |
| Formal Demonstration of Competencies | Not Considered |
| SAT / ACT | Considered, if submitted |
| English Proficiency Test | Required |
| Other Test (Wonderlic,WISC-III,etc) | Not Considered |
| Work experience | Not Considered |
| Personal statement or essay | Considered, if submitted |
| Legacy status | Considered, if submitted |
General Admissions Information
The next table provides general admission information for applying to U of Bridgeport.
| Open Admission Policy | No |
|---|---|
| Admission Information | www.bridgeport.edu/admissions |
| Online Application | www.bridgeport.edu/admissions/undergraduate-students/applying-ub |
| Calendar System | Semester |
| Credits Accepted | Dual Credits, Credits for Life Experiences, Advanced placement (AP) Credits |
| Degree Offered | 1-Year Certificate, Associate, Bachelor, Post-Bachelor Certificate, Master, Post-Master Certificate, Doctoral (Research), Doctoral (Professional Practice) |