Student Population by Gender
South Coast College has a total of 237 enrolled students for the academic year 2022-2023. All 237 students are enrolled into undergraduate programs.
By gender, 19 male and 218 female students (the male-female ratio is 8:92) are attending the school. The gender distribution is based on the 2022-2023 data.
| Undergraduate | |
|---|---|
| Total | 237 |
| Men | 19 |
| Women | 218 |
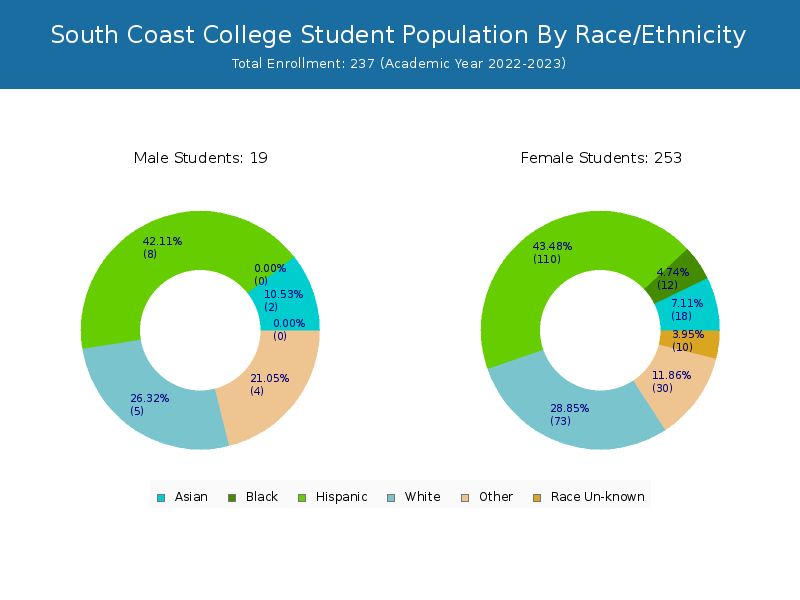
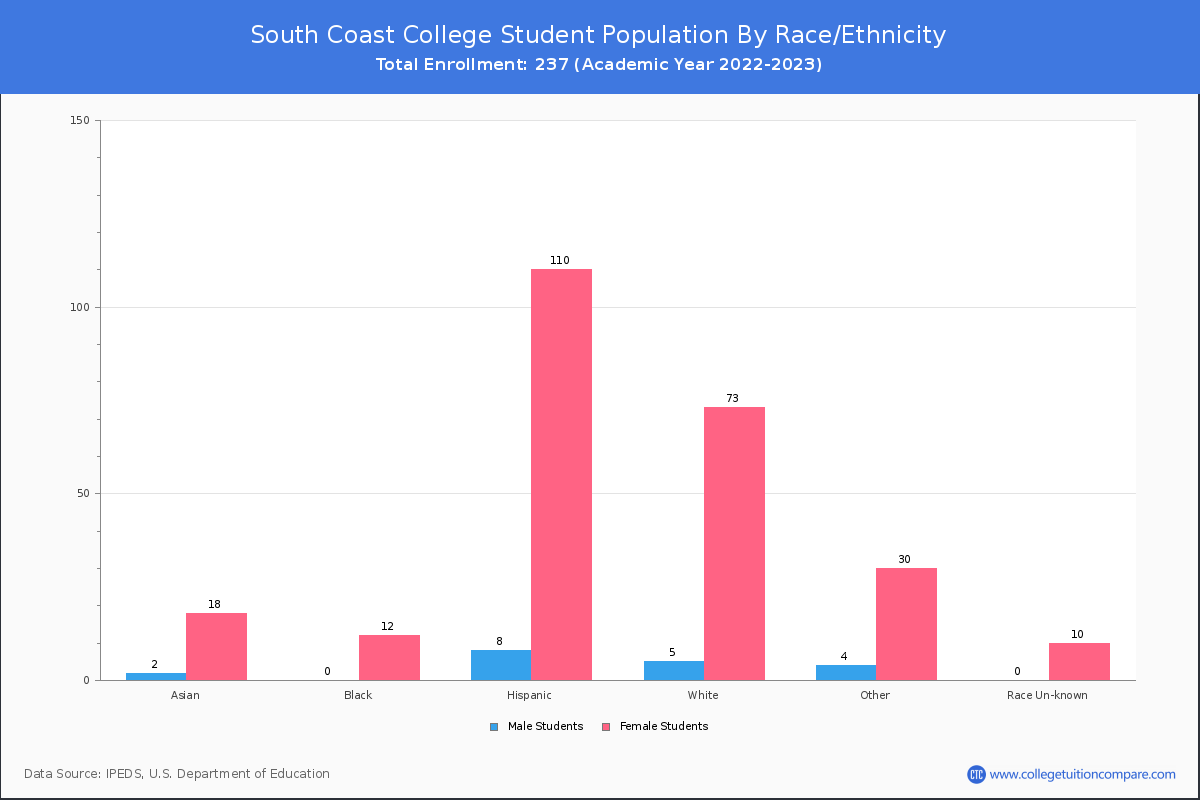
Student Distribution by Race/Ethnicity
By race/ethnicity, 70 White, 11 Black, and 15 Asian students out of a total of 237 are attending at South Coast College. Comprehensive enrollment statistic data by race/ethnicity is shown in the next chart (Academic year 2022-2023 data).
| Race | Total | Men | Women |
|---|---|---|---|
| American Indian or Native American | 3 | 1 | 2 |
| Asian | 15 | 1 | 14 |
| Black | 11 | 0 | 11 |
| Hispanic | 99 | 11 | 88 |
| Native Hawaiian or Other Pacific Islanders | 0 | 0 | 0 |
| White | 70 | 3 | 67 |
| Two or more races | 30 | 3 | 27 |
| Race Unknown | 9 | 0 | 9 |
Transfer-in Students (Undergraduate)
Among 237 enrolled in undergraduate programs, 30 students have transferred-in from other institutions. The percentage of transfer-in students is 12.66%.18 students have transferred in as full-time status and 12 students transferred in as part-time status.
| Number of Students | |
|---|---|
| Regular Full-time | 129 |
| Transfer-in Full-time | 18 |
| Regular Part-time | 78 |
| Transfer-in Part-time | 12 |