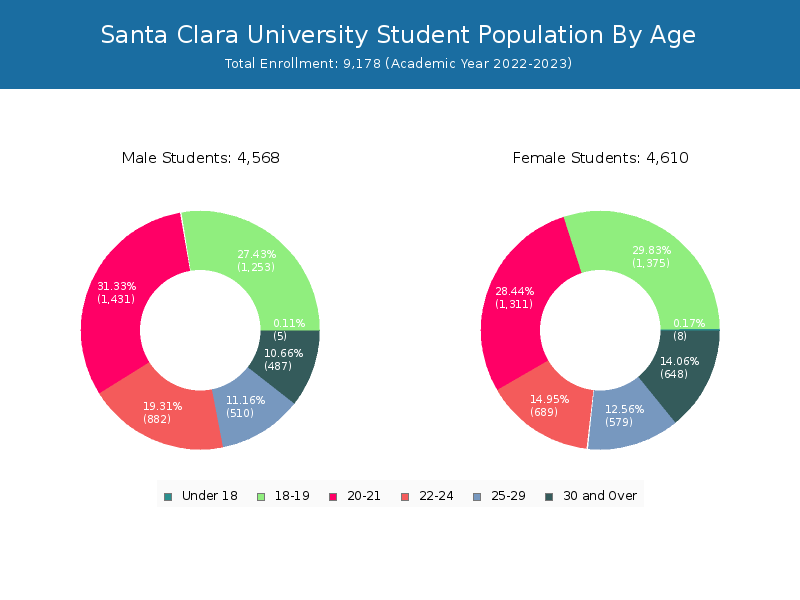
Student Population by Gender
Santa Clara University has a total of 9,178 enrolled students for the academic year 2022-2023. 6,115 students have enrolled in undergraduate programs and 3,063 students joined graduate programs.
By gender, 4,568 male and 4,610 female students (the male-female ratio is 50:50) are attending the school. The gender distribution is based on the 2022-2023 data.
| Total | Undergraduate | Graduate | |
|---|---|---|---|
| Total | 9,178 | 6,115 | 3,063 |
| Men | 4,568 | 3,160 | 1,408 |
| Women | 4,610 | 2,955 | 1,655 |
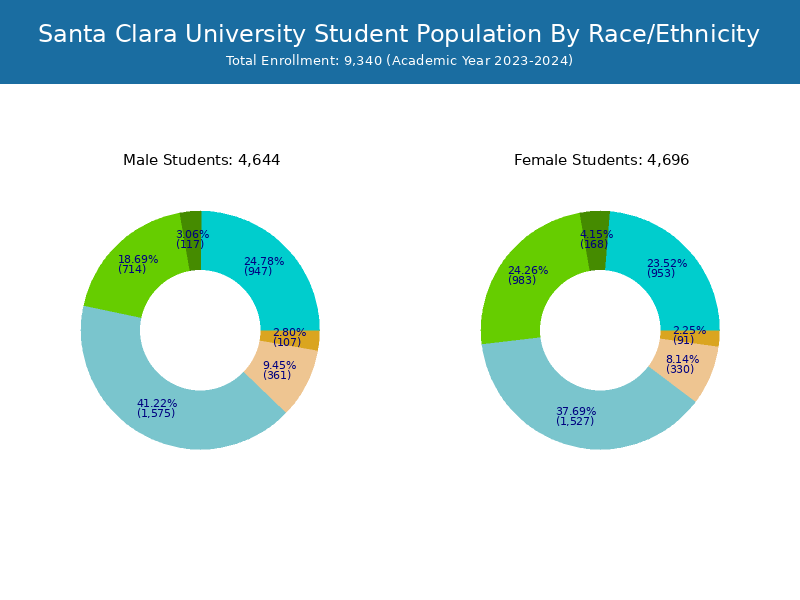
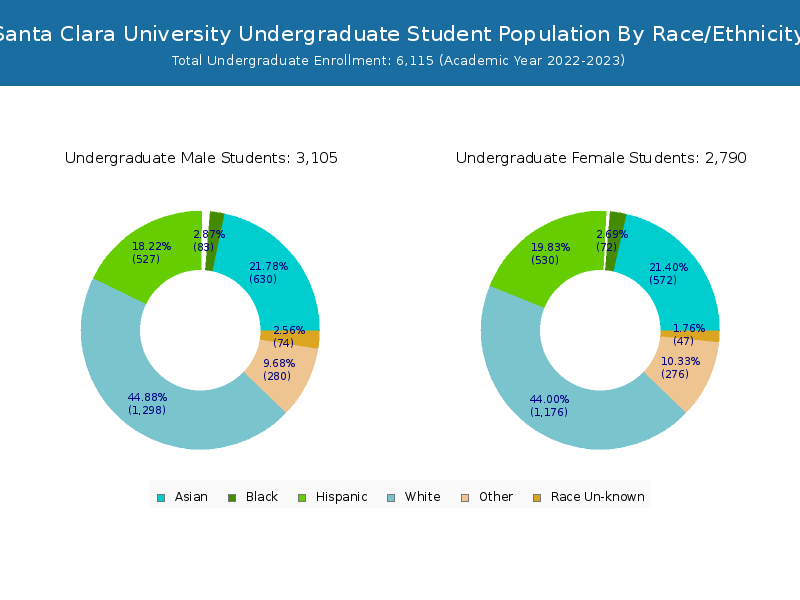
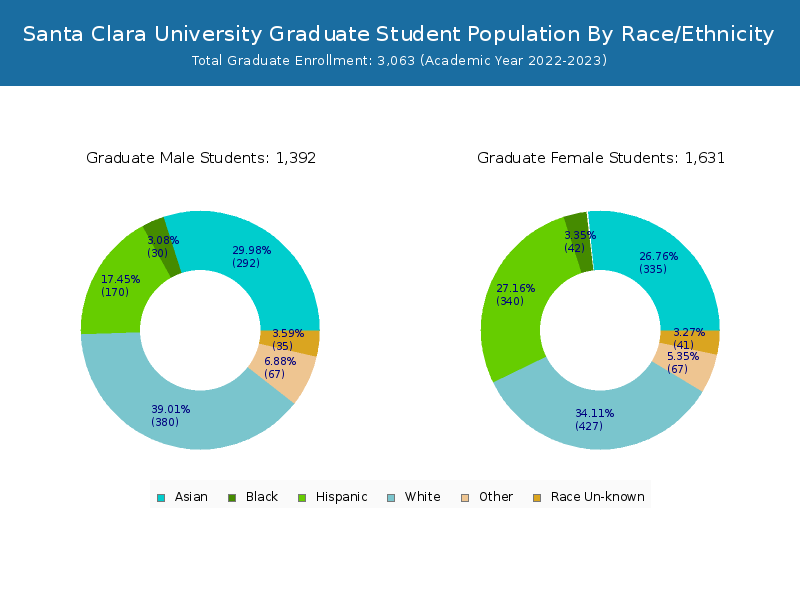
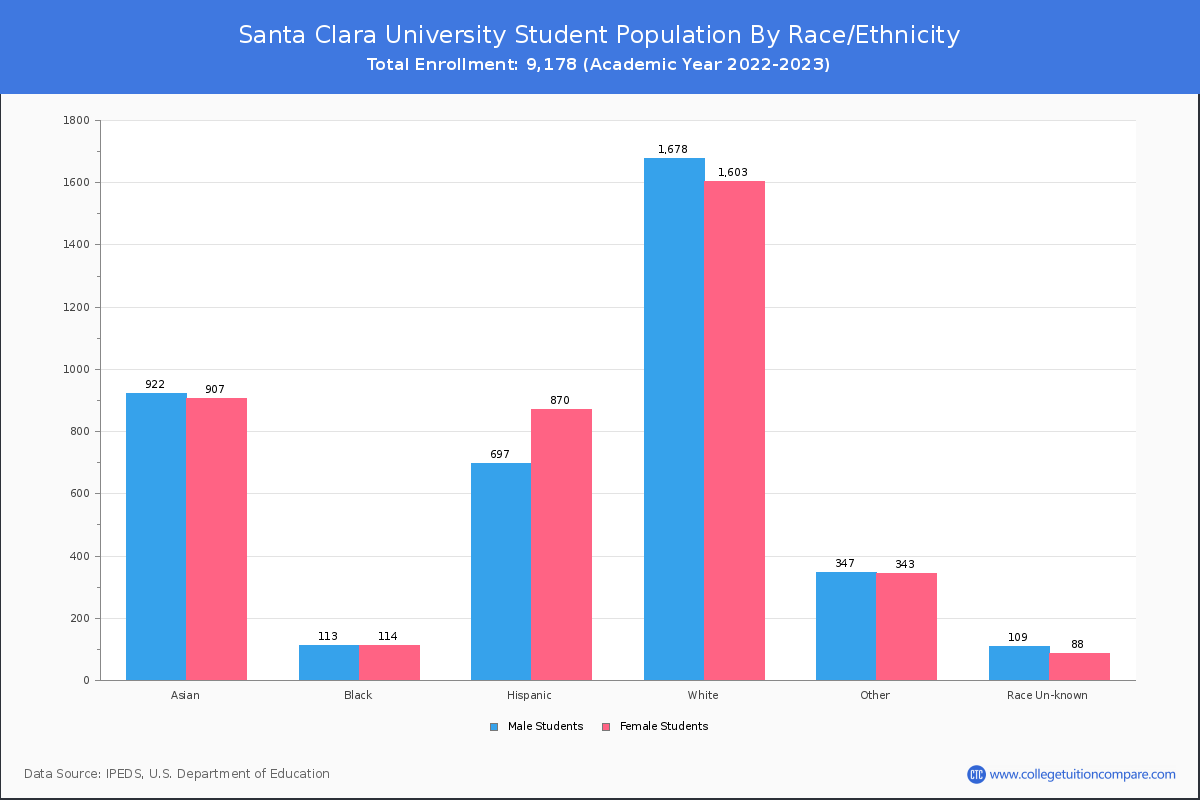
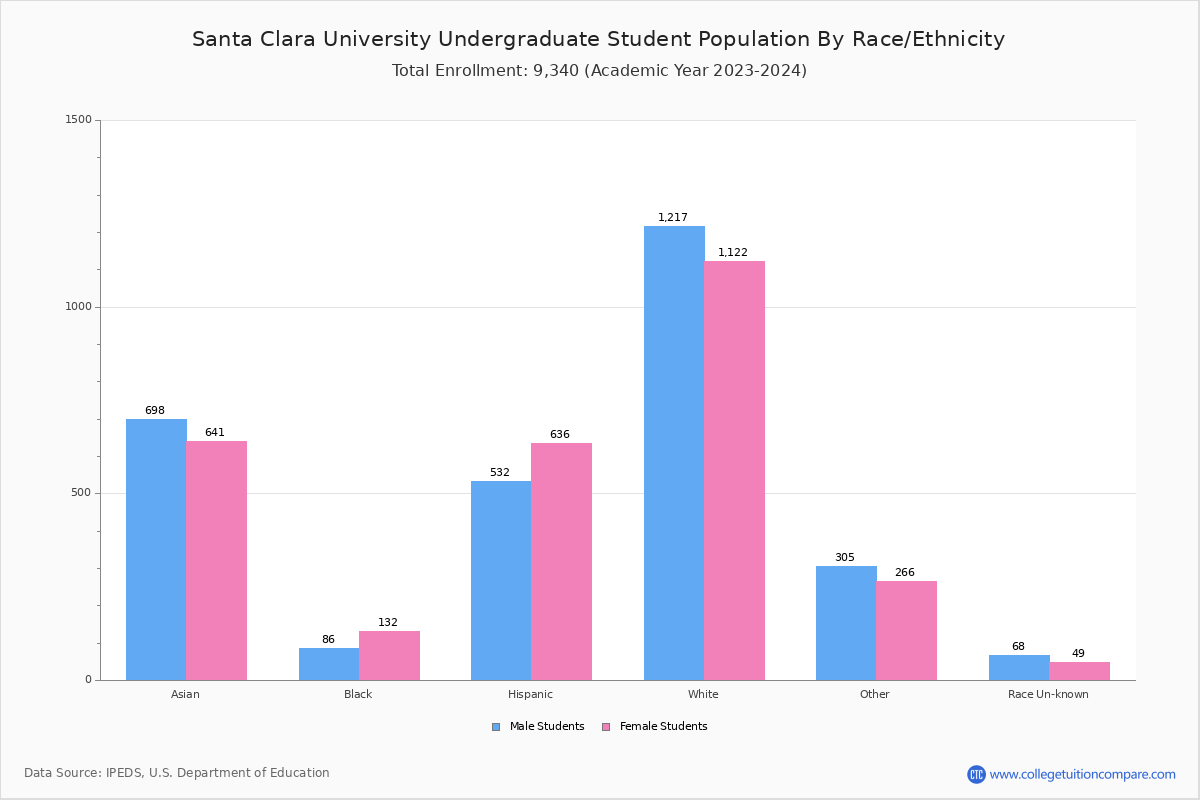
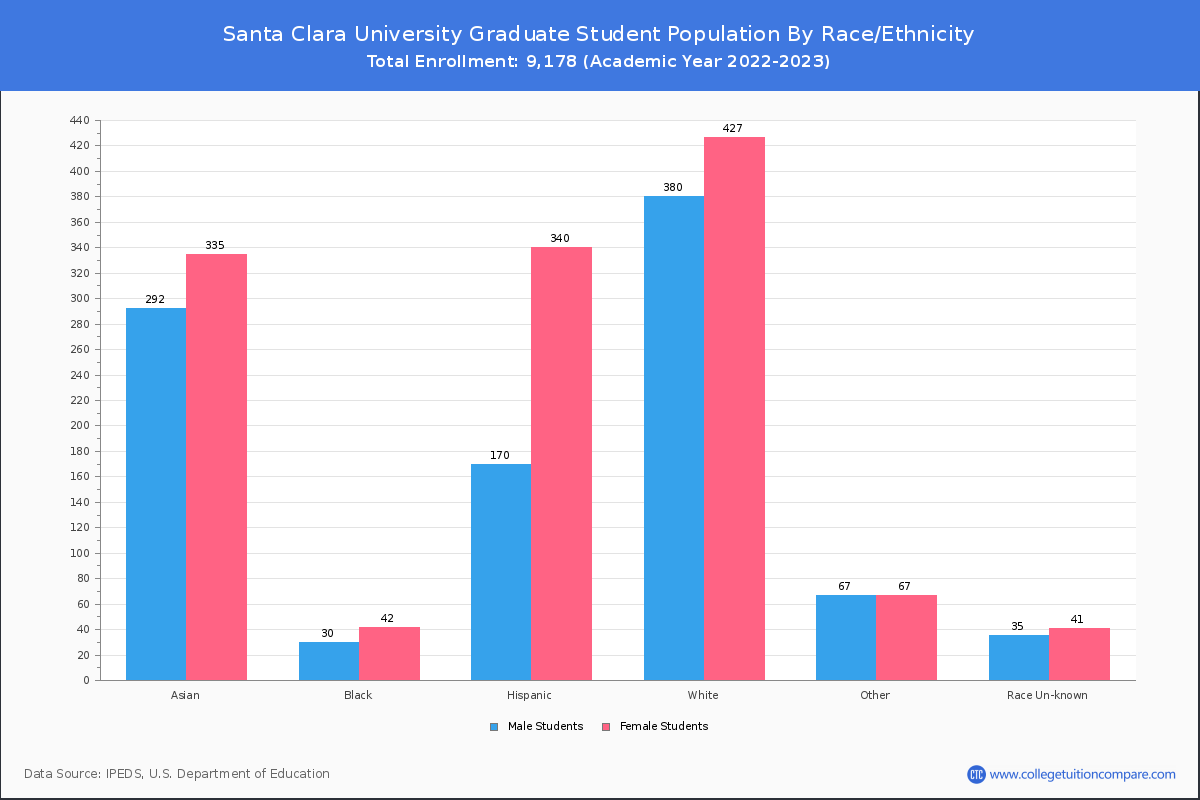
Student Distribution by Race/Ethnicity
By race/ethnicity, 3,184 White, 267 Black, and 1,884 Asian students out of a total of 9,178 are attending at Santa Clara University. Comprehensive enrollment statistic data by race/ethnicity is shown in the next chart (Academic year 2022-2023 data).
| Race | Total | Men | Women |
|---|---|---|---|
| American Indian or Native American | 4 | 2 | 2 |
| Asian | 1,884 | 931 | 953 |
| Black | 267 | 121 | 146 |
| Hispanic | 1,638 | 699 | 939 |
| Native Hawaiian or Other Pacific Islanders | 16 | 7 | 9 |
| White | 3,184 | 1,598 | 1,586 |
| Two or more races | 709 | 359 | 350 |
| Race Unknown | 171 | 93 | 78 |
| Race | Total | Men | Women |
|---|---|---|---|
| American Indian or Native American | 4 | 2 | 2 |
| Asian | 1,284 | 679 | 605 |
| Black | 190 | 92 | 98 |
| Hispanic | 1,127 | 530 | 597 |
| Native Hawaiian or Other Pacific Islanders | 11 | 6 | 5 |
| White | 2,433 | 1,248 | 1,185 |
| Two or more races | 581 | 298 | 283 |
| Race Unknown | 105 | 65 | 40 |
| Race | Total | Men | Women |
|---|---|---|---|
| American Indian or Native American | 0 | 0 | 0 |
| Asian | 47 | 24 | 23 |
| Black | 3 | 3 | 0 |
| Hispanic | 46 | 24 | 22 |
| Native Hawaiian or Other Pacific Islanders | 0 | 0 | 0 |
| White | 72 | 42 | 30 |
| Two or more races | 12 | 6 | 6 |
| Race Unknown | 4 | 3 | 1 |
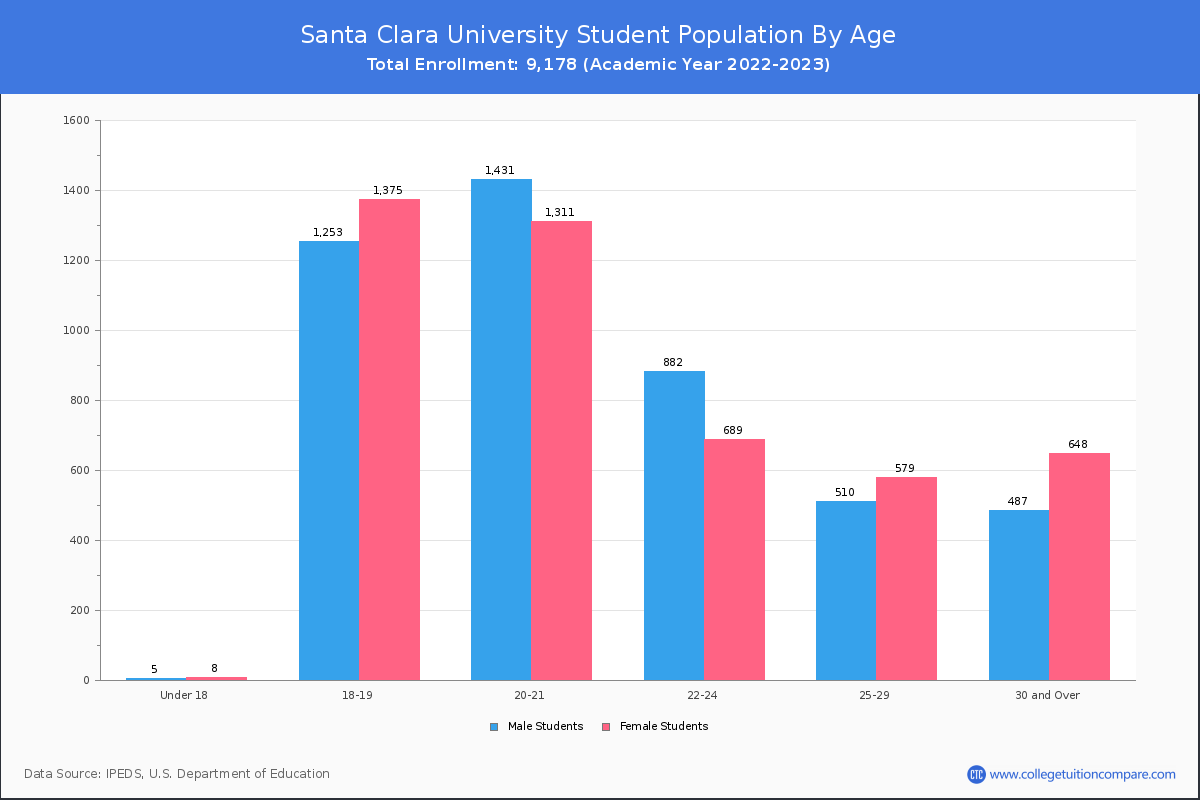
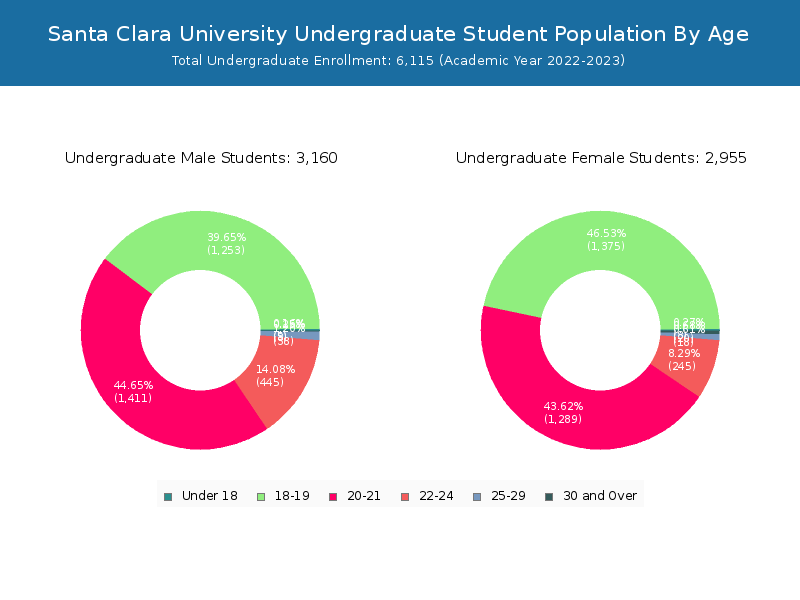
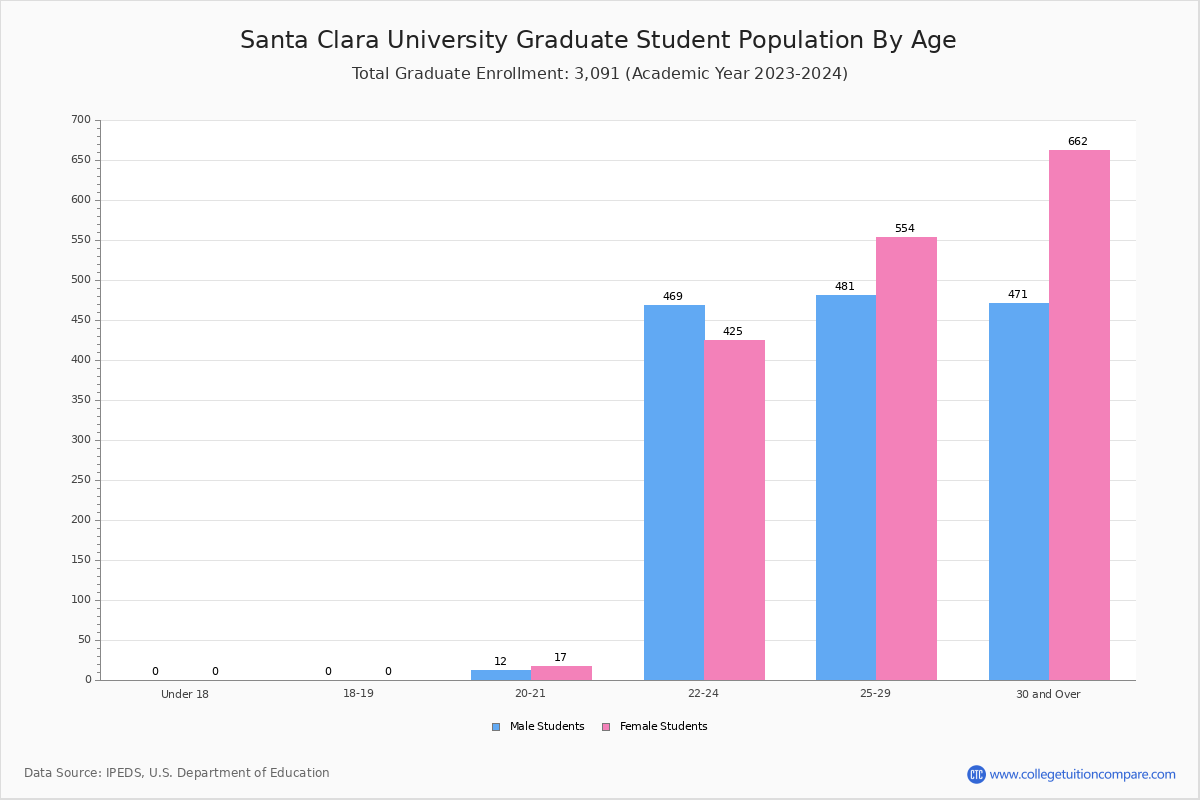
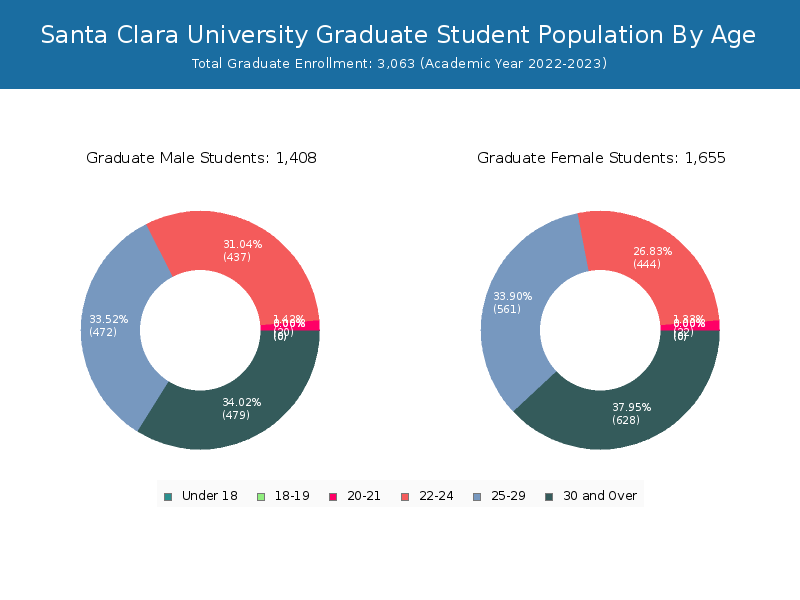
Student Age Distribution
By age, SCU has 13 students under 18 years old and 15 students over 65 years old. There are 6,954 students under 25 years old, and 2,224 students over 25 years old out of 9,178 total students.
SCU has 6,031 undergraduate students aged under 25 and 84 students aged 25 and over.
It has 923 graduate students aged under 25 and 2,140 students aged 25 and over.

| Age | Total | Men | Women |
|---|---|---|---|
| Under 18 | 13 | 8 | 5 |
| 18-19 | 2,628 | 1,375 | 1,253 |
| 20-21 | 2,742 | 1,311 | 1,431 |
| 22-24 | 1,571 | 689 | 882 |
| 25-29 | 1,089 | 579 | 510 |
| 30-34 | 458 | 258 | 200 |
| 35-39 | 240 | 129 | 111 |
| 40-49 | 280 | 171 | 109 |
| 50-64 | 142 | 83 | 59 |
| Over 65 | 15 | 7 | 8 |
| Age | Total | Men | Women |
|---|---|---|---|
| Under 18 | 13 | 8 | 5 |
| 18-19 | 2,628 | 1,375 | 1,253 |
| 20-21 | 2,700 | 1,289 | 1,411 |
| 22-24 | 690 | 245 | 445 |
| 25-29 | 56 | 18 | 38 |
| 30-34 | 16 | 11 | 5 |
| 35-39 | 3 | 2 | 1 |
| 40-49 | 5 | 5 | 0 |
| 50-64 | 4 | 2 | 2 |
| Age | Total | Men | Women |
|---|
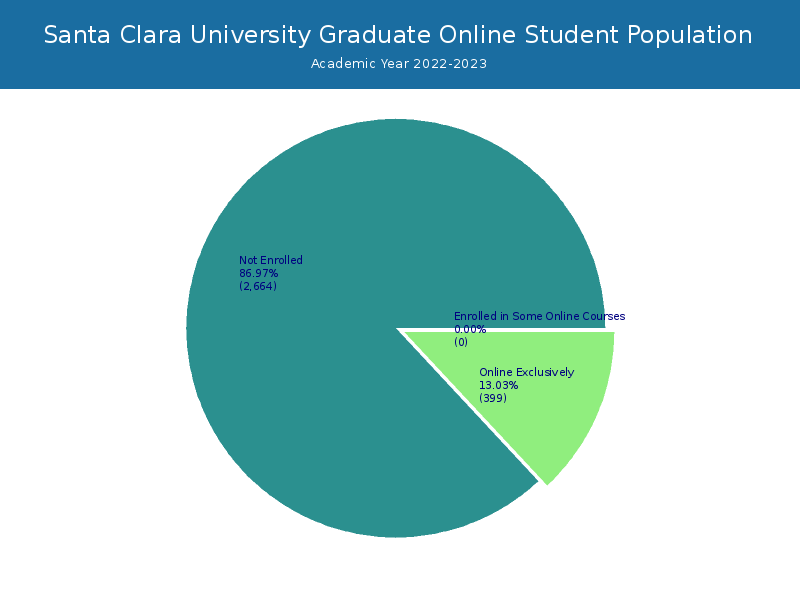
Online Student Enrollment
Distance learning, also called online education, is very attractive to students, especially who want to continue education and work in field. At Santa Clara University, 399 students are enrolled exclusively in online courses and 0 students are enrolled in some online courses.
322 students lived in California or jurisdiction in which the school is located are enrolled exclusively in online courses and 77 students live in other State or outside of the United States.
| All Students | Enrolled Exclusively Online Courses | Enrolled in Some Online Courses | |
|---|---|---|---|
| All Students | 9,178 | 399 | 0 |
| Undergraduate | 6,115 | 0 | 0 |
| Graduate | 3,063 | 399 | 0 |
| California Residents | Other States in U.S. | Outside of U.S. | |
|---|---|---|---|
| All Students | 322 | 53 | 24 |
| Undergraduate | 0 | - | 0 |
| Graduate | 322 | 53 | 24 |
Transfer-in Students (Undergraduate)
Among 6,115 enrolled in undergraduate programs, 196 students have transferred-in from other institutions. The percentage of transfer-in students is 3.21%.190 students have transferred in as full-time status and 6 students transferred in as part-time status.
| Number of Students | |
|---|---|
| Regular Full-time | 5,808 |
| Transfer-in Full-time | 190 |
| Regular Part-time | 111 |
| Transfer-in Part-time | 6 |