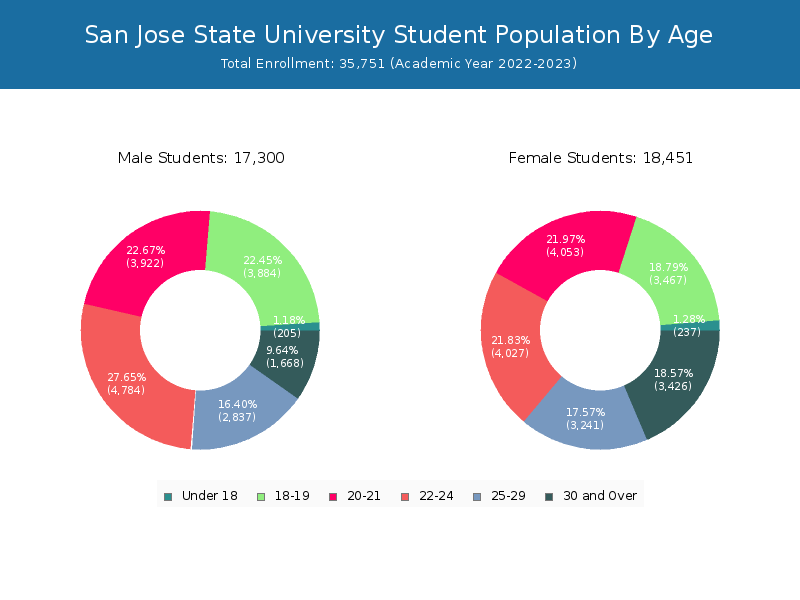
Student Population by Gender
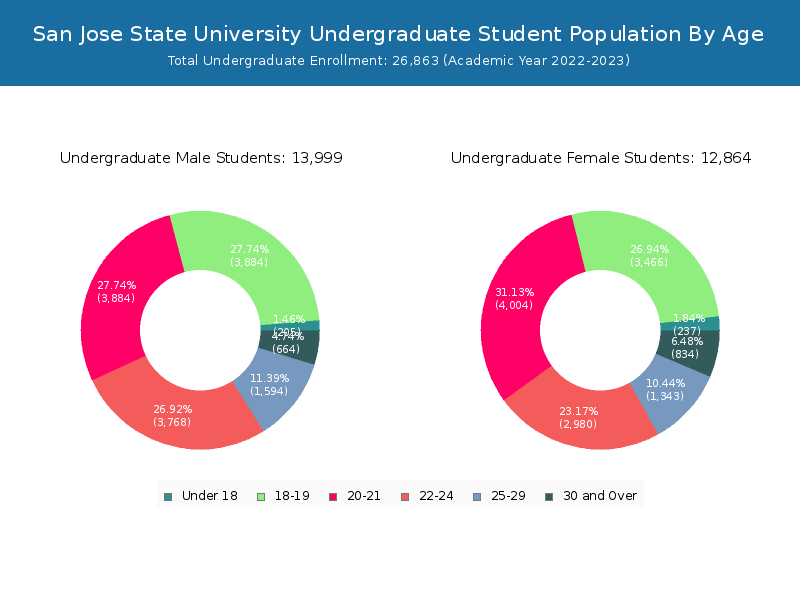
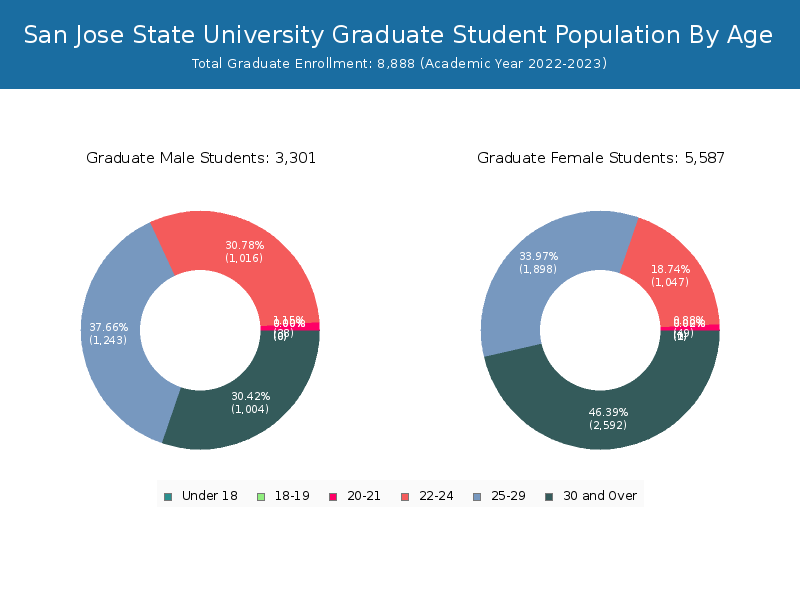
San Jose State University has a total of 35,751 enrolled students for the academic year 2022-2023. 26,863 students have enrolled in undergraduate programs and 8,888 students joined graduate programs.
By gender, 17,300 male and 18,451 female students (the male-female ratio is 48:52) are attending the school. The gender distribution is based on the 2022-2023 data.
| Total | Undergraduate | Graduate | |
|---|---|---|---|
| Total | 35,751 | 26,863 | 8,888 |
| Men | 17,300 | 13,999 | 3,301 |
| Women | 18,451 | 12,864 | 5,587 |
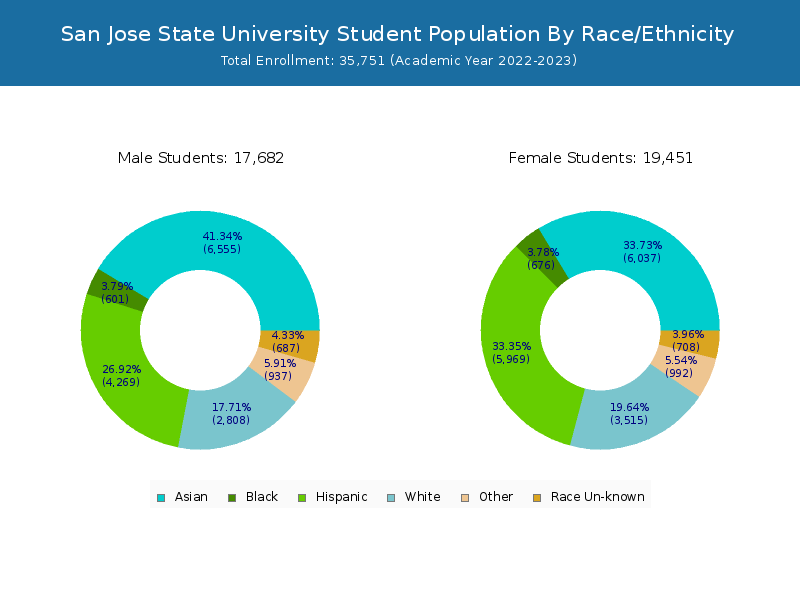
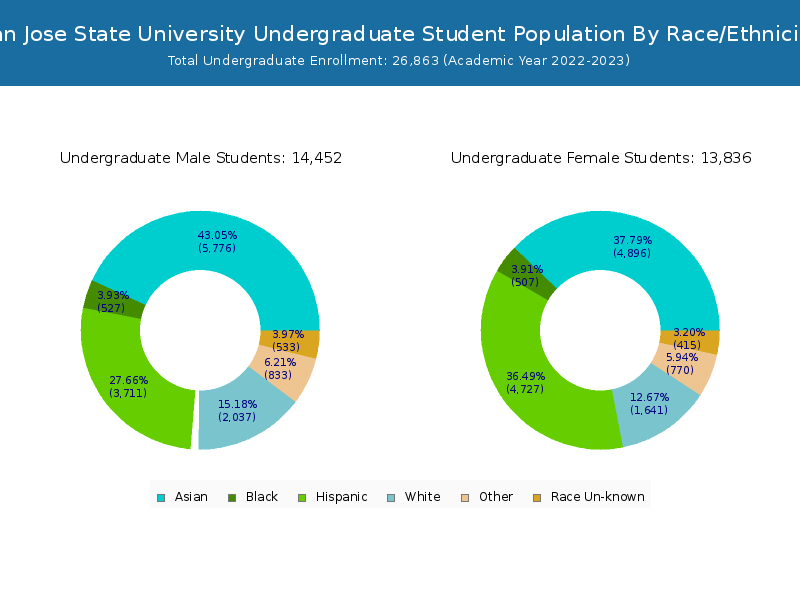
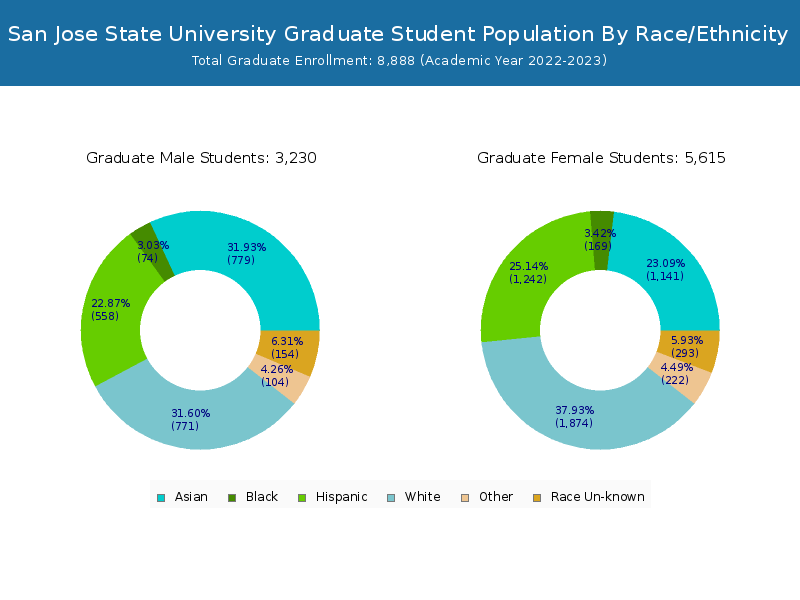
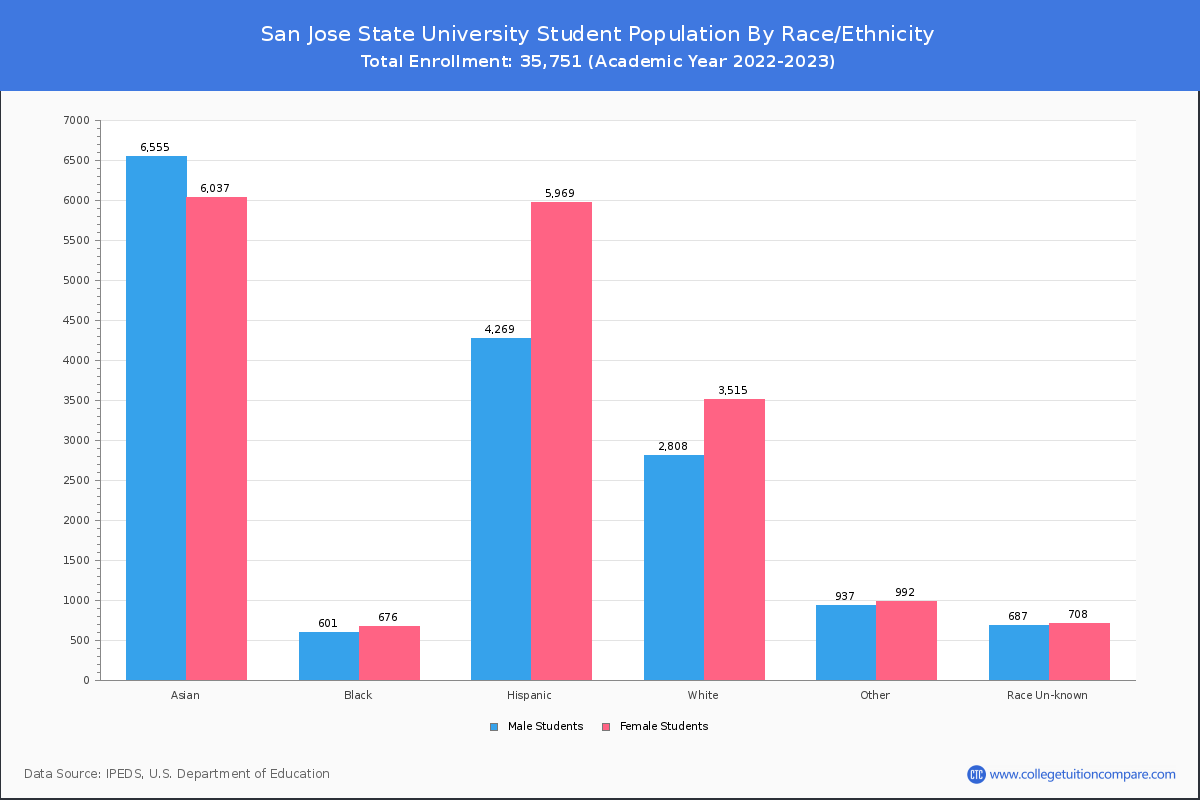
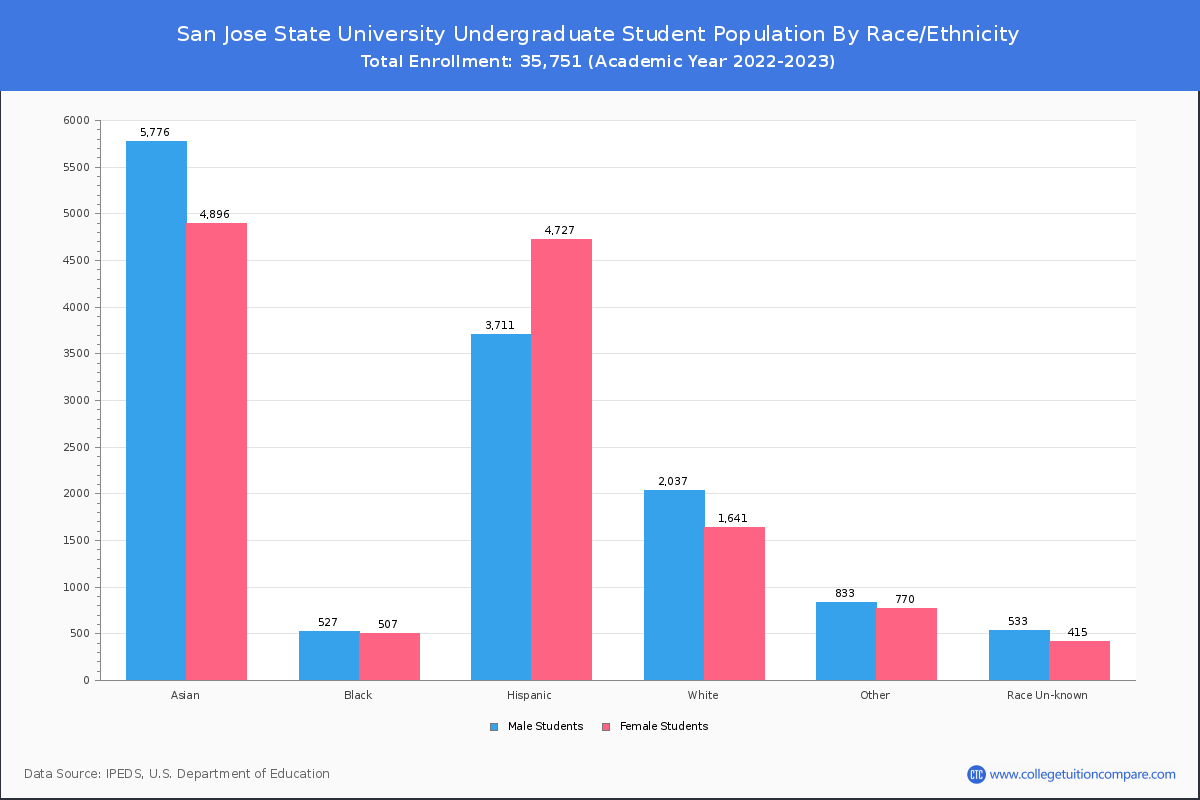
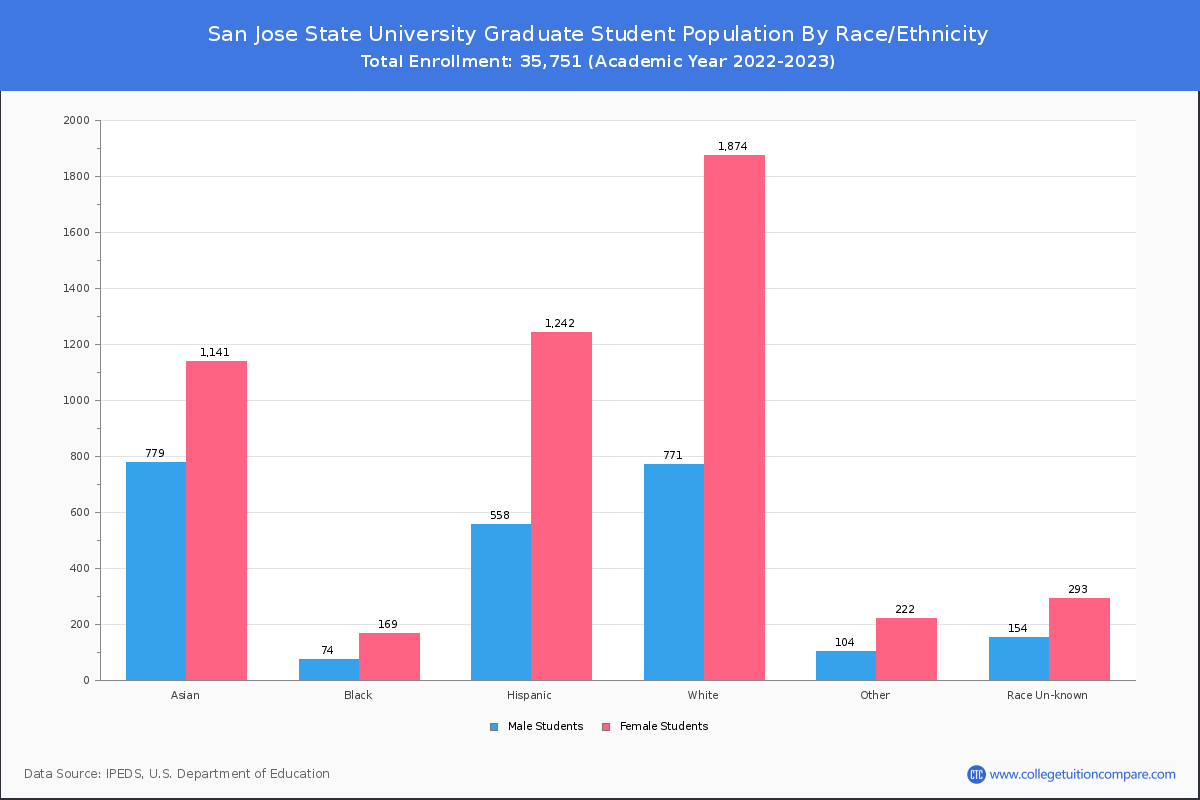
Student Distribution by Race/Ethnicity
By race/ethnicity, 5,934 White, 1,181 Black, and 12,304 Asian students out of a total of 35,751 are attending at San Jose State University. Comprehensive enrollment statistic data by race/ethnicity is shown in the next chart (Academic year 2022-2023 data).
| Race | Total | Men | Women |
|---|---|---|---|
| American Indian or Native American | 46 | 22 | 24 |
| Asian | 12,304 | 6,538 | 5,766 |
| Black | 1,181 | 580 | 601 |
| Hispanic | 10,143 | 4,268 | 5,875 |
| Native Hawaiian or Other Pacific Islanders | 147 | 85 | 62 |
| White | 5,934 | 2,569 | 3,365 |
| Two or more races | 1,653 | 823 | 830 |
| Race Unknown | 1,292 | 616 | 676 |
| Race | Total | Men | Women |
|---|---|---|---|
| American Indian or Native American | 21 | 13 | 8 |
| Asian | 10,498 | 5,847 | 4,651 |
| Black | 965 | 517 | 448 |
| Hispanic | 8,396 | 3,761 | 4,635 |
| Native Hawaiian or Other Pacific Islanders | 128 | 79 | 49 |
| White | 3,424 | 1,891 | 1,533 |
| Two or more races | 1,372 | 731 | 641 |
| Race Unknown | 883 | 488 | 395 |
| Race | Total | Men | Women |
|---|---|---|---|
| American Indian or Native American | 3 | 1 | 2 |
| Asian | 1,108 | 618 | 490 |
| Black | 92 | 52 | 40 |
| Hispanic | 1,161 | 501 | 660 |
| Native Hawaiian or Other Pacific Islanders | 17 | 10 | 7 |
| White | 487 | 242 | 245 |
| Two or more races | 153 | 86 | 67 |
| Race Unknown | 112 | 61 | 51 |
Student Age Distribution
By age, San Jose State has 442 students under 18 years old and 37 students over 65 years old. There are 24,579 students under 25 years old, and 11,172 students over 25 years old out of 35,751 total students.
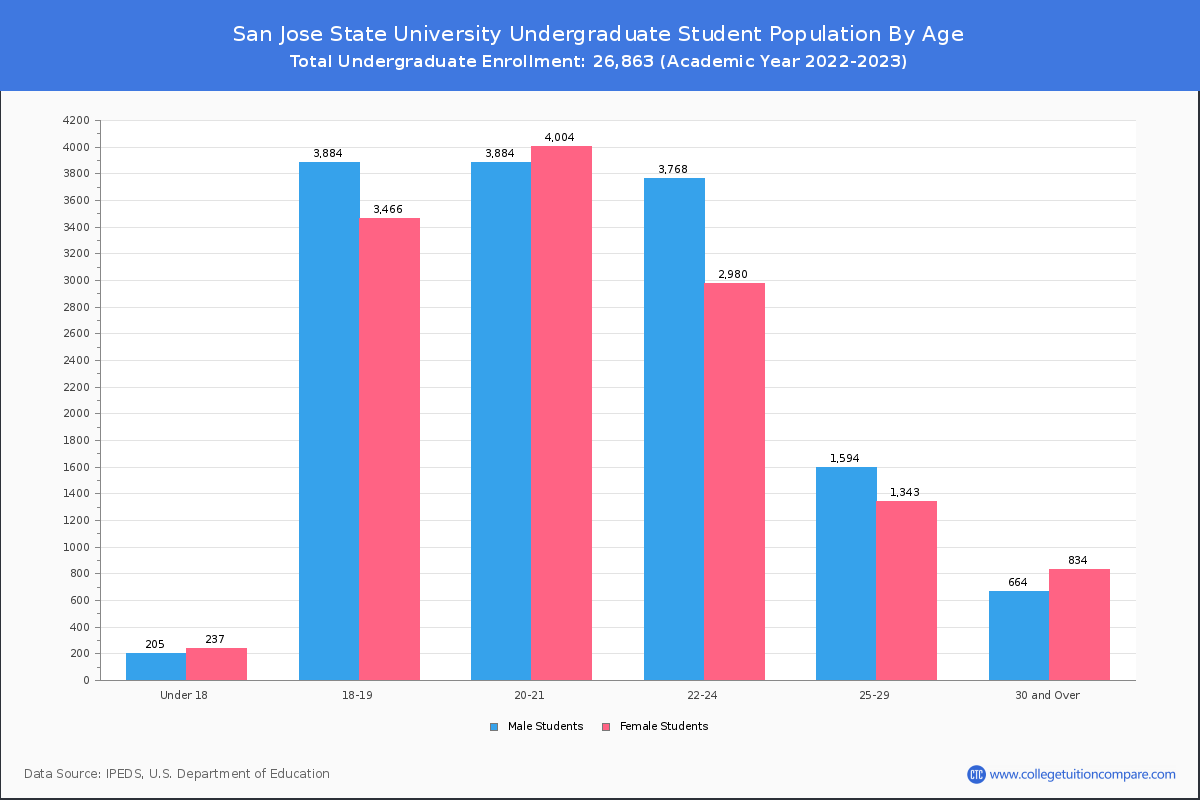
In undergraduate programs, 442 students are younger than 18 and 10 students are older than 65. San Jose State has 22,428 undergraduate students aged under 25 and 4,435 students aged 25 and over.
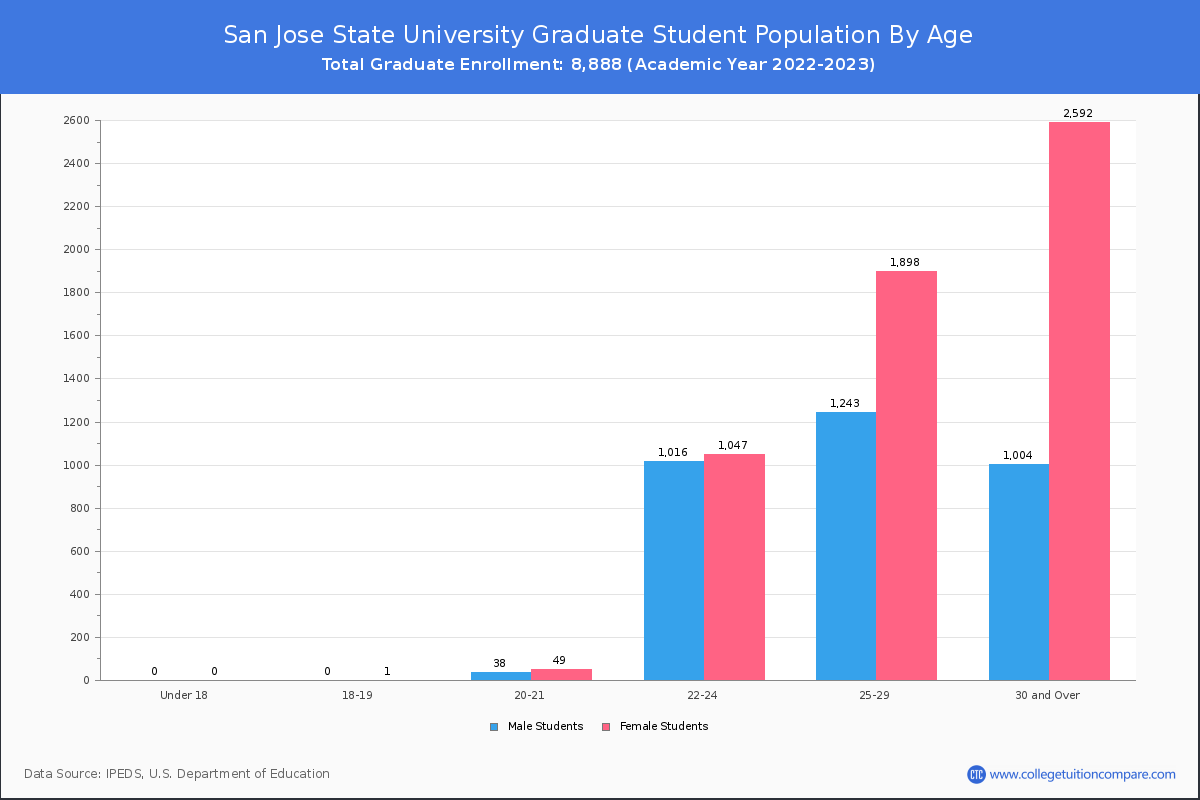
It has 2,151 graduate students aged under 25 and 6,737 students aged 25 and over.
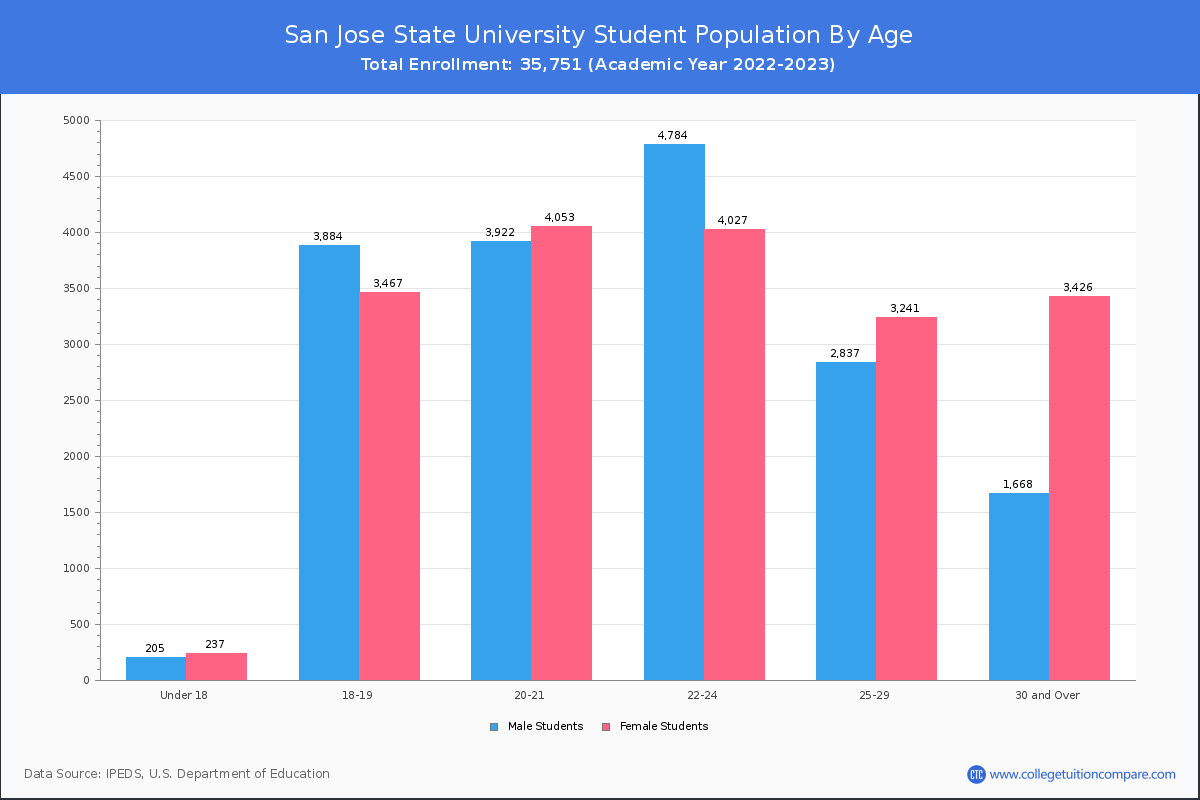
| Age | Total | Men | Women |
|---|---|---|---|
| Under 18 | 442 | 237 | 205 |
| 18-19 | 7,351 | 3,467 | 3,884 |
| 20-21 | 7,975 | 4,053 | 3,922 |
| 22-24 | 8,811 | 4,027 | 4,784 |
| 25-29 | 6,078 | 3,241 | 2,837 |
| 30-34 | 2,337 | 1,470 | 867 |
| 35-39 | 1,058 | 712 | 346 |
| 40-49 | 1,105 | 803 | 302 |
| 50-64 | 557 | 415 | 142 |
| Over 65 | 37 | 26 | 11 |
| Age | Total | Men | Women |
|---|---|---|---|
| Under 18 | 442 | 237 | 205 |
| 18-19 | 7,350 | 3,466 | 3,884 |
| 20-21 | 7,888 | 4,004 | 3,884 |
| 22-24 | 6,748 | 2,980 | 3,768 |
| 25-29 | 2,937 | 1,343 | 1,594 |
| 30-34 | 815 | 414 | 401 |
| 35-39 | 321 | 185 | 136 |
| 40-49 | 259 | 168 | 91 |
| 50-64 | 93 | 62 | 31 |
| Over 65 | 10 | 5 | 5 |
| Age | Total | Men | Women |
|---|
Online Student Enrollment
Distance learning, also called online education, is very attractive to students, especially who want to continue education and work in field. At San Jose State University, 5,790 students are enrolled exclusively in online courses and 19,698 students are enrolled in some online courses.
4,613 students lived in California or jurisdiction in which the school is located are enrolled exclusively in online courses and 1,177 students live in other State or outside of the United States.
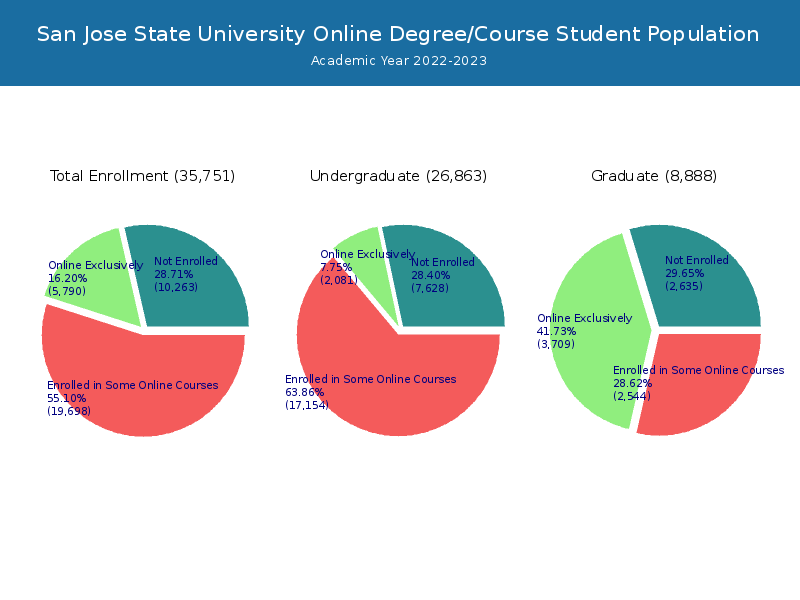
| All Students | Enrolled Exclusively Online Courses | Enrolled in Some Online Courses | |
|---|---|---|---|
| All Students | 35,751 | 5,790 | 19,698 |
| Undergraduate | 26,863 | 2,081 | 17,154 |
| Graduate | 8,888 | 3,709 | 2,544 |
| California Residents | Other States in U.S. | Outside of U.S. | |
|---|---|---|---|
| All Students | 4,613 | 842 | 335 |
| Undergraduate | 2,033 | 5 | 43 |
| Graduate | 2,580 | 837 | 292 |
Transfer-in Students (Undergraduate)
Among 26,863 enrolled in undergraduate programs, 3,289 students have transferred-in from other institutions. The percentage of transfer-in students is 12.24%.2,619 students have transferred in as full-time status and 670 students transferred in as part-time status.
| Number of Students | |
|---|---|
| Regular Full-time | 19,007 |
| Transfer-in Full-time | 2,619 |
| Regular Part-time | 4,567 |
| Transfer-in Part-time | 670 |