Student Population by Gender
Auburn University has a total of 31,764 enrolled students for the academic year 2022-2023. 25,379 students have enrolled in undergraduate programs and 6,385 students joined graduate programs.
By gender, 15,678 male and 16,086 female students (the male-female ratio is 49:51) are attending the school. The gender distribution is based on the 2022-2023 data.
| Total | Undergraduate | Graduate | |
|---|---|---|---|
| Total | 31,764 | 25,379 | 6,385 |
| Men | 15,678 | 12,684 | 2,994 |
| Women | 16,086 | 12,695 | 3,391 |
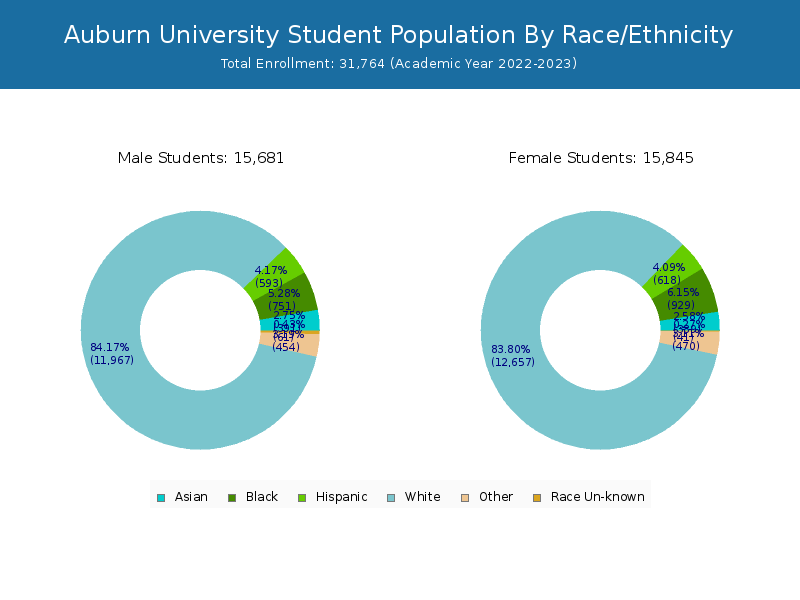
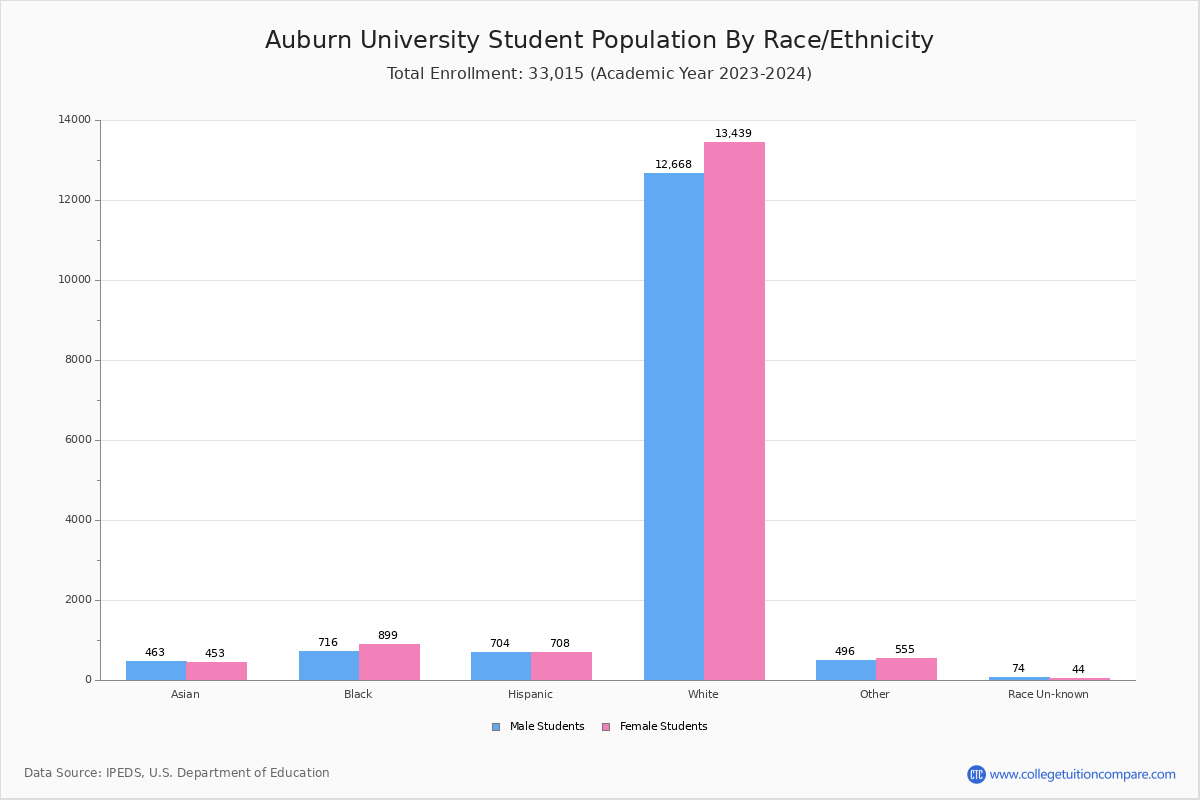
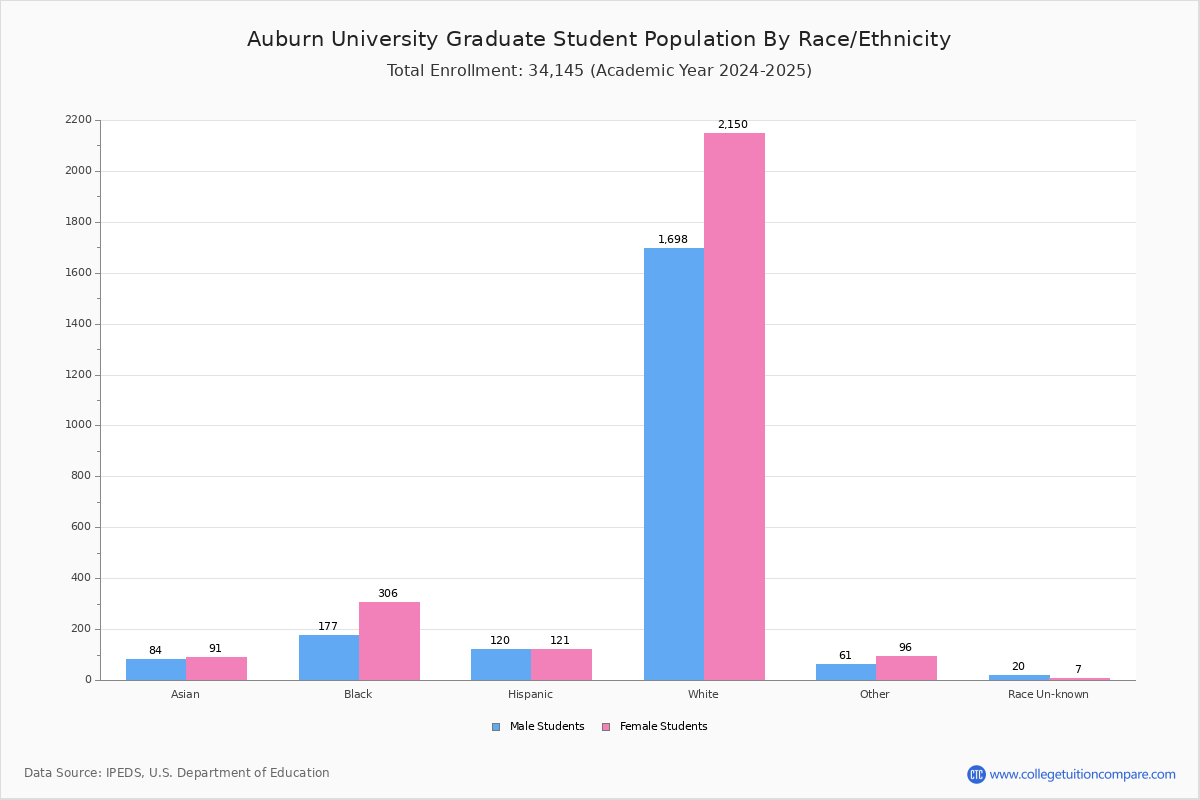
Student Distribution by Race/Ethnicity
By race/ethnicity, 25,007 White, 1,560 Black, and 895 Asian students out of a total of 31,764 are attending at Auburn University. Comprehensive enrollment statistic data by race/ethnicity is shown in the next chart (Academic year 2022-2023 data).
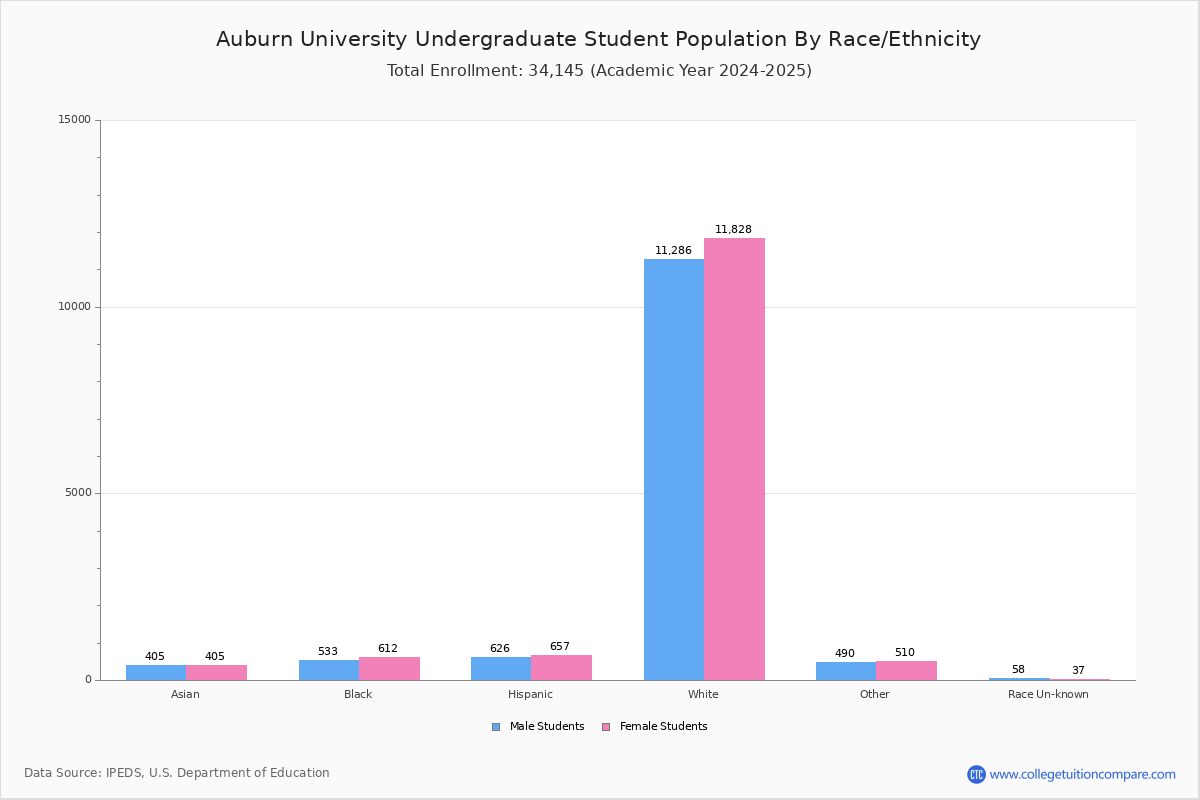
| Race | Total | Men | Women |
|---|---|---|---|
| American Indian or Native American | 78 | 36 | 42 |
| Asian | 895 | 453 | 442 |
| Black | 1,560 | 687 | 873 |
| Hispanic | 1,270 | 620 | 650 |
| Native Hawaiian or Other Pacific Islanders | 19 | 10 | 9 |
| White | 25,007 | 12,115 | 12,892 |
| Two or more races | 873 | 417 | 456 |
| Race Unknown | 109 | 64 | 45 |
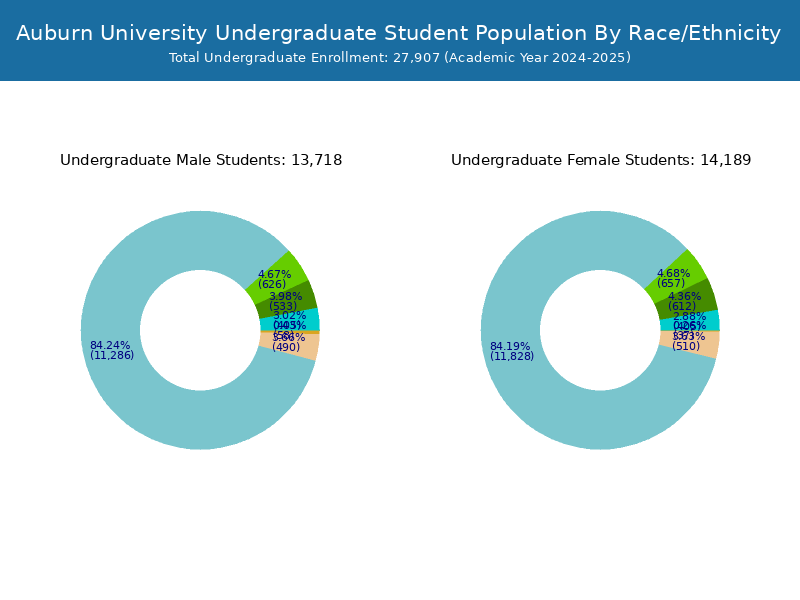
| Race | Total | Men | Women |
|---|---|---|---|
| American Indian or Native American | 63 | 30 | 33 |
| Asian | 705 | 368 | 337 |
| Black | 1,079 | 508 | 571 |
| Hispanic | 1,003 | 490 | 513 |
| Native Hawaiian or Other Pacific Islanders | 16 | 10 | 6 |
| White | 20,954 | 10,313 | 10,641 |
| Two or more races | 733 | 369 | 364 |
| Race Unknown | 76 | 42 | 34 |
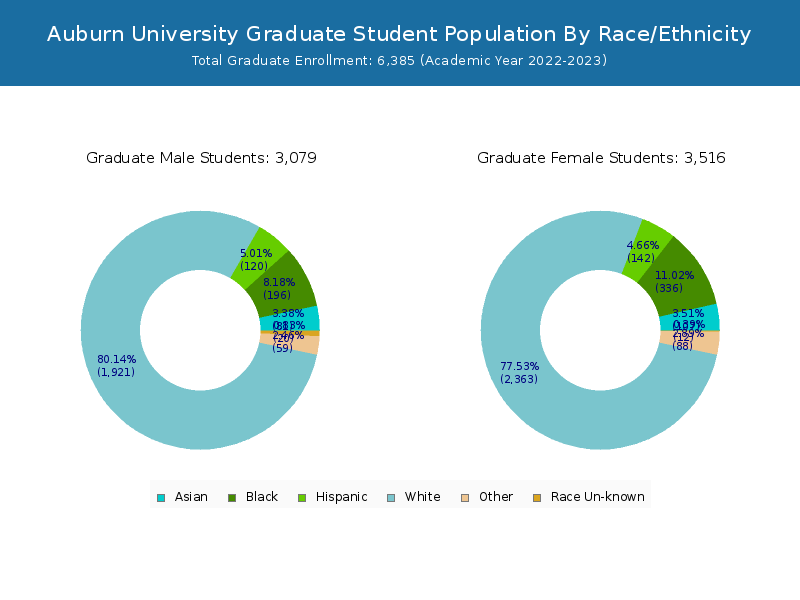
| Race | Total | Men | Women |
|---|---|---|---|
| American Indian or Native American | 4 | 3 | 1 |
| Asian | 30 | 16 | 14 |
| Black | 87 | 45 | 42 |
| Hispanic | 62 | 28 | 34 |
| Native Hawaiian or Other Pacific Islanders | 2 | 0 | 2 |
| White | 873 | 463 | 410 |
| Two or more races | 40 | 22 | 18 |
| Race Unknown | 4 | 2 | 2 |
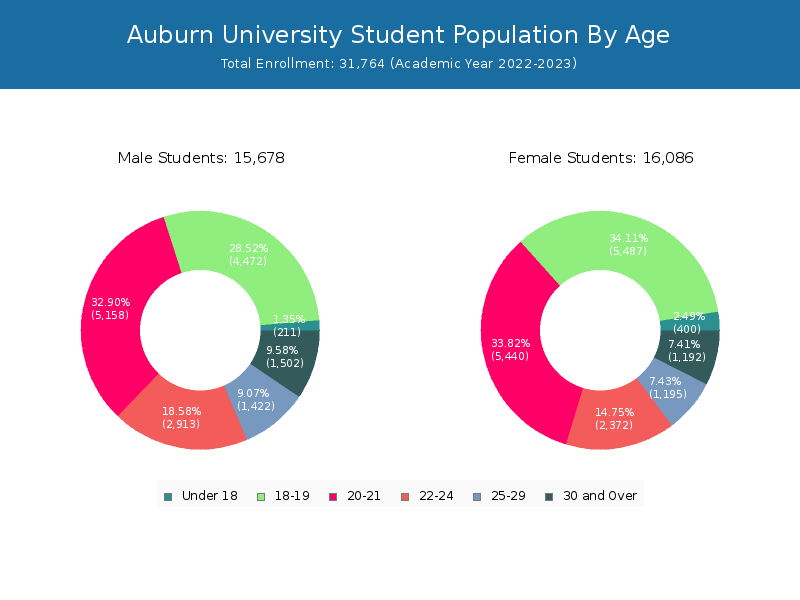
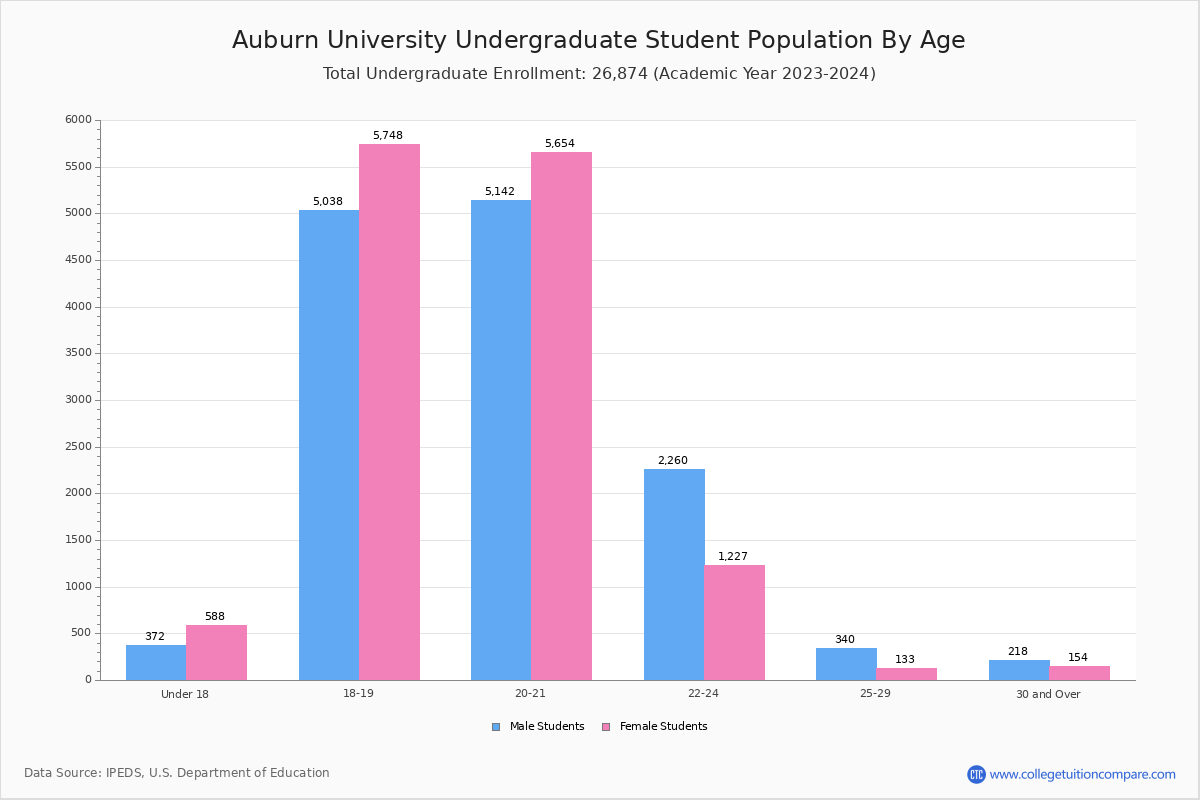
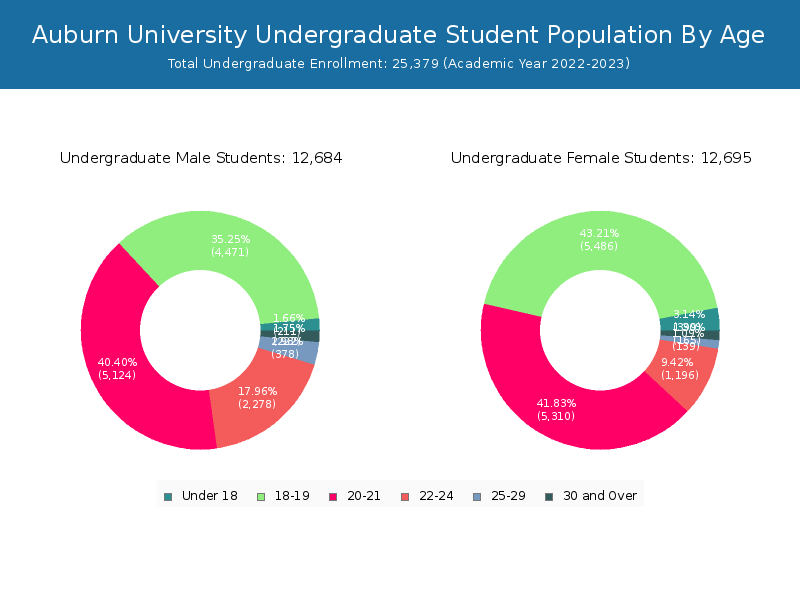
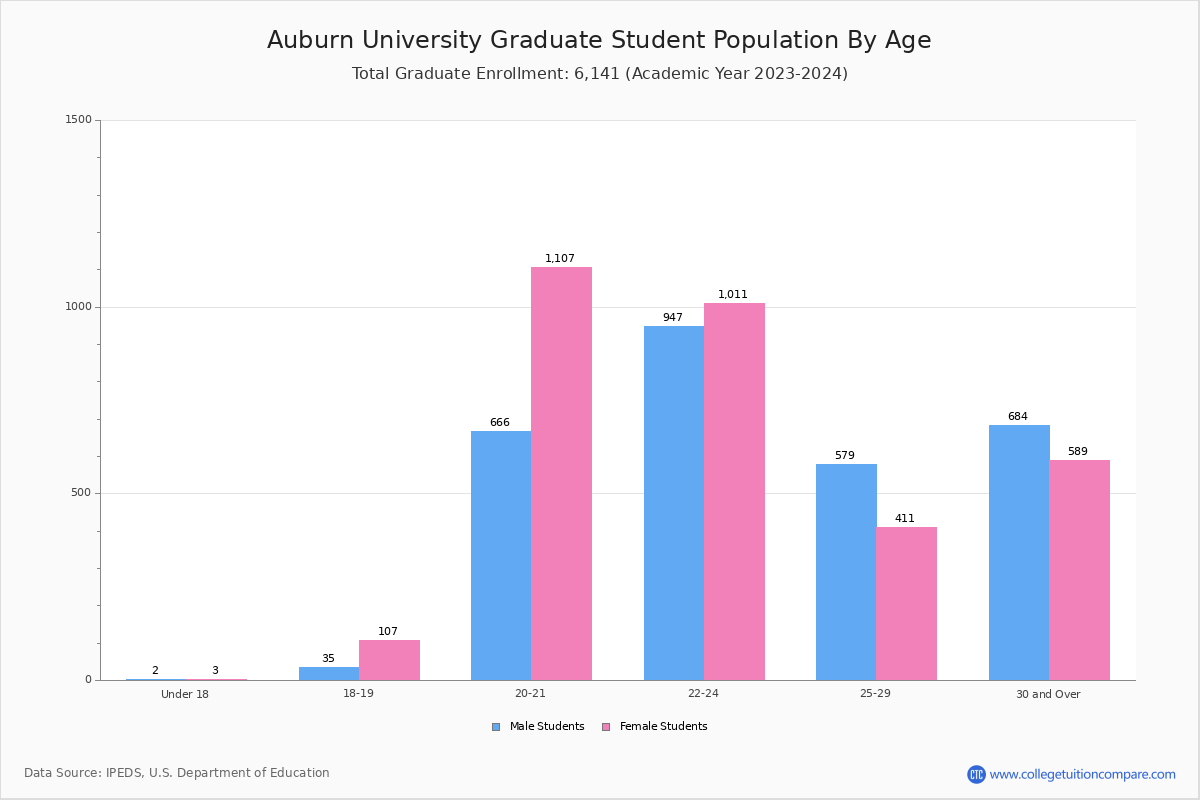
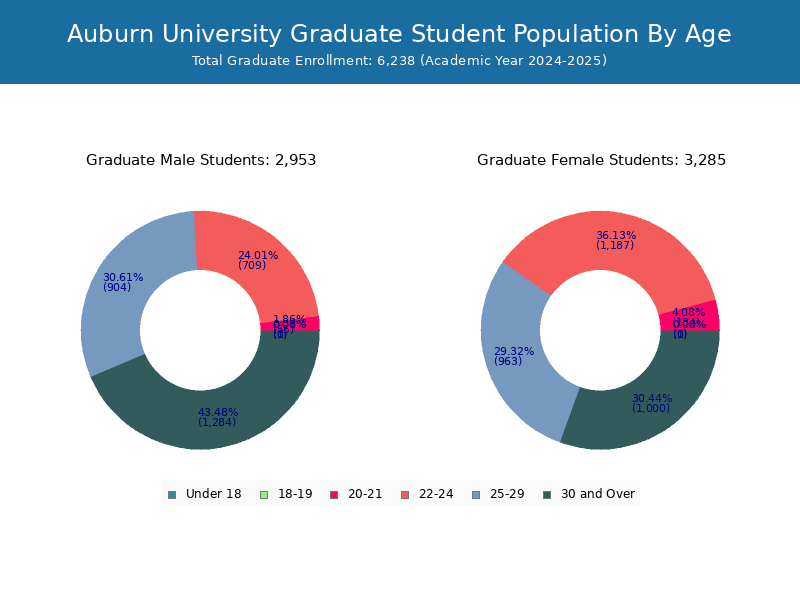
Student Age Distribution
By age, Auburn has 611 students under 18 years old and 16 students over 65 years old. There are 26,453 students under 25 years old, and 5,311 students over 25 years old out of 31,764 total students.
In undergraduate programs, 610 students are younger than 18 and 2 students are older than 65. Auburn has 24,475 undergraduate students aged under 25 and 904 students aged 25 and over.
In graduate schools at Auburn, 1 students are younger than 18 and 14 students are older than 65. It has 1,978 graduate students aged under 25 and 4,407 students aged 25 and over.
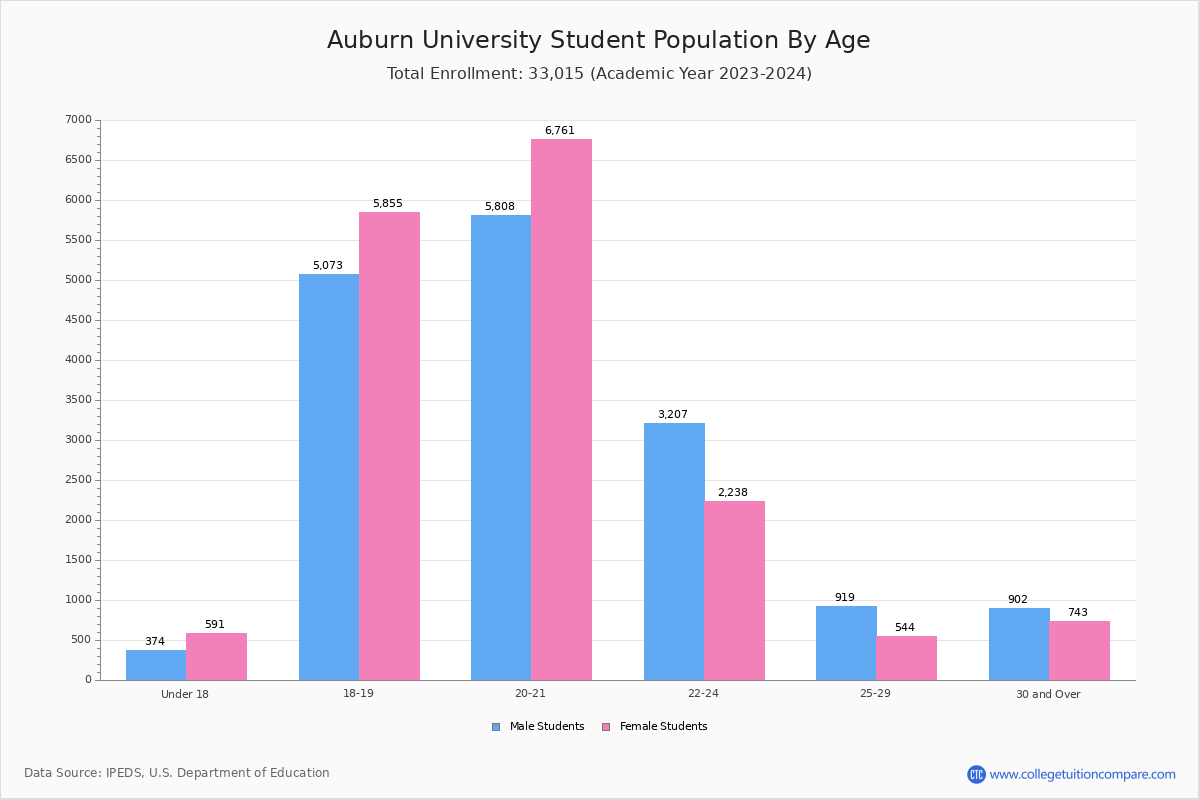
| Age | Total | Men | Women |
|---|---|---|---|
| Under 18 | 611 | 400 | 211 |
| 18-19 | 9,959 | 5,487 | 4,472 |
| 20-21 | 10,598 | 5,440 | 5,158 |
| 22-24 | 5,285 | 2,372 | 2,913 |
| 25-29 | 2,617 | 1,195 | 1,422 |
| 30-34 | 1,168 | 487 | 681 |
| 35-39 | 605 | 268 | 337 |
| 40-49 | 630 | 291 | 339 |
| 50-64 | 275 | 138 | 137 |
| Over 65 | 16 | 8 | 8 |
| Age | Total | Men | Women |
|---|---|---|---|
| Under 18 | 610 | 399 | 211 |
| 18-19 | 9,957 | 5,486 | 4,471 |
| 20-21 | 10,434 | 5,310 | 5,124 |
| 22-24 | 3,474 | 1,196 | 2,278 |
| 25-29 | 517 | 139 | 378 |
| 30-34 | 178 | 63 | 115 |
| 35-39 | 78 | 36 | 42 |
| 40-49 | 96 | 50 | 46 |
| 50-64 | 33 | 14 | 19 |
| Over 65 | 2 | 2 | 0 |
| Age | Total | Men | Women |
|---|---|---|---|
| Under 18 | 1 | 1 | 0 |
| 18-19 | 2 | 1 | 1 |
| 20-21 | 164 | 130 | 34 |
| 22-24 | 1,811 | 1,176 | 635 |
| 25-29 | 2,100 | 1,056 | 1,044 |
| 30-34 | 990 | 424 | 566 |
| 35-39 | 527 | 232 | 295 |
| 40-49 | 534 | 241 | 293 |
| 50-64 | 242 | 124 | 118 |
| Over 65 | 14 | 6 | 8 |
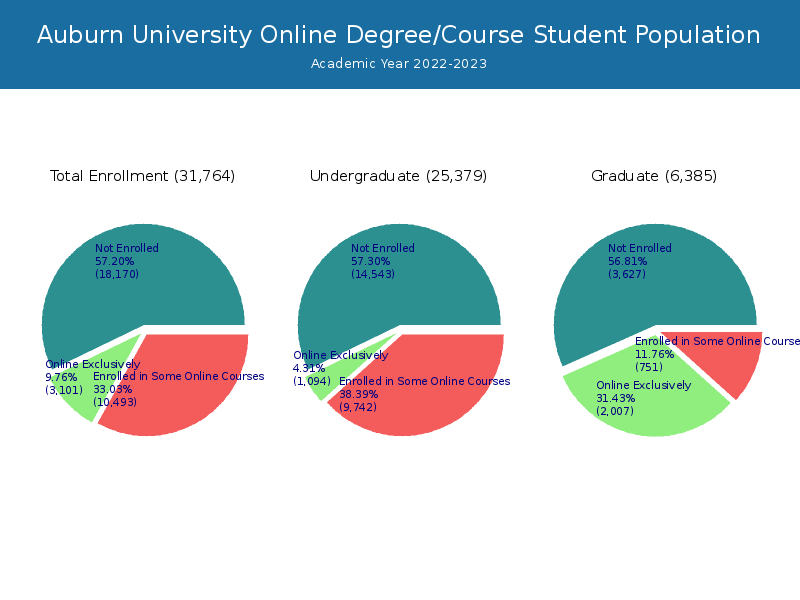
Online Student Enrollment
Distance learning, also called online education, is very attractive to students, especially who want to continue education and work in field. At Auburn University, 3,101 students are enrolled exclusively in online courses and 10,493 students are enrolled in some online courses.
1,470 students lived in Alabama or jurisdiction in which the school is located are enrolled exclusively in online courses and 1,631 students live in other State or outside of the United States.
| All Students | Enrolled Exclusively Online Courses | Enrolled in Some Online Courses | |
|---|---|---|---|
| All Students | 31,764 | 3,101 | 10,493 |
| Undergraduate | 25,379 | 1,094 | 9,742 |
| Graduate | 6,385 | 2,007 | 751 |
| Alabama Residents | Other States in U.S. | Outside of U.S. | |
|---|---|---|---|
| All Students | 1,470 | 1,630 | 1 |
| Undergraduate | 736 | 357 | 1 |
| Graduate | 734 | 1,273 | 0 |
Transfer-in Students (Undergraduate)
Among 25,379 enrolled in undergraduate programs, 1,121 students have transferred-in from other institutions. The percentage of transfer-in students is 4.42%.969 students have transferred in as full-time status and 152 students transferred in as part-time status.
| Number of Students | |
|---|---|
| Regular Full-time | 22,010 |
| Transfer-in Full-time | 969 |
| Regular Part-time | 2,248 |
| Transfer-in Part-time | 152 |